

Abstract
Purpose
To use 3D radial ultrashort echo time MRI to perform whole-lung oxygen-enhanced (OE) imaging in humans.
Methods
Eight healthy human subjects underwent two 3D radial UTE MRI acquisitions (TE = 0.08 ms): one while breathing 21% O2 and the other while breathing 100% O2. Scans were each performed over 5 minutes of free breathing, using prospective respiratory gating. For comparison purposes, conventional echo time (TE = 2.1 ms) images were acquired simultaneously during each acquisition using a radial “outward-inward” k-space trajectory. 3D percent OE maps were generated from these images.
Results
3D OE maps showing lung signal enhancement were generated successfully in seven subjects (technical failure in one subject). Mean percent signal enhancement was 6.6% ± 1.8%, near the value predicted by theory of 6.3%. No significant enhancement was seen using the conventional echo time data, confirming the importance of UTE for this acquisition strategy.
Conclusion
3D radial UTE MRI shows promise as a method for OE MRI that enables whole-lung coverage and isotropic spatial resolution, in comparison to existing 2D OE methods that rely on a less time-efficient inversion recovery pulse sequence. These qualities may help OE MRI become a viable low-cost method for 3D imaging of lung function in human subjects.
Keywords: oxygen-enhanced, ventilation, lung, UTE, MRI, ultrashort echo time
INTRODUCTION
Several approaches to MRI of lung function have been developed in recent years. Most prominently, hyperpolarized gas magnetic resonance imaging (MRI) is a powerful and well-validated technique for imaging ventilation defects (1–3). Unlike more conventional nuclear scintigraphy (4), SPECT (5), and PET (6) imaging, hyperpolarized gas MRI is able to acquire images with high 3D spatial resolution and signal-to-noise (SNR) without the need for potentially harmful ionizing radiation. Moreover, hyperpolarized gas MRI has been successfully used in humans to detect disease severity and treatment effects in several diseases, including asthma (7, 8), exercise-induce bronchoconstriction (9, 10), chronic obstructive pulmonary disease (11), and emphysema (12). However, the routine clinical use of hyperpolarized noble gas MRI has in part been restricted by cost and limited access to the technology. Specific technical challenges include the cost of the noble gases (3He or 129Xe) and access to hyperpolarization hardware, radiofrequency coils, and broadband transceiver hardware. At present, with current hardware, trained personnel are required to coordinate hyperpolarization and gas delivery, while coil swaps are required between gas and proton imaging. Given these challenges, MRI methods capable of imaging lung ventilation with improved access and lower cost would have practical value for clinical translation.
Oxygen enhanced (OE) MRI (13, 14), first proposed over a decade ago (15), is an inexpensive alternative for pulmonary ventilation weighted imaging that uses inhaled molecular oxygen as an exogenous contrast agent. Oxygen is paramagnetic and therefore lowers the T1 of nearby protons. OE images are typically obtained by subtracting images acquired while breathing room air (21% oxygen) from those acquired while breathing 100% oxygen. The change in signal intensity or T1 between these two scan is widely considered to be predominantly ventilation-weighted. However, O2 freely diffuses into the blood and current evidence suggests that there is a perfusion component as well (16, 17). This technique is based on conventional proton imaging, so it may be performed on commercial scanners using readily available radiofrequency coils. This requires T1 weighted images, typically obtained using a 2D Inversion-Recovery Single Shot Fast Spin Echo (IR-SSFSE) acquisition with thick slices and incomplete lung coverage. Furthermore, the relatively small T1 shortening effect of O2 (~10%) (18) results in low SNR, and signal averaging over multiple acquisitions is necessary to obtain sufficient contrast to detect this signal.
Togao, et al (19) have recently demonstrated the alternative use of a 3D radial Ultrashort Echo Time sequence to acquire OE images and have demonstrated their utility in a rat model. The UTE approach mitigates the rapid T2* signal decay that limits the SNR of conventional proton-based lung imaging. This approach also provides full lung coverage with 3D isotropic spatial resolution and allows trivial co-registration of ventilation-weighted images with high-resolution structural images. Because the radial trajectory samples the center of k-space with every TR, the images are also robust to cardiac motion.
Given the favorable properties and promising results in animal models, the purpose of this work was to demonstrate the feasibility of using 3D radial UTE MRI for OE imaging in human subjects with standard commercial hardware. This approach has the potential for wide dissemination since oxygen gas and conventional proton MRI hardware are both broadly available.
METHODS
Theory
When a subject breathes 100% oxygen, both T1 and T2* in the lung are decreased by approximately 10% compared to the normal pulmonary gas concentration (18, 20). To better understand the potentially competing effects of these changes, it is useful to consider the expected signal changes with respect to T1 and T2*. The steady state signal (S) measured by a spoiled gradient echo (SPGR) sequence (21) is:
| Eq. [1] |
where M0 is the initial longitudinal magnetization, θ is the flip angle, and TR, TE, T1, and T2* have their conventional definitions (22). In the case of normal lung tissue, the T2* is short (1–2ms) (20) and the T1 is long (1–2s) (18, 23). Thus SPGR of lung structures collected at conventional echo times (TE ≈ T2*) are dominantly T2* weighted, with ~60% of the signal being lost before the echo time. This sensitivity to T2* is one reason why fast spin echo (FSE) approaches are typically used for lung imaging. However, SPGR with ultrashort echo time (TE ≪ T2*), minimizes the loss of signal due to T2* decay and retains more T1 weighting in the lungs, without spatial resolution loss typical of FSE methods (24).
Figure 1. shows the expected signal differences for an SPGR sequence as a function of echo time using flip angle = 8°, TR = 4.2 ms, and assuming literature values of T1 and T2* in the lungs at 21% oxygen (T1 = 1237 ms, T2* = 1.8 ms) (18) and 100% oxygen (T1 = 1129 ms, T2* = 1.6 ms) (20). Using these scan parameters, a UTE scan with TE = 0.08 ms is ~3 times more sensitive to changes in T1 and ~6 times less sensitive to changes in T2* than a scan with a more conventional TE = 2.1 ms, all other parameters being kept constant. In general, at echo times greater than 1 ms, T2* dominates the signal change and produces negative contrast. However, at very short echo times the relative sensitivity to T2* drops off steeply while the sensitivity to T1 grows.
Figure 1.

The expected oxygen-enhanced signal change for an SPGR acquisition due to T1 alone (dashed), T2* alone (dotted), and both (solid), assuming literature-reported values for T1 and T2* in the lungs at 21% oxygen and 100% oxygen, flip angle = 8°, and TR = 4.2 ms. At ultrashort echo times, the T1 effects dominate.
Almost all prior OE MRI work has reported oxygen-enhancement as “percent signal enhancement” (PSE), defined as:
| Eq. [2] |
Where S100% is the signal of the 100% oxygen image, and S021% is the 21% oxygen reference image. However, PSE is governed not only by T1 and T2*, but also the underlying scan parameters of the MRI acquisition, and noise propagation due to the division operation. Therefore, to optimize the 3D radial UTE pulse sequence for OE, the flip angle was chosen to maximize the absolute signal difference, or contrast, between the 21% and 100% oxygen images.
Using Eq. 1 and 2, a digital simulation of 106 repetitions of a single lung voxel was created in Matlab (the Mathworks, Natick, MA). This voxel simulated a radial UTE MRI acquisition undergoing a change of oxygen concentration from 21% to 100%. TR = 4.2 ms and TE = 0.08 ms was assumed in order to match the subsequent human subject scans. Literature-reported values for T1 and T2* at 21% oxygen (T1 = 1237 ms, T2* = 1.8 ms) (18) and 100% oxygen (T1 = 1139 ms, T2* = 1.6 ms) (20) were assumed. Expected mean voxel intensity for each O2 concentration was calculated using Eq. 1 for flip angles ranging between 2 and 30 degrees, both with and without the addition of zero mean Gaussian noise across all repetitions.
As demonstrated in Figure 2, the absolute difference between the signals is maximized while the underlying image signal intensities are still quite near their peaks (Figure 2A). While the noise-free PSE (Eq. 2) progressively increases with flip angle, the presence of noise increasingly biases the PSE measurement as flip angle increases (Figure 2B). As can be seen in Figure 2C, both the PSE-to-noise and contrast-to-noise ratios are maximal at an optimal flip angle of 8.4 degrees for these scan parameters. Overall, a PSE of 6.3% is predicted at the achievable at the TE = 0.08 ms used in this study.
Figure 2.

(A) The predicted signal of an underlying proton voxel (solid and dashed) plotted as a function of flip angle based on Eq. 1. Zero-mean noise with standard deviation indicated by σ1 (dotted) is added. (B) The PSE as a function of flip angle assuming no noise in the proton images (solid) and adding zero mean noise σ1 to the proton voxel (dashed) based on Eq. 2. The dotted line represents the standard deviation σ2 of the noisy PSE result. (C) Normalized PSE / σ2 (solid) and the CNR of the proton voxel (dashed). Note that that PSE / σ2 and (S100% − S021%) / σ1 are both maximum at 8.4 degrees, indicating that the optimal flip angle that minimizes noise propagation in the PSE also provides the highest CNR in the difference image for the typical parameters in this work.
Human Subject Scans
Eight healthy human subjects were scanned in this Health Insurance Portability and Accountability Act compliant, Internal Review Board approved prospective study. All scanning was performed on an unmodified 1.5T clinical scanner with a 60 cm bore (Signa HDx, GE Healthcare, Waukesha, WI, USA) with a commercial 8-channel cardiac coil (HD Cardiac, GE Healthcare, Waukesha, WI, USA). Oxygen was delivered through a non-rebreather mask placed over the subject’s nose and mouth. Two 5–6 min free-breathing acquisitions were performed. The first was acquired while the subject breathed a medical air mixture with 21% oxygen (Airgas USA, West Chicago, IL) and the second while the subject breathed 100% oxygen. Imaging was paused for 2 min after the change in oxygen concentration in order to avoid transient effects. In one subject, time permitted a repeated acquisition while breathing the medical air mixture (21% oxygen).
Pulse Sequence
The 3D radial UTE pulse sequence was optimized to minimize TE as well as artifact from under-sampling and motion to improve SNR performance (25). An axial slab excitation encompassing the superior/inferior extent of the lungs was used to limit artifact from tissues outside of the field of view without increasing echo time beyond that imposed by hardware transmit-receive switch times. Oversampling in the read-out direction by a factor of two with retrospective filtering also served to decrease artifact from excited tissues in the shoulders and arms that typically lay outside the nominal field of view. Real-time gating to end-expiration through adaptive feedback from the respiratory bellows signal with a 50% acceptance window was implemented to minimize respiratory motion and obtain consistent lung inflation, which affects T1 independent of oxygen enhancement. 3D radial trajectories are typically robust to cardiac motion because of motion averaging from the acquisition of the center of k-space every TR (26), therefore no cardiac gating was used.
Finally, in order to optimize radial sampling density, variable read-out gradients were designed to spend more time acquiring data away from the center of k-space, thus resulting in a more uniform k-space sampling density and a theoretical 30–65% improvement in SNR compared with trapezoidal gradients that heavily average the center of k-space compared to the periphery of k-space (25).
An “outward-inward” projection read-out was used to acquire data at two echo times so that the ultrashort first echo (TE = 0.08 ms) could be compared with a more conventional second echo (TE = 2.1 ms). TE was calculated as time from the isocenter of the 300 μs minimum-phase Shinnar Le-Roux RF excitation pulse to the beginning of data acquisition (25). The readout time for each of the two acquired echoes was 1 ms. Other scan parameters included: flip angle = 8° to maximize CNR between the two images, FOV = 32 cm, 38000 projections, TE1 / TE2 / TR = 0.08 / 2.1 / 4.2 ms. Each 3D volume took ~5 min to acquire. For subjects 1, 2, and 7 the isotropic resolution was 1.25 mm. The k-space readout was shortened for the remaining subjects to correspond to a 2.5 mm isotropic native resolution so that more acquisition time, and therefore more data samples, could be acquired in the pass-band of the low-pass filter applied during post-processing.
Image Processing and Analysis
In addition to the higher resolution structural reconstructions (Figure 3A), the images were also reconstructed at 1 cm isotropic resolution with a Fermi filter to further improve SNR. The structural images were co-registered using fully deformable registration scripts under the advanced normalization tools (27) available as freeware (http://stnava.github.io/ANTs/) A deformation field was generated and applied to the low resolution data. 3D lung volumes were subsequently segmented using an automated region-growing threshold-based algorithm written in Matlab (Figure 3B). OE maps were then generated from the low resolution images for both ultrashort and conventional echo time datasets using Eq. 2 voxelwise over the entire 3D volume (Figure 3C). Overlaying the inherently registered OE images onto the high-resolution structural images was easily performed because both OE and structural images derived from the same acquired data (Figure 3D).
Figure 3.

(A) Isotropic spatial resolution (2.5 mm in this case) UTE datasets undergo automated thresholding and segmentation to generate (B) a mask of the lungs. To improve SNR, the acquired spatial resolution images obtained during 21% and 100% oxygen breathing are low pass filtered to 1 cm isotropic resolution before (C) an OE map is generated. Note the oxygen-enhanced effect visible in the blood of the aorta and left atrium (arrows). (D) The masked 1 cm isotropic OE subtraction image may be overlaid on the 2.5 mm isotropic structural image to visualize both the distribution of ventilation and structure from the same acquisition.
RESULTS
OE scan pairs were acquired in the 8 healthy subjects. Seven of these eight were successfully completed without complication. One OE pair was unsuccessful due to technical failure of the gas system to switch from 21% air to 100% oxygen. Figure 3C (arrows) also highlights the oxygen-enhancement of the blood pool in the left atrium and aorta. Similarly, Figure 4A shows a coronal orientation of the OE map derived from the first echo (TE = 0.08 ms) acquisition of the same subject. In addition to the enhanced lung parenchyma, the oxygenated blood in the left ventricle and ascending aorta (arrows) clearly demonstrate increased signal relative to the deoxygenated blood in the superior vena cava, right atrium, and pulmonary artery (arrowheads), consistent with normal physiology. Figure 4B depicts the same coronal slice of the OE image constructed from the second echo (TE = 2.1 ms). Note the lack of parenchymal enhancement due to the very short lung T2*, despite the persistent OE effect for oxygenated blood. As a negative control, an OE map obtained by comparing the first 21% O2 acquisition from a repeated second 21% O2 acquisition showed no signal enhancement of either blood pool or lung (Figure 4C).
Figure 4.
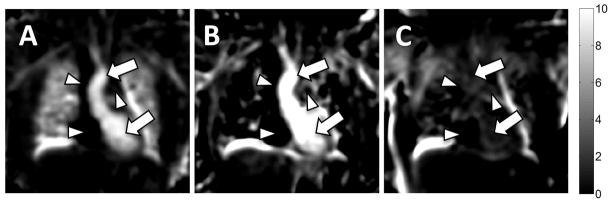
Coronal reformats of 3D OE maps generated from (A) TE = 0.08 ms and (B) TE = 2.1 ms acquisitions. Image quality and percent change in the lung parenchyma are poor at the longer echo time in this 3D radial acquisition due to the very short T2* environment. Enhancement of the oxygenated blood in the left ventricle and ascending aorta remains visible at both echo times (arrows). Note the lack of signal in the deoxygenated superior vena cava, right atrium, and pulmonary artery (arrowheads). (C) As a negative control, an OE map between two acquisitions obtained while breathing room air shows no oxygen enhancement in lung parenchyma or blood pool.
The 3D isotropic resolution provided by the technique is demonstrated in Figure 5. Three-dimensional OE maps show contrast between 21% O2 and 100% O2 inhalation with a true 1 cm isotropic resolution in three orthogonal axes for each of three subjects. Median PSE values are indicated by the companion colorbar. Over 7 subjects the whole lung PSE varied between 3.9% – 9.2% (6.6 ± 1.8%) as summarized in Table 1, similar to the 6.3% PSE expected from theory.
Figure 5.

Benefits of 1 cm isotropic spatial resolution are appreciated for reformatted axial, coronal, and sagittal images of the 3D OE maps generated for three of the subjects. Enhancement values were similar to predicted values for the pulse sequence parameters used as indicated by the colorbar and in Table 1.
Table 1.
Subject demographic information, as well as median PSE of masked OE volumes with upper and lower interquartile range (IQR) for all eight subjects. The bottommost row contains the group mean ± standard deviation. PSE values were near that predicted by theory.
| Subject | Age | Sex | Height (m) | Weight (kg) | Median PSE | IQR |
|---|---|---|---|---|---|---|
| 1 | 24 | M | 1.75 | 77 | Oxygen Delivery Failure | |
|
| ||||||
| 2 | 25 | F | 1.65 | 48 | 3.9 | [1.3, 6.3] |
|
| ||||||
| 3 | 25 | F | 1.78 | 68 | 8.0 | [5.3, 10.1] |
|
| ||||||
| 4 | 26 | M | 1.78 | 84 | 9.2 | [5.9, 11.7] |
|
| ||||||
| 5 | 22 | M | 1.80 | 77 | 6.7 | [4.0, 9.1] |
|
| ||||||
| 6 | 26 | M | 1.73 | 61 | 5.1 | [3.1, 7.2] |
|
| ||||||
| 7 | 43 | M | 1.88 | 83 | 7.2 | [4.8, 9.2] |
|
| ||||||
| 8 | 46 | M | 1.80 | 77 | 6.3 | [3.2, 9.3] |
|
| ||||||
| Mean ± Std | 29 ±9 | 1.77 ±0.06 | 72 ±12 | 6.6 ± 1.8 | ||
DISCUSSION
We have demonstrated the feasibility of using 3D radial UTE MRI to generate 3D isotropic OE maps in humans with full chest coverage and isotropic 1 cm spatial resolution. Image acquisition was performed using a pair of free breathing scans, each lasting approximately 5 minutes. By mitigating the signal loss due to the very short T2*, 3D radial UTE OE MRI is able to generate OE images in the lung parenchyma. Furthermore, because the center of k-space is acquired with each projection, there is inherent signal averaging that makes the approach insensitive to cardiac motion and avoids the need for cardiac gating. The 3D isotropic spatial resolution allows the use of multi-planar reformats in any arbitrary plane with the same resolution. This enables full-chest coverage with isotropic spatial resolution in a comparable total scan time to the established 2D multi-slice IR-SSFSE methods. While IR-SSFSE based approaches may offer nominally higher PSE values (28), the fundamental signal formation leads to differing sensitivities due to blood flow, noise performance, and changes in T2*. A direct comparison between IR-SSFSE and UTE approaches is beyond the scope of the present work and should be the subject for a future study. As described in Figure 2, such a study should not only compare PSE values but should also include careful analysis of signal difference and the consequences of noise propagation as well as other performance criteria such as sensitivity to motion, spatial coverage, and spatial resolution.
A significant advantage of the 3D radial UTE approach for OE MRI is that the high underlying spatial resolution (1.25 – 2.5 mm) of the un-subtracted structural images allow visualization of lung structure with detail approaching that of computed tomography (25), (Figure 3D). The potential advantage of structure-function associations between UTE and OE MRI in obstructive lung disease requires further study.
The PSE measured in healthy normal subjects was within the range predicted by theory, and the intersubject variation in OE effect (mean / standard deviation) was within the range reported by previous authors (13, 18, 19). The variation between subjects could be due to several factors, but one possibility is physiological noise in the small volunteer pool. Natural differences in T1 or variations in the true concentration of O2 delivered to the lungs could make PSE more variable than assumed in our predictions, which did not account for intrasubject variation. Future work will focus on shortening scan time to mitigate the potential for bulk motion that is likely exacerbated by relatively long exam times used here.
Qualitatively, the oxygenated blood in the left heart chambers and ascending aorta clearly demonstrate increased signal relative to the deoxygenated blood in the right heart chambers and main pulmonary artery, representing a physiological validation of the observed OE signal but also substantiated prior inferences that OE MRI in the lungs is weighted by both blood pool and ventilation. The signal increase in the oxygenated blood pool is likely due to the T1 shortening effect of dissolved molecular O2. While oxyhemoglobin is known to have higher T2* and higher T1 than deoxyhemoglobin (29, 30) with the potential for competing effects, the fact that hemoglobin is already 97% saturated even when breathing room air (21% O2) makes it unlikely to be a major effect. This sensitivity to the OE effect in the blood potentially adds a non-trivial perfusion-weighted component to the OE maps as oxygenated blood is absorbed into the pulmonary capillaries and veins. Indeed, the apparent sensitivity to dissolved blood oxygen concentration of this UTE approach warrants further investigation into its utility as a non-invasive cardiovascular contrast mechanism, for example, in the assessment of intra- or extra-cardiac shunt physiology in addition to a better general understanding of the physiology behind the OE signal in the lungs.
This feasibility study has several other limitations. The work focuses exclusively on healthy subjects as it is intended to assess feasibility; further study is needed in subjects with lung disease to assess potential performance in the clinical setting. Because oxygen-enhanced MRI using an IR-SSFSE approach has successfully shown ventilation defects in human subjects with lung disease (14), we expect that this radial UTE method will show similar results in human lung disease as suggested in Togao’s compelling results applying similar methodologies to pre-clinical studies in rat model of pulmonary embolism (19).
Although proton image alignment prior to registration was reasonable in this healthy normal volunteer pool, obvious misalignments in the images, especially near the diaphragm and anterior chest wall were apparent in all subjects prior to registration. This could be due to physiological changes in depth of breathing in response to changes in O2 concentration (31, 32) or due to subject inability to remain still and maintain a consistent depth of breathing throughout the acquisition. Additionally, the image registration algorithm necessarily imposes a gentle smoothing operation on the deformed image, and the impact of this on lung PSE has not yet been investigated.
CONCLUSIONS
To our knowledge this is the first application of 3D radial UTE MRI to perform oxygen-enhanced MRI of human lungs with full chest coverage and isotropic spatial resolution. The approach is more time efficient than 2D Cartesian IR-SSFSE methods, is comparatively insensitive to cardiac motion, and produces OE maps that are proportional to oxygen distribution and are intrinsically co-registered with high resolution structural images of the lung.
Acknowledgments
Sponsors/Grant Numbers: The project was supported by the University of Wisconsin Department of Radiology R&D Committee, The Hartwell Foundation, the UW School of Medicine and Public Health from the Wisconsin Partnership Program, the UW Graduate School, the Clinical and Translational Science Award (CTSA) program, grants 1UL1RR025011 and 9U54TR000021, as well as NIH/NHLBI U10 HL109168, and P01 HL070831.
The authors are grateful to Sara John and Janelle Fuller for study assistance, to Janice Yakey and Jennifer Swartz for clinical coordination, and to Amanda Corcos and Gary Frank for phantom development.
Abbreviations used
- CNR
contrast to noise ratio
- FA
flip angle
- FSE
fast spin echo
- IR-SSFSE
inversion recovery single shot fast spin echo (see also HASTE)
- OE
oxygen-enhanced
- IQR
interquartile range
- PET
positron emission tomography
- PSE
percent signal enhancement
- S
signal
- SNR
signal to noise ratio
- SPGR
Spoiled Gradient Echo (see also FLASH)
- SPECT
single photon emission computed tomography
- UTE
ultrashort echo-time
References
- 1.de Lange EE, Altes TA, Patrie JT, et al. Changes in regional airflow obstruction over time in the lungs of patients with asthma: evaluation with 3He MR imaging. Radiology. 2009;250:567–75. doi: 10.1148/radiol.2502080188. [DOI] [PubMed] [Google Scholar]
- 2.Fain SB, Panth SR, Evans MD, et al. Early emphysematous changes in asymptomatic smokers: detection with 3He MR imaging. Radiology. 2006;239:875–83. doi: 10.1148/radiol.2393050111. [DOI] [PubMed] [Google Scholar]
- 3.Möller HE, Chen XJ, Saam B, et al. MRI of the lungs using hyperpolarized noble gases. Magn Reson Med. 2002;47:1029–51. doi: 10.1002/mrm.10173. [DOI] [PubMed] [Google Scholar]
- 4.Howarth DM, Lan L, Thomas PA, Allen LW. 99mTc technegas ventilation and perfusion lung scintigraphy for the diagnosis of pulmonary embolus. J Nucl Med. 1999;40:579–84. [PubMed] [Google Scholar]
- 5.Jamadar DA, Kazerooni EA, Martinez FJ, Wahl RL. Semi-quantitative ventilation/perfusion scintigraphy and single-photon emission tomography for evaluation of lung volume reduction surgery candidates: description and prediction of clinical outcome. Eur J Nucl Med. 1999;26:734–42. doi: 10.1007/s002590050444. [DOI] [PubMed] [Google Scholar]
- 6.Melo V. Quantification of Regional Ventilation-Perfusion Ratios with PET. Journal of Nuclear Medicine. 2003;44:1982–91. [PubMed] [Google Scholar]
- 7.Altes TA, Powers PL, Knight-Scott J, et al. Hyperpolarized 3He MR lung ventilation imaging in asthmatics: preliminary findings. J Magn Reson Imaging. 2001;13:378–84. doi: 10.1002/jmri.1054. [DOI] [PubMed] [Google Scholar]
- 8.de Lange EE, Altes TA, Patrie JT, et al. Evaluation of asthma with hyperpolarized helium-3 MRI: correlation with clinical severity and spirometry. Chest. 2006;130:1055–62. doi: 10.1378/chest.130.4.1055. [DOI] [PubMed] [Google Scholar]
- 9.Niles DJ, Kruger SJ, Dardzinski BJ, et al. Exercise-induced bronchoconstriction: reproducibility of hyperpolarized 3He MR imaging. Radiology. 2013;266:618–25. doi: 10.1148/radiol.12111973. [DOI] [PMC free article] [PubMed] [Google Scholar]
- 10.Kruger SJ, Niles DJ, Dardzinski BJ. Exercise-Induced Bronchoconstriction: Hyperpolarized Helium-3 MRI During Challenge and Therapy. Journal of Magnetic Resonance in Medicine. 2013 doi: 10.1002/jmri.24272. n/a. [DOI] [PMC free article] [PubMed] [Google Scholar]
- 11.Parraga G, Ouriadov A, Evans A, et al. Hyperpolarized 3He ventilation defects and apparent diffusion coefficients in chronic obstructive pulmonary disease: preliminary results at 3. 0 Tesla. Invest Radiol. 2007;42:384–91. doi: 10.1097/01.rli.0000262571.81771.66. [DOI] [PubMed] [Google Scholar]
- 12.Salerno M, de Lange EE, Altes TA, Truwit JD, Brookeman JR, Mugler JP., 3rd Emphysema: hyperpolarized helium 3 diffusion MR imaging of the lungs compared with spirometric indexes--initial experience. Radiology. 2002;222:252–60. doi: 10.1148/radiol.2221001834. [DOI] [PubMed] [Google Scholar]
- 13.Dietrich O, Losert C, Attenberger U, et al. Fast oxygen-enhanced multislice imaging of the lung using parallel acquisition techniques. Magn Reson Med. 2005;53:1317–25. doi: 10.1002/mrm.20495. [DOI] [PubMed] [Google Scholar]
- 14.Ohno Y, Hatabu H. Basics concepts and clinical applications of oxygen-enhanced MR imaging. Eur J Radiol. 2007;64:320–8. doi: 10.1016/j.ejrad.2007.08.006. [DOI] [PubMed] [Google Scholar]
- 15.Edelman RR, Hatabu H, Tadamura E, Li W, Prasad PV. Noninvasive assessment of regional ventilation in the human lung using oxygen-enhanced magnetic resonance imaging. Nat Med. 1996;2:1236–9. doi: 10.1038/nm1196-1236. [DOI] [PubMed] [Google Scholar]
- 16.Hopkins SR, Levin DL, Emami K, et al. Advances in magnetic resonance imaging of lung physiology. J Appl Physiol (1985) 2007;102:1244–54. doi: 10.1152/japplphysiol.00738.2006. [DOI] [PubMed] [Google Scholar]
- 17.Tedjasaputra V, Sa RC, Arai TJ, et al. The heterogeneity of regional specific ventilation is unchanged following heavy exercise in athletes. J Appl Physiol (1985) 2013;115:126–35. doi: 10.1152/japplphysiol.00778.2012. [DOI] [PMC free article] [PubMed] [Google Scholar]
- 18.Jakob PM, Hillenbrand CM, Wang T, Schultz G, Hahn D, Haase A. Rapid quantitative lung (1)H T(1) mapping. J Magn Reson Imaging. 2001;14:795–9. doi: 10.1002/jmri.10024. [DOI] [PubMed] [Google Scholar]
- 19.Togao O, Ohno Y, Dimitrov I, Hsia CC, Takahashi M. Ventilation/perfusion imaging of the lung using ultra-short echo time (UTE) MRI in an animal model of pulmonary embolism. J Magn Reson Imaging. 2011;34:539–46. doi: 10.1002/jmri.22645. [DOI] [PMC free article] [PubMed] [Google Scholar]
- 20.Pracht ED, Arnold JF, Wang T, Jakob PM. Oxygen-enhanced proton imaging of the human lung using T2. Magn Reson Med. 2005;53:1193–6. doi: 10.1002/mrm.20448. [DOI] [PubMed] [Google Scholar]
- 21.Haacke EM. Magnetic Resonance Imaging Principles and Sequence Design. John Wiley & Sons; 1999. p. 455. [Google Scholar]
- 22.Bernstein MA. Handbook of MRI Pulse Sequences. Elsevier Academic Press; 2004. [Google Scholar]
- 23.Hatabu H, Alsop DC, Listerud J, Bonnet M, Gefter WB. T2* and proton density measurement of normal human lung parenchyma using submillisecond echo time gradient echo magnetic resonance imaging. Eur J Radiol. 1999;29:245–52. doi: 10.1016/s0720-048x(98)00169-7. [DOI] [PubMed] [Google Scholar]
- 24.Bernstein MA. Handbook of MRI Pulse Sequences. Elsevier Academic Press; 2004. pp. 791–2. [Google Scholar]
- 25.Johnson KM, Fain SB, Schiebler ML, Nagle S. Optimized 3D ultrashort echo time pulmonary MRI. Magn Reson Med. 2012 doi: 10.1002/mrm.24570. n/a. [DOI] [PMC free article] [PubMed] [Google Scholar]
- 26.Stehning C, Bornert P, Nehrke K, Eggers H, Dossel O. Fast isotropic volumetric coronary MR angiography using free-breathing 3D radial balanced FFE acquisition. Magn Reson Med. 2004;52:197–203. doi: 10.1002/mrm.20128. [DOI] [PubMed] [Google Scholar]
- 27.Avants BB, Tustison NJ, Song G, Cook PA, Klein A, Gee JC. A reproducible evaluation of ANTs similarity metric performance in brain image registration. Neuroimage. 2011;54:2033–44. doi: 10.1016/j.neuroimage.2010.09.025. [DOI] [PMC free article] [PubMed] [Google Scholar]
- 28.Ohno Y, Hatabu H, Takenaka D, Adachi S, Van Cauteren M, Sugimura K. Oxygen-enhanced MR ventilation imaging of the lung: preliminary clinical experience in 25 subjects. AJR Am J Roentgenol. 2001;177:185–94. doi: 10.2214/ajr.177.1.1770185. [DOI] [PubMed] [Google Scholar]
- 29.Li D, Wang Y, Waight DJ. Blood oxygen saturation assessment in vivo using T2* estimation. Magn Reson Med. 1998;39:685–90. doi: 10.1002/mrm.1910390503. [DOI] [PubMed] [Google Scholar]
- 30.Lu H, Clingman C, Golay X, van Zijl PC. Determining the longitudinal relaxation time (T1) of blood at 3. 0 Tesla. Magn Reson Med. 2004;52:679–82. doi: 10.1002/mrm.20178. [DOI] [PubMed] [Google Scholar]
- 31.Don HF, Wahba M, Cuadrado L, Kelkar K. The effects of anesthesia and 100 per cent oxygen on the functional residual capacity of the lungs. Anesthesiology. 1970;32:521–9. doi: 10.1097/00000542-197006000-00012. [DOI] [PubMed] [Google Scholar]
- 32.Aubier M, Murciano D, Milic-Emili J, et al. Effects of the administration of O2 on ventilation and blood gases in patients with chronic obstructive pulmonary disease during acute respiratory failure. Am Rev Respir Dis. 1980;122:747–54. doi: 10.1164/arrd.1980.122.5.747. [DOI] [PubMed] [Google Scholar]