Abstract
This paper presents a new 3D culture microtechnology for high throughput production of tumor spheroids and validates its utility for screening anti-cancer drugs. We use two immiscible polymeric aqueous solutions and microprint a submicroliter drop of the “patterning” phase containing cells into a bath of the “immersion” phase. Selecting proper formulations of biphasic systems using a panel of biocompatible polymers results in the formation of a round drop that confines cells to facilitate spontaneous formation of a spheroid without any external stimuli. Adapting this approach to robotic tools enables straightforward generation and maintenance of spheroids of well-defined size in standard microwell plates and biochemical analysis of spheroids in situ, which is not possible with existing techniques for spheroid culture. To enable high throughput screening, we establish a phase diagram to identify minimum cell densities within specific volumes of the patterning drop to result in a single spheroid. Spheroids show normal growth over long-term incubation and dose-dependent decrease in cellular viability when treated with drug compounds, but present significant resistance compared to monolayer cultures. The unprecedented ease of implementing this microtechnology and its robust performance will benefit high throughput studies of drug screening against cancer cells with physiologically-relevant 3D tumor models.
Keywords: Aqueous two-phase system, 3D culture, Tumor Spheroid, High throughput, Drug screening
1. Introduction
Three-dimensional (3D) cultures of cancer cells as spheroids provide an important tool for tissue engineering and drug testing due to their physiological relevance compared to widely-used monolayer cultures[1, 2, 3]. As compared with monolayer cultures, spheroids better predict efficacy of therapeutics, which can reduce use of animals in drug testing by identifying ineffective compounds in vitro[4]. Nonetheless, cancer cell spheroids are not commonly employed for drug screening because of limitations of current methods for generating, maintaining, treating, and analyzing drug responses in 3D formats. The traditional liquid overlay method for producing spheroids blocks cell adhesion to an underlying surface and retains cells suspended, resulting in random-sized spheroids[5]. Rotary vessel and spinner flask technologies continuously spin cells and maintain them in suspension to mass produce spheroids[6, 7]; however applied shear forces, non-uniform size and harvesting of resulting spheroids remain key limitations. Traditional and new techniques based on hanging drops utilize gravity to induce formation of spheroids of controlled size at the apex of drops[8, 9]. Hanging drop methods suffer from numerous challenges: addition of media and reagents, media evaporation, loss or merger of spheroids during handling, and transfer of spheroids into a standard microplate for downstream analyses. Platforms based on microfabrication allow culturing of uniform size spheroids, but the depth of micro-channels/wells/spheres (often 100−200 μm) limits the size of spheroids and impedes, downstream analyses[10]. As such, existing techniques are very difficult to implement for mass producing spheroids of uniform, pre-defined size that are easy to maintain, individually treat with biological reagents, and biochemically analyze.
We report a novel microtechnology that enables high throughput 3D culture and analysis of cancer cells as consistent-size cellular spheroids. Our approach is based on the use of a polymeric aqueous two-phase system (ATPS) to confine cells within a nanoliter-volume aqueous drop immersed within a second, immersion aqueous phase. Cells remain in close proximity and aggregate to spontaneously form a spheroid. The resulting spheroids mimic key features of solid tumors including hypoxia and restricted diffusion of nutrients and drugs, while preserving reproducibility of standard two-dimensional cultures. This microtechnology eliminates shortcomings of existing techniques by offering full compatibility with robotic tools and screening instruments to allow straightforward culture, maintenance, drug treatment, and biochemical analysis of cellular spheroids all within a standard microwell plate.
2. Results and Discussion
2.1. Aqueous two-phase system phase diagram
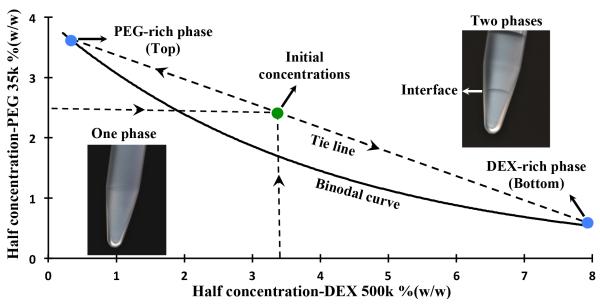
We selected a polymeric ATPS comprising of dextran (DEX, Mw: 500k) and polyethylene glycol (PEG, Mw: 35k) as the phase forming polymers due to their biocompatibility and the possibility of forming ATPS at low polymer concentrations[11, 12]. To determine the range of working concentrations, we generated an experimental phase diagram that prescribes required pairs of concentrations from the two polymers to result in an ATPS[13]. A binodal curve was formed representing critical initial phase concentrations of polymers above which a biphasic system forms, whereas any pair of concentrations below the binodal curve results in a single aqueous phase (Figure 1). We selected a biphasic system consisting of phase concentrations of 5%(w/w) PEG and 6.4%(w/w) DEX for spheroid assay due to its low polymer content and providing a mild and highly aqueous environment for cells. With the selected concentrations, the intersection of the binodal curve with the tie line shows the composition of final equilibrated phases (Figure 1). Due to a small density difference of 0.018 gr/cm3, the denser DEX-rich aqueous solution forms the bottom phase and the lighter PEG-rich aqueous solution makes up the top phase. We note that our previous studies have shown that PEG-DEX ATPS is fully compatible with cells and supports highly viable and functional cells[11, 14].
Figure 1.
Experimental phase diagram of an ATPS with PEG35k and DEX500k as phase-forming polymers. The diagram shows a binodal curve above which combinations of concentrations of two polymers give rise to a two-phase system (top inset image). Below the binodal curve, phase separation does not happen (bottom inset image). With an initial concentration of 6.4% DEX and 5% PEG (green point), a two-phase system with specific compositions of top and bottom phases forms (blue points). The intersection of the tie line and the binodal curve shows the concentration of top PEG-rich phase and bottom DEX-rich phase.
2.2. Spheroid generation with PEG-DEX aqueous two-phase system
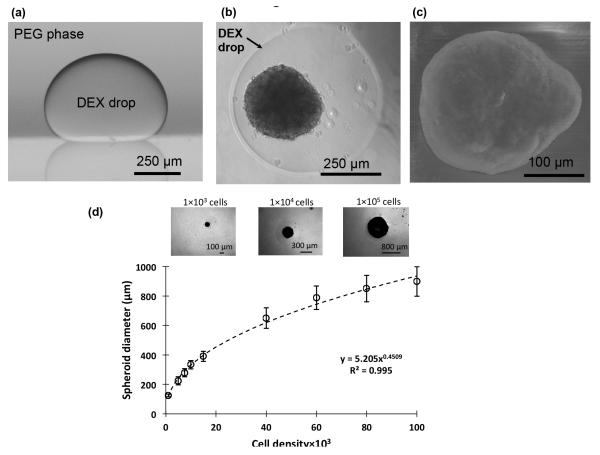
We used the PEG phase solution as the immersion medium and the aqueous DEX phase as the patterning phase. Dispensing a nanoliter-volume drop of the aqueous DEX phase into a reservoir containing the aqueous PEG phase resulted in a completely stable round drop that settled and remained immiscible from the immersion phase (Figure 2a). To generate a spheroid, first a well of a standard 96-well plate was loaded with 50 μl of the aqueous PEG phase. Then equal volumes of the aqueous DEX phase prepared twice concentrated, i.e. 12.8%, and the cell suspension of a desired density were mixed. The resulting solution containing cells had a 6.4% polymer concentration. Next, 300 nl of the resulting mixture was pipetted into the immersion PEG phase to form a cell-containing drop at the well bottom. During incubation, cells remained confined within the drop and spontaneously formed a spheroid within 24 hrs, without any external forces and stimuli (Figure 2b). The spheroid presents a normal morphology with a darker core, brighter periphery, and a clear boundary[3]. Over 7 days of incubation, spheroids form a compact cellular mass (Figure 2c). This approach accommodates spheroids with a wide range of cell densities, as few as 1×10³ cells and as many as 1×10⁵ cells per drop, to produce spheroids with approximate diameters of 125 μm and 900 μm, respectively. Importantly, our quantitative analysis resulted in an empirical relation that allows pre-defining the size of spheroids from a cell density within the range of 1×10³ – 1×10⁵ cells per drop (Figure 2d). We further confirmed the utility of this approach for spheroid formation by two different cancer cell lines, A431.H9 skin cancer cells and MDA-MB-157 breast cancer cells.
Figure 2.
(a) Side view of a DEX phase drop in the immersion PEG phase formed on a glass surface using equilibrated phases from an ATPS with initial concentrations of 6.4% DEX and 5% PEG. (b) A top-view of A431.H9 skin cancer cell spheroid formed with a cell density of 1×10⁴ cells at 24 hrs. (c) Scanning electron microscope (SEM) image of A431.H9 cells after one week of incubation. (d) Spheroids generated using a wide range of density of cells, i.e. 1×10³ 1×10⁵ cells/spheroid, to demonstrate the feasibility of forming different size tumor models.
2.3. Versatility of aqueous two-phase systems for spheroid culture
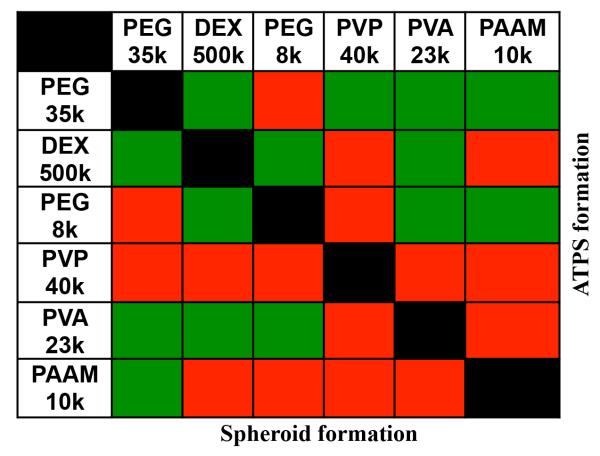
Next we demonstrated the versatility of ATPS-mediated spheroid culture by evaluating the feasibility of generating spheroids with different combinations of aqueous solutions of a panel of six polymers (Figure 3). The criteria for selecting these polymers were compatibility with cell culture and forming an ATPS, as reported previously[15]. Aqueous solutions of each polymer were prepared at concentrations of 5%, 10%, 15%, and 20%. Solutions of each two polymers were mixed to determine the capability of ATPS formation within this concentration range. This resulted in 16 combinations for each pair of polymers (Figure SI-1). This comprehensive analysis led to pairs of polymeric aqueous solutions that formed an ATPS, with at least one combination of concentrations (green cells in the upper right diagonal of Figure 3).
Figure 3.
Aqueous solutions of a library of different polymers were tested in pairs for the formation of an ATPS (upper right diagonal of the table) and spheroid (lower left diagonal of the table). Green color indicates successful formation whereas red color means the lack of formation.
Next these systems were tested for their ability to form a spheroid. From each pair of polymers, we selected only one ATPS containing the smallest concentrations of polymers to ensure each phase remains highly aqueous with minimal changes in the composition of culture medium (Figure SI-1). From the panel of polymers studied (Figure 3 and Figure SI-1), PEG35k-DEX500k pair required only a total of 10%(w/w) of polymers to form an ATPS and generate spheroids, i.e. 5%(w/w) from each polymer. The minimum concentration of polymers to give a two-phase system increased with other polymer pairs to 15-35%(w/w) of total polymer fraction in ATPS. Out of the eight polymer pairs whose aqueous solutions showed phase separation, six ATPS with a total polymer content of up to 25%(w/w) resulted in successful formation of spheroids (green cells in the lower left diagonal of Figure 3). These results suggest that high polymer concentrations can impede spheroid formation in ATPS and thus should be avoided. Based on this analysis, we consider the PEG35k-DEX500k pair the most suitable for ATPS-mediated production of cancer cell spheroids. This analysis demonstrated the broad utility of different ATPS for 3D culture beyond PEG-DEX ATPS primarily used in this study.
2.4. Characterization of consistency of spheroids size and single spheroid formation in DEX phase drops
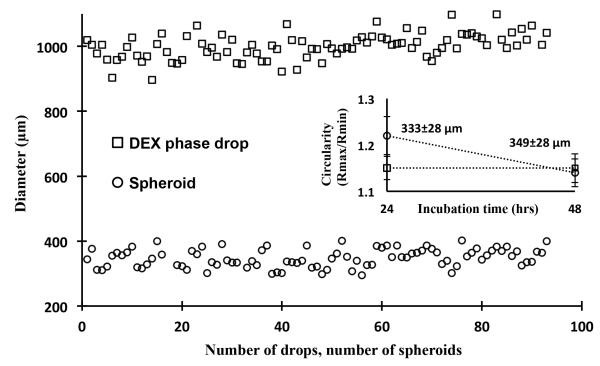
Evaluation of cellular response to therapeutic compounds in a 3D microenvironment requires integrating spheroid culture into robotic systems for high throughput compound screening[4]. Therefore we adapted the ATPS spheroid microtechnology to a standard 96-well plate format to accommodate screening of several compounds or multiple concentrations of a compound within a plate. Using a commercial robotic liquid handler equipped with an air displacement pipetting head compatible with 96-well plates, a sub-microliter volume of the aqueous DEX phase containing cells is simultaneously dispensed in all wells to form an individual cell-containing drop in each well. Incubation results in formation of a single spheroid. The size of spheroids within a plate is inherently sensitive to variations in the volume of dispensed DEX drops. Thus, we examined distribution of size of DEX drops and resulting spheroids by dispensing a 400 nl drop containing 1×10⁴ cells in each well. To ensure complete dispensing of the viscous DEX phase, 600 nl of pre-aspirated air volume was dispensed following the aqueous DEX phase. This protocol resulted in DEX drops of 993±101 μm and spheroids of 333±28 μm in diameter, respectively, within a plate at 24 hrs (Figure 4). Incubating spheroids for an additional day led to an increased circularity, defined as the ratio of largest and smallest diameters, indicating that spheroids become more compact (Figure 4, inset). In addition, the average diameter of spheroids showed a slight increase to 349±28 μm due to the growth of cells (Figure 4, inset). Following this protocol, we were able to consistently form spheroids in multiple 96-well plates with a standard deviation of ~8% (Figure SI-2).
Figure 4.
Distribution of diameter of DEX drops (squares) and spheroids (circles) within a 96-well plate at 48 hrs of incubation. Dispensing of the DEX phase was carried out at a small flow rate and 0.2 mm above the well surface followed by dispensing of an air volume of 600 nl. Spheroids formed from a cell density of 1×10⁴ cells within 400 nl-volume DEX drops. Average diameters of drops and spheroids are 993±101 μm and 349±28 μm, respectively. The inset graph represents the change in the average circularity of spheroids within the incubation period of 24 hrs to 48 hrs. Spheroids become more compact and their average diameter increase by 1.1% (p<0.05).
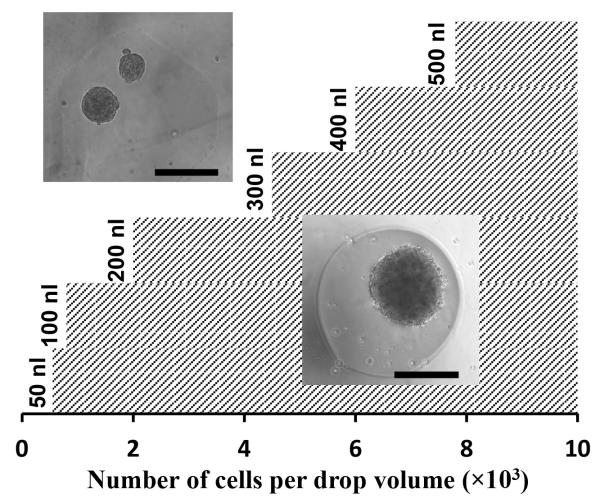
In addition to consistency of size of spheroids, generating a single spheroid in each well is crucial for compound screening applications. We found that with the ATPS approach, this is sensitive to the cell density within a drop. Therefore we established an experimental phase diagram to determine a minimum cell density for a given drop volume to give a single spheroid. Drops of the DEX phase with six different volumes in the range of 50-500 nl containing cell densities of 0.5×10³ – 10.0×10³ per DEX drop were dispensed into wells and formation of a single spheroid or multiple spheroids was evaluated at 24 hrs. Each condition was set with 8 replicates. For each drop volume, we found a minimum cell number to guarantee formation of a single spheroid. This resulted in the phase diagram of Figure 5. The hatched area to the right of each volume indicates cell densities that generate one spheroid within the drop whereas the area to the left of each volume gives multiple spheroids. Within the range of drop volumes and cell densities studied, data follow a linear correlation that can be used to pre-determine a drop volume needed to generate a single spheroid of desired cell density (Figure SI-3).
Figure 5.
An experimental phase diagram determines the correlation between the volume of a DEX drop and the minimum number of cells in the drop to result in formation of a single spheroid. The area of single spheroid formation for drop volumes of 50-500 nl is highlighted by the hatched pattern. A linear equation of V=(0.058)N+47.6 fits the data (V: drop volume, N: cell number).
2.5. Spheroid growth during long-term culture
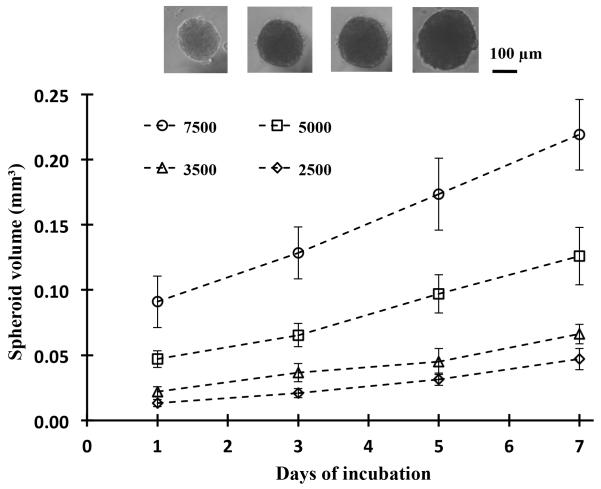
Next we examined the compatibility of the assay with long-term culture. Spheroids of four different cell densities of 2.5×10³, 3.5×10³, 5.0×10³ and 7.5×10³ were generated within 200 nl DEX drops immersed in the PEG phase. Each condition was set with 48 replicates, i.e. half of a 96-well plate. After allowing 24 hrs for formation of a single spheroid within each well, we added 50 μl of growth medium to wells to dilute out the concentration of polymers and produce a single medium phase. Therefore the ATPS was used as a patterning medium during the first 24 hrs of culture only and thereafter, spheroids were maintained in a homogenous growth medium phase. Spheroids were imaged every other day, and 50 μl of medium of each well was robotically replenished to provide fresh nutrients to cells. The volume of each spheroid was calculated from its measured diameter assuming a spherical shape. Figure 6 shows that the volume of spheroids of all four densities increases consistently over the one-week of culture, demonstrating that spheroids are viable, proliferative, and exhibit normal growth. As anticipated, larger density spheroids show greater growth indicated by the slope of growth curve (e.g. 0.025 mm3/day for spheroids of largest cell density and 0.006 mm3/day for the smallest density spheroids). The ease of generating and maintaining spheroids in standard 96-well plates and robotic exchange of media enables convenient long-term culture for at least seven days to allow studying growth dynamics of spheroids.
Figure 6.
Spheroids formed using four different cell densities, each with half of a 96-well plate, and incubated for 7 days. Inset images show the growth of spheroids from a cell density of 5×10³ over the 7-day culture. Data from spheroids of different densities at each day are statistically different (p<0.05). Except for day 1-3 of the 2.5×10³ density and day 3-5 of the 3.5×10³ density, spheroid volume data for each cell density over the 7-day culture are statistically different (p<0.05).
2.6. Cancer cell spheroids response to drug compounds
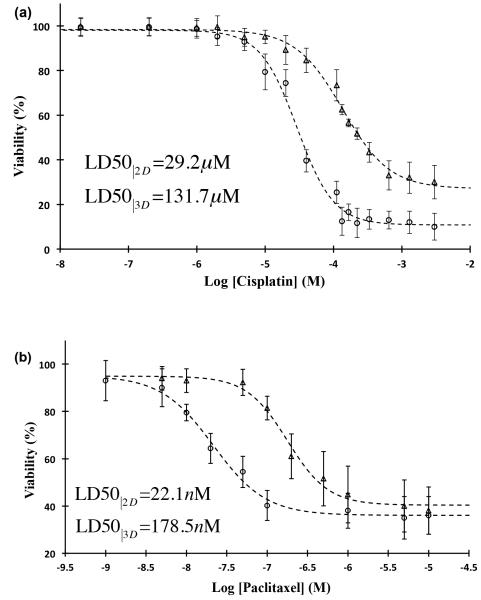
To demonstrate the feasibility of high throughput compound screening with this 3D culture technology, we selected two epithelial cancer drugs and evaluated their efficacy against spheroids of A431.H9 skin cancer cells. Cisplatin was used in a range of 20 nM–3 mM with 16 concentrations and paclitaxel was used in 1 nM-10 μM range with 10 different concentrations. Parallel experiments were set with monolayer culture of cells at similar concentrations to examine differential response of cells to drugs compared to 3D cultures. Both spheroid and monolayer cultures showed a dose-dependent response to the drugs. With cisplatin-treated monolayer culture (Figure 7a, circles), the drug showed efficacy in a window of 6–130 μM with LD50 value of 29.2 μM and a lowest viability of ~10% at the highest concentrations used. For spheroids treated with cisplatin (Figure 7a, triangles), the effective range significantly widened and increased to 20–600 μM, resulting in LD50 of 131.7 μM and a lowest viability of ~30% at the highest concentration. Paclitaxel was a more potent compound and reduced the viability of monolayer cultures within 1-100 nM, resulting in LD50 of 22.1 nM and a minimum viability of ~35% at concentrations greater than 100 nM (Figure 7b, circles). The use of spheroid cultures shifted the effective range of paclitaxel to 50 nM–1 μM, increased the LD50 value to 178.5 nM, and reduced cellular viability to ~40% at concentrations larger than 1 μM (Figure 7b, triangles). Greater resistance of cells to drugs is most likely caused by the 3D compact configuration of spheroids limits diffusion of drugs into the core of spheroids[1, 16]. In addition, close intercellular contact in spheroids can induce changes in gene expression to confer drug resistance in cells[17]. These tests highlight the need for testing efficacy of drugs with spheroid models because they closely mimic tumor physiology in vivo and elicit more realistic cellular responses.
Figure 7.
Drug screening with ATPS-generated spheroids compared to monolayer culture of cells. Percent viability of A431.H9 cells in 2D culture (circles) and 3D culture (triangles) treated with (a) cisplatin and (b) paclitaxel. After formation of spheroids at 24 hrs, cisplatin and paclitaxel were added at a concentration range of 20 nM - 3 mM and 1 nM - 10 μM, respectively. Each concentration included two columns of a 96-well plate (n=16). Control condition (no treatment) also had 16 replicates. Monolayer cultures were treated with similar drug concentrations and number of replicates. Cellular viability was evaluated at 48 hrs using PrestoBlue. For each drug concentration, cell viability was calculated as the ratio of average fluorescent intensities from drug-treated wells and control wells. Dashed lines are a sigmoid fit to the experimental data. Error bars represent 95% confidence limits.
To evaluate the robustness of this technology for drug screening with spheroids, we calculated the Z’ factor using the viability data from each drug corresponding to 50% viability as positive control and no drug treatment as negative control. The Z’ factor is a measure of robustness of high-throughput screening assays where values in the range of 0.5–1.0 indicate an excellent assay[18]. This test returned Z’ factor values of >0.6, with both cisplatin and paclitaxel demonstrating that the ATPS spheroid technology can robustly predict effects of drugs on 3D culture of cancer cells.
3. Conclusions
3D cultures of cancer cells as spheroids present a physiologically-relevant in vitro model that captures some key features of solid tumors and provides an essential tool for compound screening to identify potent anti-cancer drugs. Despite these recognized advantages, spheroids remain underutilized in high throughput screening applications due to limitations of existing techniques. We present a new approach for 3D culture of cancer cells using immiscible aqueous solutions of two biopolymers. A drop of the denser aqueous phase containing cancer cells settles in the immersion aqueous phase to facilitate aggregation of cells and formation of a compact spheroid without external forces. Immersion of spheroids in a bath of media throughout culture eliminates media evaporation and resulting alterations in drug concentrations inherent to hanging drop-based approaches[8, 19, 20]. Adapting this approach to robotic liquid handling allows formation of consistent size spheroids in standard 96-well plates, each well containing a single spheroid, to allow biochemical assays of cell responses in situ using plate readers, which is essential for efficient high throughput screening applications in drug discovery and development[6, 20, 21]. Robotic media exchange and addition of drugs and reagents and biochemical analysis of spheroids viability using standard plate readers is convenient and straightforward. Spheroids show normal growth over a one-week culture and present significant resistance to conventional anti-cancer drugs compared to monolayer cell cultures. This approach to 3D culture of cancer cells will benefit a broad range of applications in tissue engineering and drug library screening without a need for special plates, devices, and facilities.
4. Experimental Section
Phase diagram generation
Stock aqueous solutions of polyethylene glycol (PEG) and dextran (DEX), each 20%(w/w), were prepared in distilled water. Aqueous two-phase systems (ATPS) of different compositions were prepared using dilutions of the stock PEG and DEX solutions to yield systems in the range of 0.56%(w/w) PEG–19%(w/w) DEX to 16%(w/w) PEG–0.94%(w/w) DEX. Each ATPS was titrated drop-wise with distilled water until a one-phase system formed. The added weight of diluent was used to calculate the final composition of each ATPS and construct a binodal curve separating regions of two-phase formation from a single phase.
Aqueous two-phase system (ATPS) formation with different polymers
We evaluated the formation of an aqueous two-phase system (ATPS) using pairs of the following polymers at a wide range of concentrations: polyethylene glycol, Mw: 35,000 (PEG35k, Sigma-Aldrich), polyethylene glycol, Mw: 8,000 (PEG8k, Sigma-Aldrich), dextran Mw: 500,000 (DEX500k, Pharmacosmos), polyvinylpyrrolidone, Mw: 40,000 (PVP40k, Sigma-Aldrich), polyvinyl alcohol, Mw: 23,000 (PVA23k, Sigma-Aldrich), and polyacrylamide, Mw: 10,000 (PAAM10k, Sigma-Aldrich). All polymers were in powder form except for PAAM10k that was a 50 wt.% aqueous solution. Polymers were dissolved in ultrapure water at a solubility recommended by the manufacturer and subsequently diluted to smaller concentrations. To facilitate dissolving of polymers, solutions were vortexed and then kept in a 37°C water bath for 2 hrs. Stock polymer solutions were stored at 4°C until use.
Equal volumes of pairs of different concentrations from each two polymers were mixed in microcentrifuge tubes to a volume of 1 ml. Tubes were kept vertical in a rack at room temperature to allow polymer solutions equilibrate overnight. Formation of an ATPS was visually confirmed if a thin interface separating a lighter top phase and a denser bottom phase was observed.
Cell culture
A431.H9 skin cancer cells were kindly provided by Dr. Mitchel Ho (Center for Cancer Research, NIH, Bethesda, MD) and maintained in DMEM supplemented with 10% FBS, 1% glutamine, and 1% antibiotic. Every 10 passage, cells were treated with 700 μg/ml of G418 (Sigma-Aldrich). Cells were cultured at 37°C and 5% CO2 and harvested using 3 ml of trypsin (Life Technologies), which was neutralized with 6 ml of growth medium. The cell suspension was centrifuged at 1000 rpm for 5 min, cells were resuspended in 1 ml of medium and counted with a hemocytometer.
Spheroid culture
Aqueous solutions of 5%(w/w) PEG and 12.8%(w/w) DEX were prepared in growth medium. A pre-defined number of A431.H9 cells suspended in growth medium was mixed thoroughly with an equal volume of 12.8% DEX and loaded into one column of 384-well plate, labeled as the source plate. Each well of a non-adherent, round-bottom 96-well plate, labeled as the destination plate, was loaded with 50 μl of 5% PEG phase. Both plates were placed on the working surface of a robotic liquid handler (SRT Bravo, Agilent). The tip magazine of the liquid handler loaded 8 pipette tips (0.1–10 μl, Agilent) onto one column of the pipetting head, aspirated a defined volume of cell suspension in DEX phase (e.g. 300 nl) into each tip, and dispensed it into each well of the destination plate 0.1 mm away from the well surface. This was followed by dispensing 600 nl of air to completely empty the tips and form a drop at the bottom of the well. The destination plate was incubated at 37°C and 5% CO2. Spheroids were imaged every other day and 50 μl of medium was refreshed.
Spheroid formation with different ATPS
From aqueous solutions of each two polymers (PEG35k, PEG8k, DEX500k, PVP40k, PVA23k, and PAAM10k) that formed an ATPS, we selected one pair with the lowest concentration of polymers for spheroid formation. Polymer solutions were prepared with growth medium. 80 μl of the lighter aqueous phase (immersion phase) was loaded into wells of a non-adherent 96-well plate (Nunc). The denser aqueous phase was thoroughly mixed with A431.H9 cells at a density of 25,000 cells/μl and 0.2 μl of this suspension was dispensed into each well. After 48 hrs of incubation, wells were imaged with an inverted fluorescent microscope (AxioObserver A1, Zeiss) to evaluate spheroid formation.
Drug testing and cellular viability
Cisplatin (Spectrum Chemicals) and paclitaxel (Calbiochem) were dissolved in ultrapure sterile water at 2 mg/ml and dimethylsulfoxide (DMSO, ATCC) at 10 mg/ml, respectively. Working concentrations were prepared by serially diluting the stock solutions in growth medium. Spheroids and monolayer cultures were grown for 24 hrs and then treated with drugs for an additional 24 hrs. Drugs dilutions were prepared at twice the desired final concentration before adding to an equal volume of culture medium in each well. Viability of cells in 2D and 3D cultures was evaluated using a PrestoBlue reagent (Life Technologies), which was added to wells at 10% concentration of each well volume. Monolayer and spheroids cultures were incubated with PrestoBlue for 15 min and 6 hrs, respectively. Cell viability was determined using a standard microplate reader (SpectraMax M2, Molecular Devices) that measured the fluorescent intensity from each well. All data were normalized against cell viability from control spheroids (no treatment).
Supplementary Material
Acknowledgements
This project was supported by funding (R21CA182333) from the National Institutes of Health and The University of Akron.
Footnotes
Supporting Information is available from the Wiley Online Library or from the author.
References
- [1].Mehta G, Hsiao AY, Ingram M, Luker GD, Takayama S. J. Control. Release. 2012;164:192. doi: 10.1016/j.jconrel.2012.04.045. [DOI] [PMC free article] [PubMed] [Google Scholar]
- [2].Qi H, Du Y, Wang L, Kaji H, Bae H, Khademhosseini A. Adv. Mater. 2010;22:5276. doi: 10.1002/adma.201002873. [DOI] [PMC free article] [PubMed] [Google Scholar]; Tibbitt MW, Anseth KS. Biotechnol. Bioeng. 2009;103:655. doi: 10.1002/bit.22361. [DOI] [PMC free article] [PubMed] [Google Scholar]
- [3].Santini MT, Rainaldi G. Pathobiol. 1999;67:148. doi: 10.1159/000028065. [DOI] [PubMed] [Google Scholar]
- [4].LaBarbera DV, Reid BG, Yoo BH. Expert opin. Drug Discov. 2012;7:819. doi: 10.1517/17460441.2012.708334. [DOI] [PubMed] [Google Scholar]
- [5].Carlsson J, Yuhas JM. Rec. Results Cancer Res. 1984;95:1. doi: 10.1007/978-3-642-82340-4_1. [DOI] [PubMed] [Google Scholar]
- [6].Ingram M, Techy GB, Saroufeem R, Yazan O, Narayan KS, Goodwin TJ, Spaulding GF. In Vitro Cell. Dev. Biol. Anim. 1997;33:459. doi: 10.1007/s11626-997-0064-8. [DOI] [PubMed] [Google Scholar]
- [7].Song H, David O, Clejan S, Giordano CL, Pappas-Lebeau H, Xu L, O’Connor KC. Tissue. Eng. 2004;10:1266. doi: 10.1089/ten.2004.10.1266. [DOI] [PubMed] [Google Scholar]; Skardal A, Sarker SF, Crabbe A, Nickerson CA, Prestwich GD. Biomater. 2010;31:8426. doi: 10.1016/j.biomaterials.2010.07.047. [DOI] [PubMed] [Google Scholar]
- [8].Timmins NE, Nielsen LK. Methods Mol. Med. 2007;140:141. doi: 10.1007/978-1-59745-443-8_8. [DOI] [PubMed] [Google Scholar]
- [9].Hsiao AY, Tung YC, Qu X, Patel LR, Pienta KJ, Takayama S. Biotechnol. Bioeng. 2012;109:1293. doi: 10.1002/bit.24399. [DOI] [PMC free article] [PubMed] [Google Scholar]
- [10].Das T, Meunier L, Barbe L, Provencher D, Guenat O, Gervais T, Mes-Masson AM. Biomicrofluidics. 2013;7:11805. doi: 10.1063/1.4774309. [DOI] [PMC free article] [PubMed] [Google Scholar]; Wu LY, Di Carlo D, Lee LP. Biomed. Microdev. 2008;10:197. doi: 10.1007/s10544-007-9125-8. [DOI] [PubMed] [Google Scholar]; Fukuda J, Khademhosseini A, Yeo Y, Yang X, Yeh J, Eng G, Blumling J, Wang CF, Kohane DS, Langer R. Biomater. 2006;27:5259. doi: 10.1016/j.biomaterials.2006.05.044. [DOI] [PubMed] [Google Scholar]
- [11].Tavana H, Mosadegh B, Takayama S. Adv. Mater. 2010;22:2628. doi: 10.1002/adma.200904271. [DOI] [PMC free article] [PubMed] [Google Scholar]
- [12].Petrak D, Atefi E, Yin L, Chilian W, Tavana H. Biotechnol. Bioeng. 2014;11:404. doi: 10.1002/bit.25100. [DOI] [PubMed] [Google Scholar]; Tavana H, Jovic A, Mosadegh B, Lee QY, Liu X, Luker KE, Luker GD, Weiss SJ, Takayama S. Nat. Mater. 2009;8:736. doi: 10.1038/nmat2515. [DOI] [PMC free article] [PubMed] [Google Scholar]; Moraes C, Simon AB, Putnam AJ, Takayama S. Biomater. 2013;34:9623. doi: 10.1016/j.biomaterials.2013.08.046. [DOI] [PMC free article] [PubMed] [Google Scholar]
- [13].Tavana H, Kaylan K, Bersano-Begey T, Luker KE, Luker GD, Takayama S. Adv. Func. Mater. 2011;21:2920. doi: 10.1002/adfm.201002559. [DOI] [PMC free article] [PubMed] [Google Scholar]
- [14].Tavana H, Mosadegh B, Zamankhan P, Grotberg JB, Takayama S. Biotechnol. Bioeng. 2011;108:2509. doi: 10.1002/bit.23190. [DOI] [PMC free article] [PubMed] [Google Scholar]
- [15].Albertsson P-A. Partition of Cell Particles and Macromolecules. Wiley-Interscience; New York: 1986. [Google Scholar]
- [16].Hirschhaeuser F, Menne H, Dittfeld C, West J, Mueller-Klieser W, Kunz-Schughart LA. J. Biotechnol. 2010;148:3. doi: 10.1016/j.jbiotec.2010.01.012. [DOI] [PubMed] [Google Scholar]
- [17].Takagi A, Watanabe M, Ishii Y, Morita J, Hirokawa Y, Matsuzaki T, Shiraishi T. Anticancer Res. 2007;27:45. [PubMed] [Google Scholar]; Kim H, Phung Y, Ho M. PLoS One. 2012;7:e39556. doi: 10.1371/journal.pone.0039556. [DOI] [PMC free article] [PubMed] [Google Scholar]
- [18].Lemmo S, Nasrollahi S, Tavana H. Biotechnol. J. 2014;9:426. doi: 10.1002/biot.201300227. [DOI] [PubMed] [Google Scholar]
- [19].Tung YC, Hsiao AY, Allen SG, Torisawa YS, Ho M, Takayama S. Analyst. 2011;136:473. doi: 10.1039/c0an00609b. [DOI] [PMC free article] [PubMed] [Google Scholar]
- [20].Ho VH, Muller KH, Barcza A, Chen R, Slater NK. Biomater. 2010;31:3095. doi: 10.1016/j.biomaterials.2009.12.047. [DOI] [PubMed] [Google Scholar]
- [21].Hsiao AY, Tung YC, Kuo CH, Mosadegh B, Bedenis R, Pienta KJ, Takayama S. Biomed. Microdev. 2012;14:313. doi: 10.1007/s10544-011-9608-5. [DOI] [PMC free article] [PubMed] [Google Scholar]; Markovitz-Bishitz Y, Tauber Y, Afrimzon E, Zurgil N, Sobolev M, Shafran Y, Deutsch A, Howitz S, Deutsch M. Biomater. 2010;31:8436. doi: 10.1016/j.biomaterials.2010.07.050. [DOI] [PubMed] [Google Scholar]
Associated Data
This section collects any data citations, data availability statements, or supplementary materials included in this article.


