Abstract
Cervical cancers, a malignancy associated with oncogenic papillomaviruses, remain a major disease burden in the absence of effective implementation of preventive strategies. CD66+ cells have previously been identified as a tumor propagating subset in cervical cancers. We investigated the existence, differentiation state and neoplastic potential of CD66+ cells in a pre-cancer cell line harboring HPV31b episomes. The gene expression profile of CD66High cells overlaps with differentiated keratinocytes, neoplastic mesenchymal transition, cells of the squamo-columnar junction and cervical cancer cell line derived spheroids. There is elevated expression of DNMT1, Notch1 and the viral gene product E1^E4, in CD66High cells. Thus CD66High cells, in the absence of differentiating signals, express higher levels of key regulators of keratinocytes stemness, differentiation and the viral life cycle respectively. We also find a striking association of neoplastic traits including migration, invasion and colony formation in soft agar with CD66High cells. These properties and a distinct G2M enriched cell cycle profile are conserved in cells from cervical cancers. Principally, using a precancerous cell line, we propose that CD66High cells have an intermediate differentiation state with a cellular milieu connected with both viral replication and neoplastic potential and validate some key features in pre-cancer lesions. Such pathophysiologically relevant systems for defining cellular changes in the early phases of the disease process provide both mechanistic insight and potential therapeutic strategies. Collectively, our data provides a rationale for exploring novel therapeutic targets in CD66+ sub-sets during cancer progression.
INTRODUCTION
In tumours such as breast cancers, glioblastomas and colorectal cancers, tumorigenic sub-populations have been identified and are thought to underlie resistance to therapy and recurrence of tumour (1–6). Such sub-sets often upregulate the expression of pluripotency factors, Oct4, Nanog, Sox2 and cell survival pathways such as Notch Signaling (4,7–10). We have recently identified a subset of cells in cervical cancers with enhanced tumorigenic and metastatic functions (10). These cells are sustained by Notch signaling and are distinct in their expression of CD66. The transmembrane protein CD66, a member of the carcinoembryonic antigen family, has been implicated in invasive functions in different solid tumours, including ovarian cancer and estrogen deprived breast cancer cells (11–14). CD66+ cells in cervical cancers have higher expression of the pluripotency factors Oct4 and Nanog, as well as drug transporters (10). Other groups have reported CD49f, a marker of basal undifferentiated keratinocytes, Sox2, one of the induced pluripotency genes and CD44+ Cytokeratin 17+ subsets to be linked to tumourigenic traits and sub-sets in cervical cancer (15,16). The identification of these subsets has raised new and unresolved questions about the origin of functional heterogeneity. For instance, it is unclear if these cells represent a deregulation of a stem cell pool or the induction of a stem-like state in relatively differentiated cells (4). Recent evidence from different systems suggests that differentiated cells can become tumorigenic sub-sets by hijacking the self-renewal machinery (4,17,18). There is accumulating evidence that these stemness and survival pathways can be invoked in the context of stress response, such as hypoxic niches and the process of epithelial to mesenychmal transitions accompanying wound healing (4,19,20). It is therefore likely that some populations in a tumour can evolve distinct functional features even in the absence of genetic insults, possibly by epigenetic mechanisms.
Currently, an issue that remains unexplored is whether sub-sets of cells with unique tumorigenic functions are present and functionally important in the early stages of tumorigenesis (4,21). Cervical pre-cancers or cervical intra epithelial neoplasias (CINs), arise due to persistent infection with the high risk papillomaviruses including 16, 18, 45 and 31 (22–24). Here we use the CIN-612 culture system to analyze a putative tumorigenic population in early cervical lesions and ascertain mechanistic links using primary keratinocytes transfected with papillomavirus genomes. CIN-612 cells are derived from a natural infection with HPV31b (25). They represent an early phase of the disease process as they maintain low copies of the viral genome as epsiomes (25,26). The unique property of this cell line is its ability to support viral replication upon differentiation, thus these cells exist as an undifferentiated pool, with similarities to CIN1 lesions (25,26). This cell line is therefore amenable for the study of papillomavirus related changes to keratinocytes, such as regulation of genes required for the viral life cycle, in the critical, clinically relevant, window of early disease.
MATERIALS AND METHODS
Cell Culture and reagents
CIN-612-9E cells, primary keratinocytes (HFKs), HFKs transfected with HPV genomes and CaSki spheroids have been described before (10,25–29). CIN-612 cells and HFKs were cultured in E Medium supplemented with EGF (mouse EGF(BD) in Fig. 3, human recombinant EGF (Peprotech) in Fig. 1, 2, 4, 5 and 6) and differentiated as described before (26–29). CIN-612 cells were routinely (at the time of the experiments) characterized for episomal HPV31 maintenance and differentiation potential in rafts. Cultures were used within 25 passages of acquisition for CaSki and SiHa (bought from ATCC), early passages for HFKs and transfected HFKs. All cultures were routinely tested for mycoplasma and retention of described morphology and growth features. Further, CaSki ex-plants in mice generate tumours as per previous reports (10). CIN-612 cells were transduced as described earlier (30) with virions carrying shRNAs against DNMT1 (Origene for Supplementary Fig. 3G, and plasmids described in (30) Fig. 6J). The HPV16 E6 mutants have been described before (29).
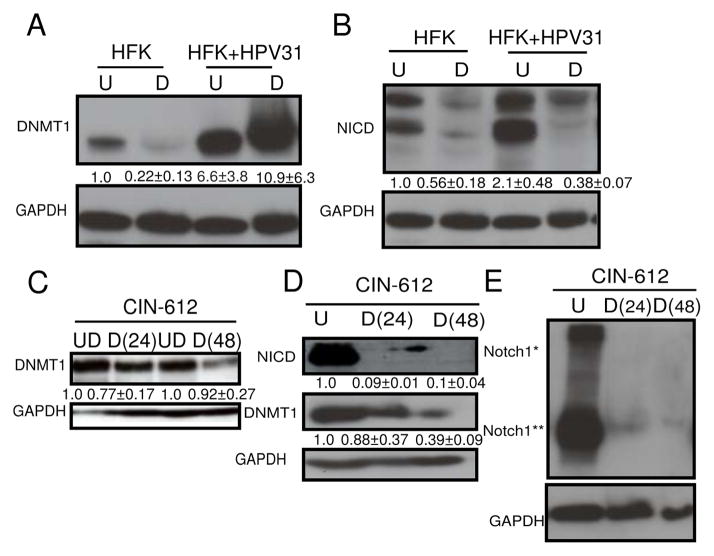
Figure 3. Human Papillomavirus 31 genomes enhance both Notch1 and DNMT1 levels.
A, Expression of DNMT1 in primary keratinocytes (HFK) compared to HFKs transfected with HPV31 genomes (HFK+ HPV31), in undifferentiated (U) and after differentiation (D) in methylcellulose. B, Expression of cleaved intracellular Notch1 (NICD) in HFKs compared with HFK+HPV31, in undifferentiated (U) and after differentiation (D) in methylcellulose. C, Expression of DNMT1 in undifferentiated CIN-612 cells (UD) and after differentiation in Ca2+ for 24 hrs [D(24)] or 48 hrs [D(48)]. D, Immunoblot of DNMT1 and NICD levels in CIN-612 cells in undifferentiated conditions (UD) and after differentiation in methylcellulose for 24 hrs [D(24)] or 48 hrs [D(48)]. E, Immunoblot of Notch1 levels in CIN-612 cells before (U) and after differentiation in methylcellulose for 24 hours [D(24)] and 48 hours [D(48)]. Notch1* represents full-length and Notch1** represents intracellular levels of Notch1. A–E, GAPDH was used as a loading control. N=3, mean with S.E.M. are shown below the blots.
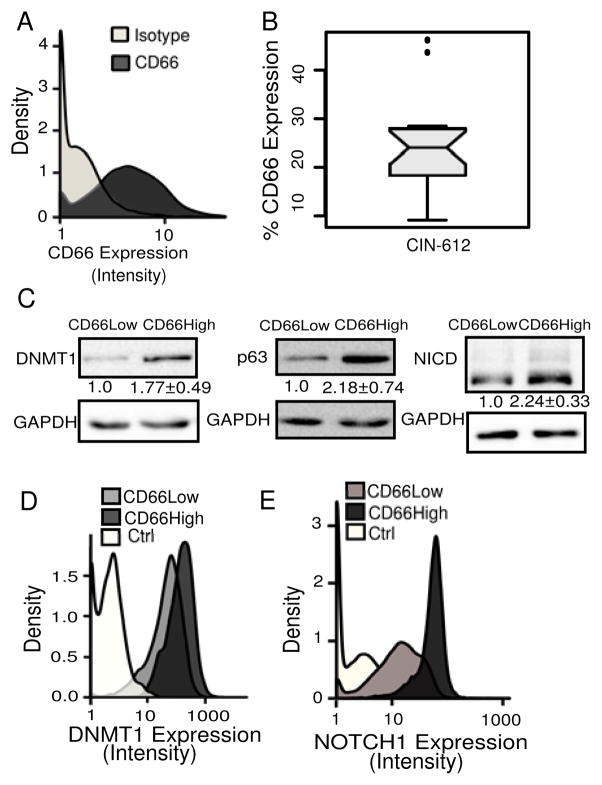
Figure 1. CD66High cells in CIN-612 express higher levels of Notch1, DNMT1 and p63.
A, Undifferentiated CIN-612 cells (10,000 cells) were analyzed for CD66 expression by flow cytometry. Density-plots show CD66 expression (dark gray) and negative/isotype control (light gray). B, Box-plot of percentage of CD66High cells. N=20, median=24.10. C, Sorted CD66Low and CD66High cells were examined for DNMT1, NICD and p63 proteins. GAPDH was used as a loading control. N=5, means with S.E.M are shown. D, Density-plots show DNMT1 expression in 8000, CD66High (dark gray), CD66Low (light gray) cells, and the secondary control (white) in undifferentiated CIN-612 cells by flow cytometry. E, Density-plots show Notch1 expression in 10,000, CD66High (dark gray), CD66Low (light gray) cells and secondary control (white), in undifferentiated CIN-612 cells by flow cytometry.
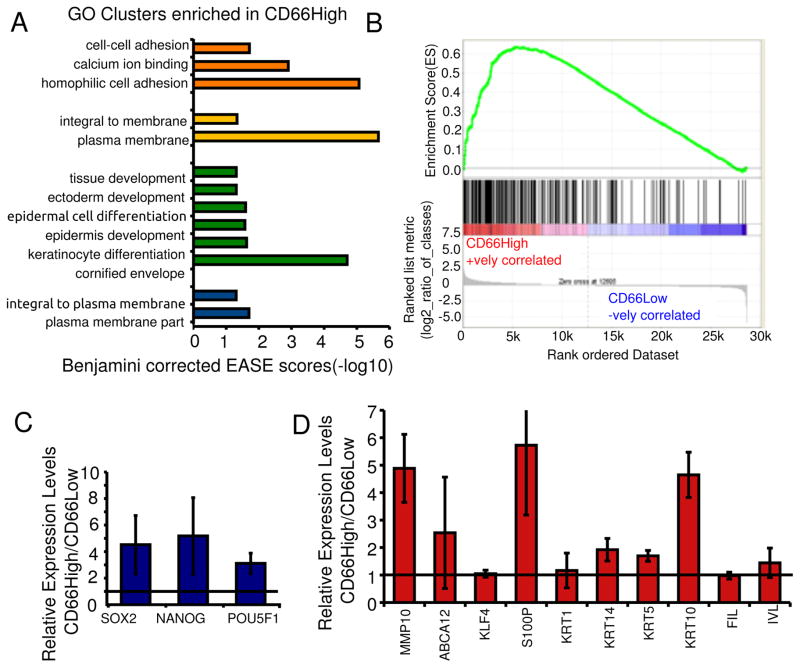
Figure 2. CD66High cells are differentiated along with progenitor/stemness profiles.
A, Genes upregulated in CD66High cells were subjected to gene ontology based classification using the DAVID gene term classification tool. The top 4 enriched clusters are shown with their Benjamini corrected EASE scores (−log10). B, GSEA analysis of gene expression profiles of CD66High and CD66Low cells compared to 216 genes up-regulated in keratinocytes upon differentiation in Ca2+ containing media (30). ES = 0.63605547, NES = 1.9540734, Nominal p-value <0.001, FDR q-value<0.001, FWER p-Value <0.001. C, Expression of pluripotency factors in sorted CD66High versus CD66Low cells from undifferentiated CIN-612 cells by real time PCR. D, Gene expression of indicated genes in sorted CD66High versus CD66Low cells from CaSki spheroids. For C and D, N= 3 sorts, error bars = S.E.M, Fold change of 1 is shown as a horizontal line.
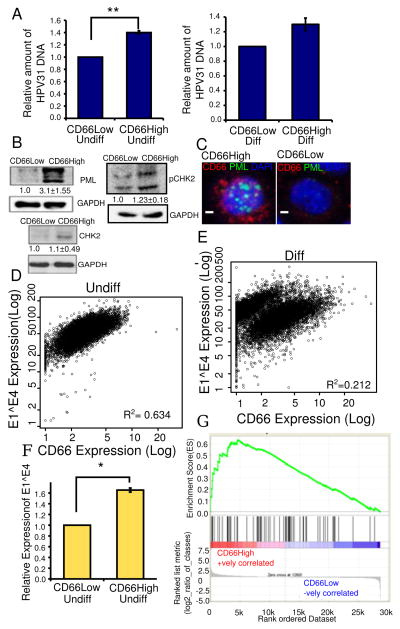
Figure 4. CD66High cells are linked to the differentiation dependent papillomavirus life cycle.
A, HPV31 DNA content in sorted CD66High versus CD66Low cells. Left: undifferentiated cultures of CIN-612, Right: differentiated in Ca2+, N=3, error bars= S.E.M., ** is p-value= 0.004, Welch’s t-test. B, Expression by western blot of PML, pCHK2 and CHK2 in sorted CD66High versus CD66Low cells from undifferentiated CIN-612 cells. GAPDH was used as a loading control. C, Expression of PML by immunofluorescence in undifferentiated CIN-612 cells, CD66c (red), PML (green), DAPI (nuclei, blue). Left: CD66High cell, right: CD66Low. Scale bar is 10μM. D,E Scatter plots showing E1^E4 and CD66 expression in 10,000 CIN-612 cells, in D, undifferentiated (Undiff) and in E, differentiated (Diff) in Ca2+. R2 =Pearson’s coefficient of correlation. F, Relative expression levels of E1^E4 in CD66Low and CD66High cells N=3, 8000 cells/experiment. Error bars are S.E.M. * is p-value=0.038, Welch’s t-test. G, GSEA analysis of gene expression profiles of CD66High and CD66Low cells compared to a 68 gene signature of cells of the squamo-columnar junction (42). ES = 0.6349658, NES = 1.7570925, Nominal p-value <0.0002, FDR q-value<0.0002, FWER p-Value <0.0002.
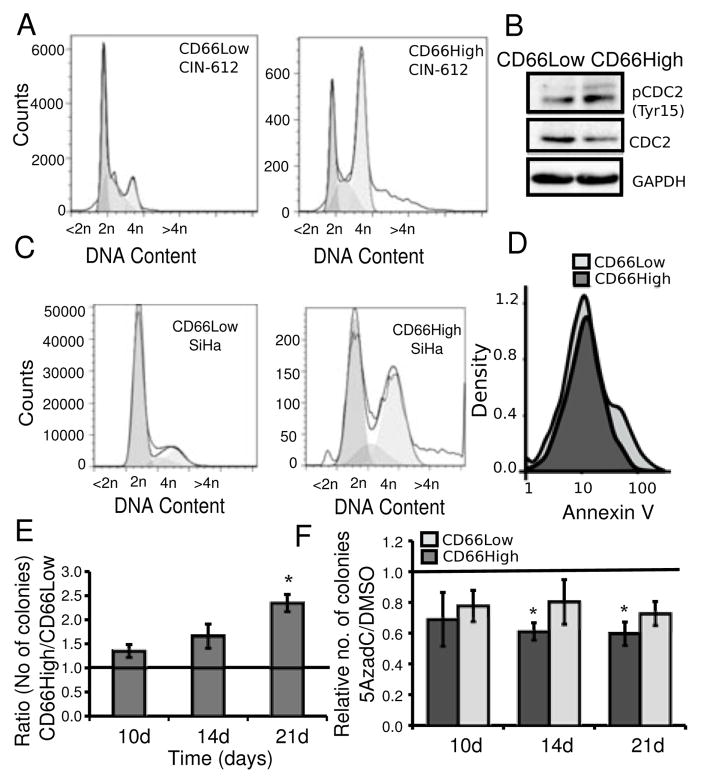
Figure 5. CD66High cells have pro-oncogenic features of survival and growth in vitro.
A, CD66High cells and CD66Low cells have distinct cell cycle profiles. Undifferentiated CIN-612 cells were stained for CD66 expression and the DNA binding dye DRAQ5. Representative plots of distribution of DNA (<2n, 2n, 4n, >4n) in CD66Low (left, 19427 cells) and CD66High (right, 19193 cells) cells. B, Expression of CDC2, pCDC2 (Tyr15) in sorted CD66Low and CD66High cells from undifferentiated CIN-612 cells. GAPDH was used as a loading control. C, SiHa cells were stained for CD66 expression and the DNA binding dye DRAQ5. Representative plots of distribution of DNA (<2n, 2n, 4n, >4n) in CD66Low (left, 1381660 cells) and CD66High (right, 17046 cells) cells. D, Binding of AnnexinV in 3000 CD66High (dark gray) and CD66Low (light gray) cells is shown in the density-plots. E, Sorted cells from undifferentiated CIN-612 cells were seeded for colony formation in soft agar. Ratio of colonies from CD66High and CD66Low cells after 10, 14 and 21 days (10d, 14d, 21d respectively), N=3 sorts, error bars = S.E.M., p-value =0.0163(*), Welch’s t-test. F, Undifferentiated CIN-612 cells were treated with 5AzadC or DMSO before sorting and seeded for colony formation in soft agar. Number of colonies from treated (5AzadC 5μM, 72 hrs)/untreated (DMSO) CD66High and CD66Low cells is plotted. Colonies were counted on day 10, 14 and 21. N= 3, error bars = S.E.M., p-values **= 0.02, *=0.032, Welch’s t-test.
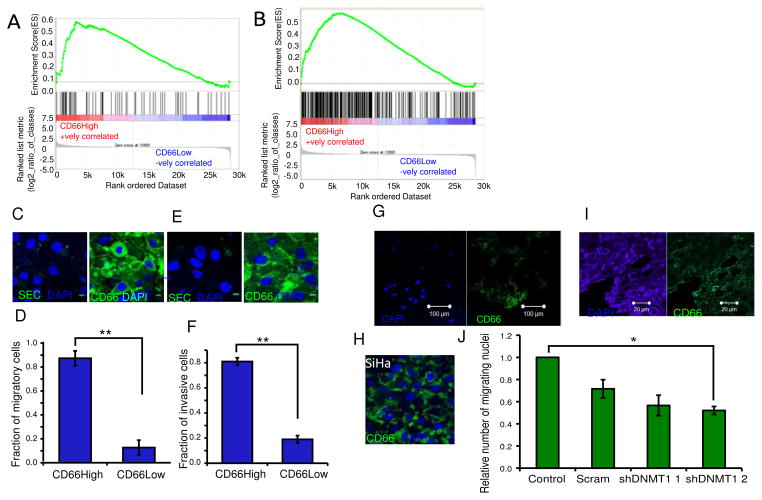
Figure 6. The neoplastic features of CD66High cells include an association with migration and invasion.
A, GSEA analysis of gene expression profiles of CD66High and CD66Low cells compared to the indicated gene set from the MsigDB (M2572). ES = 0.571464, NES = 1.5786825, Nominal p-value= 0.008526187, FDR q-value = 0.008526187, FWER p-Value= 0.007. B, GSEA analysis of gene expression profiles of CD66High and CD66Low cells compared to top 297 genes up-regulated in CaSki cells grown as Spheroids(10). ES = 0.55261254 NES= 1.741556 Nominal p-value <0.001, FDR q-value<0.001, FWER p-Value <0.001. C, CD66 staining in CIN-612 after migration, left: secondary control, right: CD66(green), DAPI (nuclei, blue). Scale bar is 10μm. D, Fraction of CD66High cells in the migratory cells from CIN-612. E, CD66 staining in CIN-612 after invasion, left: secondary control, right: CD66 (green) staining, DAPI (nuclei, blue). Scale bar is 10μm. F, Fraction of CD66High cells in the invasive cells from CIN-612. For D and F, N=3, 100 cells/experiment, error bars are S.E.M., p-value= 0.00012 and 0.0010 respectively, Welch’s t-test. G, Representative image of CD66 expression in the migratory cells from CaSki spheroids after 24 hours of migration. CD66 (right panel- green), DAPI (left panel, nuclear stain -blue). Scale bar is 100μm. H, Representative image of CD66 expression in the migratory cells from SiHa after 24 hours of migration. CD66 (green), DAPI (nuclear stain, blue). Scale bar is 10μm. I, Primary cancer section showing immunofluorescence of DAPI (left panel, nuclear stain, blue) and CD66 (right panel, green). Scale bar is 20μm. J, Effect of DNMT1 depletion on migration of CIN-612 cells. Number of migratory cells from 10 random fields were counted and fold change was calculated against untransduced control (control) and plotted for scrambled control (scram) and two shRNAs to DNMT1, shDNMT1 1 and shDNMT1 2. N=3, error bars are S.E.M. * is the p-value=0.0361, Welch’s t-test.
Cell Sorting
CIN-612 cells were sorted using the Pluriselect kit. Pluriselect Universal Mouse S beads (Pluriselect) were conjugated to the CD66 antibody (BD Pharmigen, 551354) according to the manufacturer’s instructions. Sorting of CD66 cells from SCCs and from CaSki spheroids was performed as described before (10).
Flow Cytometry and Immunofluorescence
Live cell staining was performed with PE conjugated anti-CD66 (BD 553457) or Isotype Control (BD 555574, BD 551480) at room temperature for 30 minutes, in HBSS buffer. Cells with intensity greater than mean +3 S.D. of the isotype (live staining)/secondary control (for fixed cells) were considered CD66High and the rest considered CD66Low. Annexin V staining was performed according to the manufacturer’s instructions (BD Pharmigen, 556420). For immunofluorescence of fixed cells- 0.5×10⁶ cells were fixed in 4% PFA, blocked with blocking solution (10% serum, 0.2%TritonX100, NaAzide in PBS), stained for 1 hour (primary), followed by 30 min (secondary) at room temperature with antibodies against Notch1 (Santa Cruz, sc-6074), DNMT1 (Abcam, ab19905), HPV31 E1^E4 (Laimins’s Lab), PML (Santa Cruz, sc-966), CD66 and Alexa Fluors 488 and 647 (Molecular Probes). Cells were analyzed by flow cytometry on BD FACSCalibur and imaged on Zeiss LSM510 Meta confocal microscope. Analysis was performed using FlowJo, R, Zeiss LSM viewer and ImageJ. Immunohistochemistry was performed after antigen retrieval (sodium citrate, pH 6.0), using the Novolink Polymer Detection System (Leica Biosystems) and imaged on Nikon ECLIPSE TE2000-S. Antibodies against CD66 and pan HPV E1^E4 (gift from Dr. Sally Roberts) were used.
Western Blots
Immunoblots were performed using antibodies against the following -DNMT1 (Abcam, ab19905), Notch1 (Santa Cruz, sc-6074), CHK2 (Santa Cruz, sc-5278), pCHK2, Thr68 (Cell Signaling Techonology, 2661), NICD (Cell Signaling Techonology, 2421), p63 (Santa Cruz, sc-8431), GAPDH (Santa Cruz, sc-47724), KRT14 (Abcam, ab7800), Cleaved Caspase3 (Cell Signaling Technology, 9661), PML (Santa Cruz, sc-966), CDC2 (Santa Cruz, sc-137034), pCDC2, Tyr15, (Cell Signaling Technology, 9111). Densitometry was performed using ImageJ. Cropped blots are shown.
Cell Cycle Analysis
0.4×10⁶ cells stained with the CD66 primary antibody on ice for 30 minutes following which they were fixed in ice cold methanol for 15 minutes. Cells were stained with Alexa Fluor 488 followed by DRAQ5 (Biostatus) and acquired on BD FACSCalibur.
Soft Agar Assay
5000 sorted CD66High and CD66Low cells were seeded for colony formation in soft agar as described before(10,31). Cells were treated with 5μM 5AzadC (Sigma)/DMSO for 72 hours before sorting. Number of colonies in 10 random fields were counted under the 10X objective (Olympus CK40).
Microarray Analysis
RNA was extracted from 0.5–0.6×10⁶ sorted cells using the RNeasy Kit (Qiagen). RNA quality was checked using the Bioanalyzer, labeled using the Agilent’s Quick-Amp labeling Kit and Hybridized to the Human 4×44K Array. Intra-array normalization was performed using the GeneSpringGX 11.5 Software (Genotypic Inc). The gene expression data has been deposited in the GEO database (accession number – GSE59322). Gene Ids (Up-regulated >1.5 fold in CD66High cells) were mapped to the Unigene database and gene term enrichment analysis was performed using DAVID web tools using only the Gene Ontology databases. Enrichment threshold of 2 and p-value cut off of 0.05 were used to make representative plot of the top clusters. Gene Set Enrichment Analysis was performed using the GSEA tool against available or custom datasets described in the text (33). GSEA enrichment plots are shown, details can be found in the documentation of the GSEA tool.
Gene Expression and HPV DNA content by Real Time PCR
RNA was isolated using Trizol (Invitrogen), treated to remove DNA (Fermentas DNaseI), cDNA synthesis was performed using MuMLV (Invitrogen). RPLP0 or GAPDH were used as a control for equal loading. DNA was isolated either by detergent lysis or using the DNeasy kit (Qiagen). RRP40 was used as a control for equal amount of genomic DNA. RT-PCRs were performed on the ABI7500 machine using the Kapa SYBR fast qPCR kit. Primer sequences are listed in the Supplementary Material.
Migration and Invasion Assays
Migration and invasion assays were performed as described before(10). 5% FBS for CIN-612, 10% FBS for SiHa cells and intact CaSki spheroids as chemoattractant. The outer side of the membrane was stained and the number of nuclei were counted.
RESULTS
Detection of a CD66High sub-set with higher protein levels of Notch1, DNMT1 and p63 in CIN-612 cells
We examined CIN-612 cells for the surface expression of the CD66 protein (Fig. 1A). Using an antibody against CD66, we defined a CD66High subset with a frequency of around 24% (Fig. 1B). In order to establish whether the CD66High cells were differentiated or progenitor-like (basal), we estimated the protein levels of DNMT1, p63, KRT14 and intracellular Notch1 in sorted CD66High and CD66Low cells (Fig. 1C, Supplementary Fig. 1A). While DNMT1 and p63 are known to maintain keratinocyte stemness, KRT14 is a marker of basal keratinocytes while Notch Signaling is a key regulator of keratinocyte differentiation (30,34–37). We find that CD66High cells have higher protein levels of DNMT1, p63, cleaved intracellular Notch1 (NICD) and comparable levels of KRT14 to CD66Low cells (Fig. 1C, Supplementary Fig. 1A). We confirmed these results by co-staining CIN-612 cells for CD66 and Notch1/DNMT1 (Fig. 1D,E Supplementary Fig. 1B–F). Collectively, CD66High cells are Notch1/NICDHigh, DNMT1High and p63High in CIN-612 (Fig. 1C–E, Supplementary Fig. 1B–F). The expression of p63, DNMT1 and KRT14 is normally restricted to the basal (undifferentiated) cells and Notch1 to the partially differentiated supra-basal cells in the epithelium (30,34–37). The co-expression of these proteins in the CD66High subset predicts a state consistent with both self-renewal and differentiation.
CD66High cells are differentiated along with progenitor/stemness profiles
In order to resolve the differentiation state that we found in the CD66High cells, we combined gene expression analysis with the transcript analysis of the reprogramming factors, Oct4, Nanog and Sox2 (38). Gene expression profiling was performed using microarrays on CIN-612 cells sorted on the basis of CD66 expression. A total of 924 transcripts were up-regulated (>1.5 fold), and 204 down-regulated (<1.5 fold) in the CD66High cells versus CD66Low cells. The genes up-regulated in the CD66High cells were clustered using the DAVID functional annotation clustering tool (32). Keratinocyte differentiation related genes were among the top enriched clusters (Fig. 2A, Supplementary Fig. 2A). This was supported by gene set enrichment analysis (GSEA) showing enrichment of genes expressed in keratinocytes upon differentiation in CD66High cells (30,33) (Fig. 2B). These data place the CD66High cells in a differentiated keratinocyte state. In contrast, gene expression analysis by real-time PCR revealed that CD66High subset also had increased levels Oct4, Nanog and Sox2 (Fig. 2C). This data demonstrates a component of stemness in the CD66High subset, which is supported by the higher levels of DNMT1 and p63 protein in these cells (Fig. 1C,D, Supplementary Fig. 1B–D). We also find this mixed pattern of the expression of stemness and differentiation related genes in sorted CD66High cells from spheroids of CaSki, a cervical cancer cell line (Fig. 2D, Supplementary Fig. 2B,C) and from primary cervical cancers (Supplementary Fig. 2C). We thus establish that the CD66High subset has features consistent with both stemness and keratinocyte differentiation.
Papillomavirus genomes enhance protein expression of both Notch1 and DNMT1
Papillomavirus genomes are known to regulate host proteins; for instance, p63 is a known target of the papillomavirus genome and is required for the viral late gene expression and viral amplification (27). Based on our results from Fig. 1 we asked if papillomavirus genomes regulate the levels of Notch1 and DNMT1, and whether their expression is sustained upon differentiation. Activated Notch1 has been shown to co-operate with the papillomavirus oncogenes in transformation assays (31,39). Recent evidence suggests that papillomavirus genomes alter methylation patterns in the host via DNMT1, while DNMT1 itself plays a role in carcinogenesis (40,41).
Keratinocytes transfected HPV31 genomes upregulate cleaved intracellular Notch1 and DNMT1 proteins (Fig. 3A,B). Upon differentiation of these cells in methylcellulose, although NICD levels decrease, DNMT1 levels are maintained (Fig. 3A,B). When these cells are differentiated in calcium, DNMT1 levels decrease but are still higher than the corresponding untransfected keratinocytes (Supplementary Fig. 3A). Differentiation of primary keratinocytes is accompanied by a reduction in DNMT1 and Notch1 protein levels.
A similar trend is seen in CIN-612 cells, where there is a decrease in the protein levels of both NICD and DNMT1 upon differentiation in methylcellulose (Fig. 3D,E). In calcium containing medium, although there is an overall decrease in DNMT1 protein levels, it is still maintained at a high level in a fraction of cells (Fig. 3C, Supplementary Fig. 3A, Supplementary Fig. 1D).
In line with previous reports we also find an increase in DNMT1 expression with HPV16 and 18 genomes (40) (Supplementary Fig. 3B,C). Since sustained expression of E6 and E7 is critical to papillomavirus mediated tumour progression (22), we examined if the viral oncogenes can also up-regulate DNMT1. We find that while E6 and E7 from HPV31, HPV18, and E7 from HPV16 are able to up-regulate DNMT1 (Supplementary Fig. 3D–F) an E6 mutant, I128T (29) is unable to do so. This mutant is defective in its interaction with the ubiquitin ligase E6 Associated Protein (E6AP). As a result, these cells have higher steady state levels of p53 (Supplementary Fig. 3F). This data argues for a role for HPV16 E6 in maintaining DNMT1 levels.
We tested if DNMT1 is required for the viral life cycle and found that cells expressing shRNA against DNMT1 are defective in differentiation dependent expression of viral gene E1^E4 (Supplementary Fig. 3G). Treatment of CIN-612 cells with the DNA methylation inhibitor 5AzadC also resulted in lower clonogenic ability and decrease in the amount of papillomavirus DNA (Supplementary Fig. 3H,I).
These data implicate the papillomavirus genomes in the up-regulation of DNMT1 and Notch1 proteins, sustaining DNMT1 levels even upon differentiation, and reveal a role for DNA methylation in the papillomavirus life cycle. It also prompts an examination of the CD66High cells, which are DNMT1High and Notch1High for links with the viral life cycle.
CD66High cells show a differentiation dependent link with the papillomavirus life cycle
The cells of origin in cervical cancer are thought to reside in the squamo-columnar junction (SCJ) region of the cervix (22,23,42). Persistent infection with the high-risk papillomaviruses is known to induce cervical cancers predominantly in this region (22,23,42). Papillomaviruses require keratinocyte differentiation for the completion of their life cycle (22–24). In particular, the expression of the late gene E1^E4 and amplification of the viral genome occur only upon differentiation (22,24,43). Viral replication centers, which are formed in a subset of cells upon differentiation, coincide with PML bodies or ND10 structures and recruit molecules such as CHK2 and H2AX (44–48). Based on the results in Fig. 1–3 we asked if CD66High cells in CIN-612 were in fact linked to the papillomavirus life cycle and to the cells in the SCJ.
To address the link to the viral life cycle we analyzed three features: the amount of HPV DNA, expression of viral replication associated proteins and the viral protein E1^E4. CD66High cells have higher amounts of HPV DNA both before and after differentiation (Fig. 4A). Sorted CD66High cells from undifferentiated CIN-612 cells have higher protein levels of PML and marginally higher levels of CHK2 and pCHK2 (Fig. 4B). Co-staining of undifferentiated CIN-612 cells shows PML positive nuclear structure in CD66High cells (Fig. 4C). We assessed E1^E4 levels by co-staining with CD66 followed by flow cytometry. We find that E1^E4High cells are CD66High and confirm this by imaging (Fig. 4D–F, Supplementary Fig. 4A,B). We find a positive correlation between the expression of E1^E4 and CD66 in undifferentiated cells (R2>0.5) which decreases upon differentiation (Fig. 4D,E). In organotypic rafts, the lower compartment with the undifferentiated cells, has cells that co-express CD66 and E1^E4 (Supplementary Fig. 4C,D). In the upper compartment with the differentiated cells, CD66High and E1^E4 High cells are often distinct (Supplementary Fig. 4C). Collectively, we find a CD66High E1^E4High subset in undifferentiated conditions with features of viral replication.
We then examined the relationship between the CD66High cells in CIN-612 and cells in the SCJ which are thought to be the targets of papillomavirus mediated transformation, using GSEA analysis. There is an enrichment of the SCJ gene signature (42) in CD66High cells (Fig. 4G). The similarity between junctional cells, which are thought to be the cells of origin of cervical cancer and CD66High cells is consistent with neoplastic potential.
CD66High cells have pro-oncogenic features of survival and growth in vitro
We proceeded to assess the neoplastic abilities of the CD66High cells from CIN-612. The cell cycle profile of CD66High cells, showed an enrichment of CD66High cells in the G2/M phase of the cell cycle, together with higher levels of pCDC2 (Fig. 5A,B Supplementary Fig. 5A. This property is conserved in CD66High cells from SiHa, a cervical cancer cell line (Fig. 5C). In CaSki spheroids, CD66High cells are slowly dividing cells (Supplementary Fig. 5D). The lower subG1 fraction in the CD66High cells prompted us to look at markers of apoptosis in CD66Low cells (Fig. 5A, Supplementary Fig. 5A). CD66Low cells had higher levels of AnnexinV staining (Fig. 5D, Supplementary Fig. 5B) and elevated cleaved Caspase3 protein levels (Supplementary Fig. 5C). CD66High cells also form more colonies in soft agar (Fig. 5E). CIN-612 cells treated with 5AzadC before sorting form significantly less colonies than DMSO treated sorted cells (Fig. 5F). Collectively these assays demonstrate that CD66High cells have features of enhanced survival and transformation, thus revealing marked neoplastic potential in the pre-cancer stage itself.
The neoplastic features of CD66High cells include an association with migration and invasion
We have noted that CD66+ cells are enriched in CaSki spheroids, and have enhanced migratory and invasive properties (10). A comparison of the gene expression in CD66High and CD66Low cells from CIN-612 with CaSki spheroids showed a striking correlation between the genes highly expressed in CaSki spheroids and in the CD66High cells from CIN-612 (Fig. 6A). This was underscored by GSEA analysis showing that gene expression of CD66High cells positively correlates with genes in the ‘mesenchymal transition signature’ common to all invasive cancer types (49) (Fig. 6B). We therefore reasoned that CD66High cells in CIN-612 may have functional features thought to be acquired only in late stages of carcinogenesis. Consistent with this idea we find that CIN-612 cells are capable of migration and invasion and that CD66High cells form the major fraction of both migratory and invasive cells (Fig. 6C–F). DNMT1 depleted CIN-612 cells show a mild defect in migration (Fig. 6J). The migratory cells from CaSki and SiHa, like CIN-612 are predominantly CD66High (Fig. 6G,H). Additionally, the edges of primary tumours and CINs are enriched for CD66High cells (Fig. 6I, Supplementary Fig. 6).
CINs have a distinct pattern of CD66 expression overlapping with regions that express E1^E4
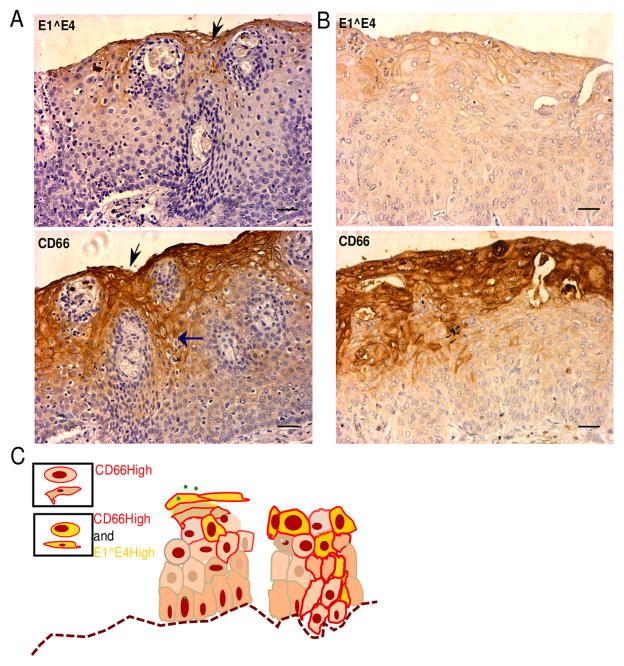
We have previously shown that CD66High cells are present in primary invasive cervical cancers and at their metastatic sites (10). Here, we asked if CD66 expression could be detected in the early stages of cervical cancers. Consistent with expected prevalence we noted about 30% HPV16 and 10% HPV31 positivity in the CIN lesions that we screened (Supplementary Fig. 6E). In a limited analysis of sections from CINs, we find CD66 expression mostly in the top third of the epithelium with differentiated cells, with a few CD66 expressing cells in the lower layers with undifferentiated cells. In order to test the hypothesis that CD66High cells are E1^E4 High, we stained serial sections with antibodies against CD66 and a pan HPV E1^E4 (Fig. 7A,B). Collectively, we find overlapping staining of CD66 and E1^E4, analogous to our results in Fig. 4. We also note that in the histologically normal cervical epithelium CD66 expression is restricted only to the top layers in cells with a definite flattened, stratified squamous morphology (Supplementary Fig. 6D). In CINs, CD66 expression is seen in the lower layers, which contain the undifferentiated cells, consistent with both ectopic expression and movement of these cells (Fig. 7A–C).
Figure 7. CD66 expression localizes to areas which also express E1^E4 and extends to the undifferentiated compartment in CINs.
A, B, Immunohistochemical analysis of CIN sections for the expression of CD66 and pan HPV E1^E4. Top panel: regions of E1^E4 expression (in brown) and bottom panel: regions of CD66 expression (in brown) from the same lesion (serial sections). Sections were counterstained with hematoxylin (blue, nuclear stain). Scale bar is 50μm. Vertical black arrows represent the corresponding regions from the two images- CD66High and E1^E4 High. Horizontal blue arrow shows CD66 staining in the lower layers. C, Schematic of CD66 and E1^E4 expression in the CINs, left: productive viral life cycle stage, right: precancerous stage.
DISCUSSION
Tumour heterogeneity has been analyzed in different cancers from two main perspectives, firstly the frequency and properties of subsets (1–5) and secondly, mechanisms by which these subsets are generated and sustained (4,6,8,17–21). Our focus in this study has been on defining the existence of CD66+ cells and their properties in the early phase of human cervical cancers. There are two striking observations in this study. A CD66High subset with neoplastic properties emerges in the early phase of cervical cancers (Fig. 5–7) and this subset is linked to the papillomavirus life cycle (Fig. 4, 7).
Our findings suggest a basis for these properties, namely, a unique state of differentiation. We find that CD66High cells have components of both keratinocyte differentiation and stemness as characterized by gene expression profiling, expression of reprogramming factors and the pattern of expression of Notch1, DNMT1 and viral protein E1^E4 in these cells (Fig. 1,2 and 4). It is likely that the stemness component is required for the development of neoplastic properties. The simultaneous overlapping differentiated state is likely to be permissive for differentiation dependent viral life cycle events, which are also required for transformation.
In line with this idea, we find that CD66High cells from the pre-cancer derived CIN-612 are capable of anchorage independent growth, make up the major migratory and invasive fraction in these cells and show a dependence on DNA methylation for these properties (Fig. 5,6). We find a striking G2/M fraction in the CD66High cells (Fig. 5). This can be explained in part by high levels of E1^E4 (43,50), however, the conservation of this signature in SiHa requires further analysis. Our data extends recent observations on the CD66High sub-set in advanced human cervical cancers where we have noted a relationship with tumour propagating potential and metastasis (10). Since our approach has involved using CD66 as a marker to sort and study subsets, a functional role for CD66 itself needs further evaluation.
In conclusion, our data provide novel insights into the generation of critical subsets at the intersection of the papillomavirus life cycle and cellular transformation. The mixed differentiation-stemness state in the CD66High cells suggests the possibility of a reprogramming event (Supplementary Fig. 7). Future work should be aimed at evaluating if differentiated CD66High cells, which have already undergone some viral replication, are reprogrammed to a stem-like state by the upregulation of molecules like DNMT1 and p63 by the HPV genomes.
Supplementary Material
Acknowledgments
We thank Dr. Sally Roberts for the E1^E4 antibody, Dr. Geeta Mukherjee for histology and C. Jamora, M. Rosbash, J. Dhawan, S. Dalal, A. Dutta and T. Rajkumar for critical comments and discussions. This work was supported by grants from DST, DBT, NCBS-TIFR to SK, an IUBMB Travel Award to P.C and grants from the National Cancer Institute, USA (CA142861 and CA59655) to LAL, SH and VKG.
Footnotes
CONFLICT OF INTEREST STATEMENT:
The authors declare that they have no conflict of interest
References
- 1.Al-Hajj M, Wicha MS, Benito-Hernandez A, Morrison SJ, Clarke MF. Prospective identification of tumorigenic breast cancer cells. Proc Natl Acad Sci U S A. 2003;100:3983–8. doi: 10.1073/pnas.0530291100. [DOI] [PMC free article] [PubMed] [Google Scholar]
- 2.Singh SK, Hawkins C, Clarke ID, Squire JA, Bayani J, Hide T, et al. Identification of human brain tumour initiating cells. Nature. 2004;432:396–401. doi: 10.1038/nature03128. [DOI] [PubMed] [Google Scholar]
- 3.Dalerba P, Dylla SJ, Park I-K, Liu R, Wang X, Cho RW, et al. Phenotypic characterization of human colorectal cancer stem cells. Proc Natl Acad Sci U S A. 2007;104:10158–63. doi: 10.1073/pnas.0703478104. [DOI] [PMC free article] [PubMed] [Google Scholar]
- 4.Visvader JE, Lindeman GJ. Cancer stem cells: current status and evolving complexities. Cell Stem Cell. 2012;10:717–28. doi: 10.1016/j.stem.2012.05.007. [DOI] [PubMed] [Google Scholar]
- 5.Ricci-Vitiani L, Lombardi DG, Pilozzi E, Biffoni M, Todaro M, Peschle C, et al. Identification and expansion of human colon-cancer-initiating cells. Nature. 2007;445:111–5. doi: 10.1038/nature05384. [DOI] [PubMed] [Google Scholar]
- 6.Sharma SV, Lee DY, Li B, Quinlan MP, Takahashi F, Maheswaran S, et al. A chromatin-mediated reversible drug-tolerant state in cancer cell subpopulations. Cell. 2010;141:69–80. doi: 10.1016/j.cell.2010.02.027. [DOI] [PMC free article] [PubMed] [Google Scholar]
- 7.Sikandar SS, Pate KT, Anderson S, Dizon D, Edwards RA, Waterman ML, et al. NOTCH signaling is required for formation and self-renewal of tumor-initiating cells and for repression of secretory cell differentiation in colon cancer. Cancer Res. 2010;70:1469–78. doi: 10.1158/0008-5472.CAN-09-2557. [DOI] [PMC free article] [PubMed] [Google Scholar]
- 8.Roesch A, Fukunaga-Kalabis M, Schmidt EC, Zabierowski SE, Brafford PA, Vultur A, et al. A temporarily distinct subpopulation of slow-cycling melanoma cells is required for continuous tumor growth. Cell. 2010;141:583–94. doi: 10.1016/j.cell.2010.04.020. [DOI] [PMC free article] [PubMed] [Google Scholar]
- 9.Perumalsamy LR, Nagala M, Sarin A. Notch-activated signaling cascade interacts with mitochondrial remodeling proteins to regulate cell survival. Proc Natl Acad Sci U S A. 2010;107:6882–7. doi: 10.1073/pnas.0910060107. [DOI] [PMC free article] [PubMed] [Google Scholar]
- 10.Bajaj J, Maliekal TT, Vivien E, Pattabiraman C, Srivastava S, Krishnamurthy H, et al. Notch signaling in CD66+ cells drives the progression of human cervical cancers. Cancer Res. 2011;71:4888–97. doi: 10.1158/0008-5472.CAN-11-0543. [DOI] [PubMed] [Google Scholar]
- 11.Blumenthal RD, Leon E, Hansen HJ, Goldenberg DM. Expression patterns of CEACAM5 and CEACAM6 in primary and metastatic cancers. BMC Cancer. 2007;7:2. doi: 10.1186/1471-2407-7-2. [DOI] [PMC free article] [PubMed] [Google Scholar]
- 12.Blumenthal RD, Hansen HJ, Goldenberg DM. Inhibition of adhesion, invasion, and metastasis by antibodies targeting CEACAM6 (NCA-90) and CEACAM5 (Carcinoembryonic Antigen) Cancer Res. 2005;65:8809–17. doi: 10.1158/0008-5472.CAN-05-0420. [DOI] [PubMed] [Google Scholar]
- 13.Lewis-Wambi JS, Cunliffe HE, Kim HR, Willis AL, Jordan VC. Overexpression of CEACAM6 promotes migration and invasion of oestrogen-deprived breast cancer cells. Eur J Cancer. 2008;44:1770–9. doi: 10.1016/j.ejca.2008.05.016. [DOI] [PMC free article] [PubMed] [Google Scholar]
- 14.Duxbury MS, Ito H, Benoit E, Zinner MJ, Ashley SW, Whang EE. Overexpression of CEACAM6 promotes insulin-like growth factor I-induced pancreatic adenocarcinoma cellular invasiveness. Oncogene. 2004;23:5834–42. doi: 10.1038/sj.onc.1207775. [DOI] [PubMed] [Google Scholar]
- 15.López J, Poitevin A, Mendoza-Martínez V, Pérez-Plasencia C, García-Carrancá A. Cancer-initiating cells derived from established cervical cell lines exhibit stem-cell markers and increased radioresistance. BMC Cancer. 2012;12:48. doi: 10.1186/1471-2407-12-48. [DOI] [PMC free article] [PubMed] [Google Scholar]
- 16.Feng D, Peng C, Li C, Zhou Y, Li M, Ling B, et al. Identification and characterization of cancer stem-like cells from primary carcinoma of the cervix uteri. Oncol Rep. 2009;22:1129–34. doi: 10.3892/or_00000545. [DOI] [PubMed] [Google Scholar]
- 17.Auffinger B, Tobias AL, Han Y, Lee G, Guo D, Dey M, et al. Conversion of differentiated cancer cells into cancer stem-like cells in a glioblastoma model after primary chemotherapy. Cell Death Differ. 2014 doi: 10.1038/cdd.2014.31. [DOI] [PMC free article] [PubMed] [Google Scholar]
- 18.Kim J, Villadsen R, Sørlie T, Fogh L, Grønlund SZ, Fridriksdottir AJ, et al. Tumor initiating but differentiated luminal-like breast cancer cells are highly invasive in the absence of basal-like activity. Proc Natl Acad Sci U S A. 2012;109:6124–9. doi: 10.1073/pnas.1203203109. [DOI] [PMC free article] [PubMed] [Google Scholar]
- 19.Sahlgren C, Gustafsson MV, Jin S, Poellinger L, Lendahl U. Notch signaling mediates hypoxia-induced tumor cell migration and invasion. Proc Natl Acad Sci U S A. 2008;105:6392–7. doi: 10.1073/pnas.0802047105. [DOI] [PMC free article] [PubMed] [Google Scholar]
- 20.Mani SA, Guo W, Liao M-J, Eaton EN, Ayyanan A, Zhou AY, et al. The epithelial-mesenchymal transition generates cells with properties of stem cells. Cell. 2008;133:704–15. doi: 10.1016/j.cell.2008.03.027. [DOI] [PMC free article] [PubMed] [Google Scholar]
- 21.Driessens G, Beck B, Caauwe A, Simons BD, Blanpain C. Defining the mode of tumour growth by clonal analysis. Nature. 2012;488:527–30. doi: 10.1038/nature11344. [DOI] [PMC free article] [PubMed] [Google Scholar]
- 22.Zur Hausen H, de Villiers EM. Human papillomaviruses. Annu Rev Microbiol. 1994;48:427–47. doi: 10.1146/annurev.mi.48.100194.002235. [DOI] [PubMed] [Google Scholar]
- 23.Doorbar J, Quint W, Banks L, Bravo IG, Stoler M, Broker TR, et al. The biology and life-cycle of human papillomaviruses. Vaccine. 2012;30 (Suppl 5):F55–70. doi: 10.1016/j.vaccine.2012.06.083. [DOI] [PubMed] [Google Scholar]
- 24.Moody CA, Laimins LA. Human papillomavirus oncoproteins: pathways to transformation. Nat Rev Cancer. 2010;10:550–60. doi: 10.1038/nrc2886. [DOI] [PubMed] [Google Scholar]
- 25.Bedell MA, Hudson JB, Golub TR, Turyk ME, Hosken M, Wilbanks GD, et al. Amplification of human papillomavirus genomes in vitro is dependent on epithelial differentiation. J Virol. 1991;65:2254–60. doi: 10.1128/jvi.65.5.2254-2260.1991. [DOI] [PMC free article] [PubMed] [Google Scholar]
- 26.Meyers C, Frattini MG, Hudson JB, Laimins LA. Biosynthesis of human papillomavirus from a continuous cell line upon epithelial differentiation. Science. 1992;257:971–3. doi: 10.1126/science.1323879. [DOI] [PubMed] [Google Scholar]
- 27.Mighty KK, Laimins LA. p63 is necessary for the activation of human papillomavirus late viral functions upon epithelial differentiation. J Virol. 2011;85:8863–9. doi: 10.1128/JVI.00750-11. [DOI] [PMC free article] [PubMed] [Google Scholar]
- 28.Moody CA, Laimins LA. Human papillomaviruses activate the ATM DNA damage pathway for viral genome amplification upon differentiation. PLoS Pathog. 2009;5:e1000605. doi: 10.1371/journal.ppat.1000605. [DOI] [PMC free article] [PubMed] [Google Scholar]
- 29.Hebner C, Beglin M, Laimins LA. Human papillomavirus E6 proteins mediate resistance to interferon-induced growth arrest through inhibition of p53 acetylation. J Virol. 2007;81:12740–7. doi: 10.1128/JVI.00987-07. [DOI] [PMC free article] [PubMed] [Google Scholar]
- 30.Sen GL, Reuter JA, Webster DE, Zhu L, Khavari PA. DNMT1 maintains progenitor function in self-renewing somatic tissue. Nature. 2010;463:563–7. doi: 10.1038/nature08683. [DOI] [PMC free article] [PubMed] [Google Scholar]
- 31.Rangarajan A, Syal R, Selvarajah S, Chakrabarti O, Sarin A, Krishna S. Activated Notch1 signaling cooperates with papillomavirus oncogenes in transformation and generates resistance to apoptosis on matrix withdrawal through PKB/Akt. Virology. 2001;286:23–30. doi: 10.1006/viro.2001.0867. [DOI] [PubMed] [Google Scholar]
- 32.Huang DW, Sherman BT, Lempicki RA. Systematic and integrative analysis of large gene lists using DAVID bioinformatics resources. Nat Protoc. 2009;4:44–57. doi: 10.1038/nprot.2008.211. [DOI] [PubMed] [Google Scholar]
- 33.Subramanian A, Tamayo P, Mootha VK, Mukherjee S, Ebert BL, Gillette MA, et al. Gene set enrichment analysis: a knowledge-based approach for interpreting genome-wide expression profiles. Proc Natl Acad Sci U S A. 2005;102:15545–50. doi: 10.1073/pnas.0506580102. [DOI] [PMC free article] [PubMed] [Google Scholar]
- 34.Truong AB, Kretz M, Ridky TW, Kimmel R, Khavari PA. p63 regulates proliferation and differentiation of developmentally mature keratinocytes. Genes Dev. 2006;20:3185–97. doi: 10.1101/gad.1463206. [DOI] [PMC free article] [PubMed] [Google Scholar]
- 35.Rangarajan A, Talora C, Okuyama R, Nicolas M, Mammucari C, Oh H, et al. Notch signaling is a direct determinant of keratinocyte growth arrest and entry into differentiation. EMBO J. 2001;20:3427–36. doi: 10.1093/emboj/20.13.3427. [DOI] [PMC free article] [PubMed] [Google Scholar]
- 36.Blanpain C, Lowry WE, Pasolli HA, Fuchs E. Canonical notch signaling functions as a commitment switch in the epidermal lineage. Genes Dev. 2006;20:3022–35. doi: 10.1101/gad.1477606. [DOI] [PMC free article] [PubMed] [Google Scholar]
- 37.Fuchs E. Finding one’s niche in the skin. Cell Stem Cell. 2009;4:499–502. doi: 10.1016/j.stem.2009.05.001. [DOI] [PMC free article] [PubMed] [Google Scholar]
- 38.Takahashi K, Tanabe K, Ohnuki M, Narita M, Ichisaka T, Tomoda K, et al. Induction of pluripotent stem cells from adult human fibroblasts by defined factors. Cell. 2007;131:861–72. doi: 10.1016/j.cell.2007.11.019. [DOI] [PubMed] [Google Scholar]
- 39.Lathion S, Schaper J, Beard P, Raj K. Notch1 Can Contribute to Viral-Induced Transformation of Primary Human Keratinocytes. Cancer Res. 2003;63:8687–94. [PubMed] [Google Scholar]
- 40.Leonard SM, Wei W, Collins SI, Pereira M, Diyaf A, Constandinou-Williams C, et al. Oncogenic human papillomavirus imposes an instructive pattern of DNA methylation changes which parallel the natural history of cervical HPV infection in young women. Carcinogenesis. 2012;33(7):1286–93. doi: 10.1093/carcin/bgs157. [DOI] [PubMed] [Google Scholar]
- 41.McCabe MT, Low JA, Daignault S, Imperiale MJ, Wojno KJ, Day ML. Inhibition of DNA methyltransferase activity prevents tumorigenesis in a mouse model of prostate cancer. Cancer Res. 2006;66:385–92. doi: 10.1158/0008-5472.CAN-05-2020. [DOI] [PubMed] [Google Scholar]
- 42.Herfs M, Yamamoto Y, Laury A, Wang X, Nucci MR, McLaughlin-Drubin ME, et al. A discrete population of squamocolumnar junction cells implicated in the pathogenesis of cervical cancer. Proc Natl Acad Sci U S A. 2012;109:10516–21. doi: 10.1073/pnas.1202684109. [DOI] [PMC free article] [PubMed] [Google Scholar]
- 43.Doorbar J. The E4 protein; structure, function and patterns of expression. Virology. 2013;445:80–98. doi: 10.1016/j.virol.2013.07.008. [DOI] [PubMed] [Google Scholar]
- 44.Nakahara T, Lambert PF. Induction of promyelocytic leukemia (PML) oncogenic domains (PODs) by papillomavirus. Virology. 2007;366:316–29. doi: 10.1016/j.virol.2007.04.032. [DOI] [PMC free article] [PubMed] [Google Scholar]
- 45.Wang H-K, Duffy AA, Broker TR, Chow LT. Robust production and passaging of infectious HPV in squamous epithelium of primary human keratinocytes. Genes Dev. 2009;23:181–94. doi: 10.1101/gad.1735109. [DOI] [PMC free article] [PubMed] [Google Scholar]
- 46.Gillespie KA, Mehta KP, Laimins LA, Moody CA. Human papillomaviruses recruit cellular DNA repair and homologous recombination factors to viral replication centers. J Virol. 2012;86:9520–6. doi: 10.1128/JVI.00247-12. [DOI] [PMC free article] [PubMed] [Google Scholar]
- 47.Moody CA, Laimins LA. Human papillomaviruses activate the ATM DNA damage pathway for viral genome amplification upon differentiation. PLoS Pathog. 2009;5:e1000605. doi: 10.1371/journal.ppat.1000605. [DOI] [PMC free article] [PubMed] [Google Scholar]
- 48.Swindle CS, Zou N, Van Tine BA, Shaw GM, Engler JA, Chow LT. Human papillomavirus DNA replication compartments in a transient DNA replication system. J Virol. 1999;73:1001–9. doi: 10.1128/jvi.73.2.1001-1009.1999. [DOI] [PMC free article] [PubMed] [Google Scholar]
- 49.Anastassiou D, Rumjantseva V, Cheng W, Huang J, Canoll PD, Yamashiro DJ, et al. Human cancer cells express Slug-based epithelial-mesenchymal transition gene expression signature obtained in vivo. BMC Cancer. 2011;11:529. doi: 10.1186/1471-2407-11-529. [DOI] [PMC free article] [PubMed] [Google Scholar]
- 50.Davy CE, Jackson DJ, Raj K, Peh WL, Southern SA, Das P, et al. Human papillomavirus type 16 E1 E4-induced G2 arrest is associated with cytoplasmic retention of active Cdk1/cyclin B1 complexes. J Virol. 2005;79:3998–4011. doi: 10.1128/JVI.79.7.3998-4011.2005. [DOI] [PMC free article] [PubMed] [Google Scholar]
Associated Data
This section collects any data citations, data availability statements, or supplementary materials included in this article.


