Summary
Several aspects common to a Western lifestyle, including obesity and decreased physical activity, are known risks for gastrointestinal cancers1. There is substantial evidence suggesting that diet profoundly affects the composition of the intestinal microbiota2. Moreover, there is now unequivocal evidence linking dysbiosis to cancer development3. Yet the mechanisms through which high-fat diet (HFD)-mediated changes in the microbial community impact the severity of tumorigenesis in the gut remain to be determined.
Here we demonstrate that HFD promotes tumor progression in the small intestine of genetically susceptible K-rasG12Dint mice independently of obesity. HFD consumption in conjunction with K-Ras mutation mediates a shift in the composition of gut microbiota, which is associated with a decrease in Paneth cell antimicrobial host defense that compromises dendritic cell (DC) recruitment and MHC-II presentation in the gut-associated lymphoid tissues (GALTs). DC recruitment in GALTs can be normalized, and tumor progression attenuated, when K-rasG12Dint mice are supplemented with butyrate. Importantly, Myd88-deficiency blocks tumor progression. Transfer of fecal samples from diseased donors into healthy adult K-rasG12Dint mice is sufficient to transmit disease in the absence of HFD. Furthermore, treatment with antibiotics completely blocks HFD-induced tumor progression suggesting a pivotal role for distinct microbial shifts in aggravating disease. Collectively, these data underscore the importance of the reciprocal interaction between host and environmental factors in selecting microbiota that favor carcinogenesis, and suggest tumorigenesis may be transmissible among genetically predisposed individuals.
Undoubtedly various factors contribute to the etiology of intestinal cancer, but there are compelling arguments to include high fat diet (HFD) and composition of gut microbiota as key risk factors4. Given the dramatic increase in the incidence of diet-induced obesity worldwide5 and the recent evidence for a more efficient nutrient-harvesting microbiota in obese individuals6,7, understanding the role of gut microbiota in the pathogenesis of cancer is crucial.
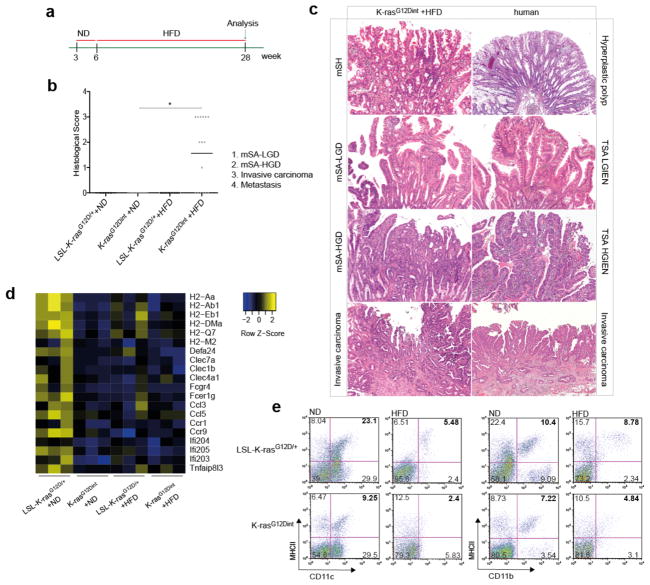
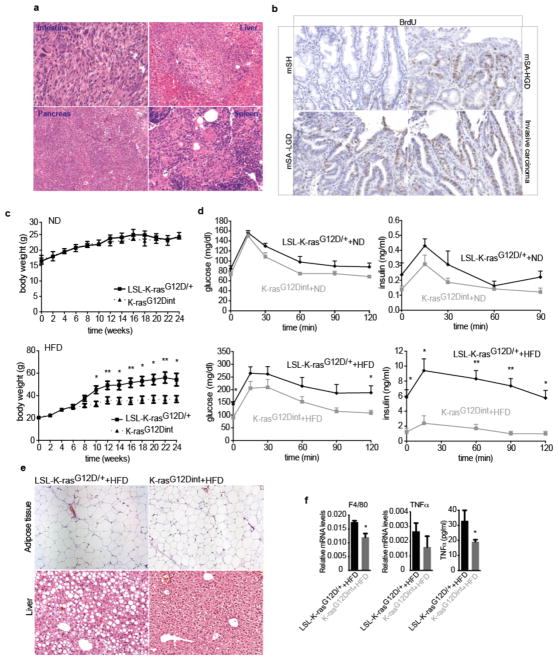
We set out to elucidate whether alterations in gut microbial community may represent a potential link between HFD and pathogenesis of intestinal cancer. To that end we used a well-characterized serrated hyperplasia model with oncogenic K-Ras expression in the intestinal epithelium, K-rasG12Dint mice8, and exposed them to an HFD regimen for 22 weeks (Fig. 1a). While 33% of age-matched mice on a normal diet (ND) developed only murine serrated hyperplasia (mSH) along the intestine, HFD consumption led to enhanced tumor progression in 60% of K-rasG12Dint mice (Fig. 1b). These mice developed tumors in the duodenum that ranged from murine serrated adenoma, with low-grade (mSA-LGD) and high-grade (mSA-HGD) dysplasia, to invasive carcinoma, closely recapitulating the carcinogenic sequence in humans (Fig. 1c). These cells metastasized to liver, pancreas and spleen when mice were kept over 40 weeks on HFD (Extended Data Fig. 1a). Serrated tumors revealed increased proliferation on the tips of the villi that was otherwise restricted to the crypt region (Extended Data Fig. 1b). Importantly, diet-induced obesity was compromised in K-rasG12Dint mice during disease progression (Extended Data Fig. 1c). In accordance with increased insulin sensitivity observed in these animals, lipid accumulation in liver was decreased (Extended Data Fig. 1d and e). Taken together these data suggest diet-mediated effects on the host were responsible for promoting serrated-tumor progression in the small intestine.
Figure 1. HFD accelerates cancer progression.
a, Experimental scheme shows when and how long special diet was applied before final analysis. b, Histological scores show tumor incidence in the small intestine under HFD regimen. Each point represents one animal and lines indicate mean (ND: LSL-K-rasG12D/+ controls n=5, K-rasG12Dint mice n=6; HFD: LSL-K-rasG12D/+ controls n=13, K-rasG12Dint mice n=16). The scores were assessed using two-sided Fisher test and adjustments on pairwise t-tests were made using the single-step method. *P = 0.05. c, Histology of small intestine from K-rasG12Dint mice during mSA development and comparison to human serrated route. TSA-LGIEN, typical serrated adenoma with low-grade intraepithelial neoplasm; TSA-HGIEN, typical serrated adenoma with high-grade intraepithelial neoplasm. d, Gene expression profiles of representative top candidate genes analyzed by microarray analysis in duodenum samples from littermate LSL-K-rasG12D/+ controls and K-rasG12Dint mutants after ND or HFD (n=3 per group). P-values were obtained from the moderated t-statistic and corrected for multiple testing with the Benjamini–Hochberg method. e, Representative flow cytometric analysis showing MHC class II expression in CD11c+ and CD11b+ cell populations from lamina propria (LP) in littermate mice.
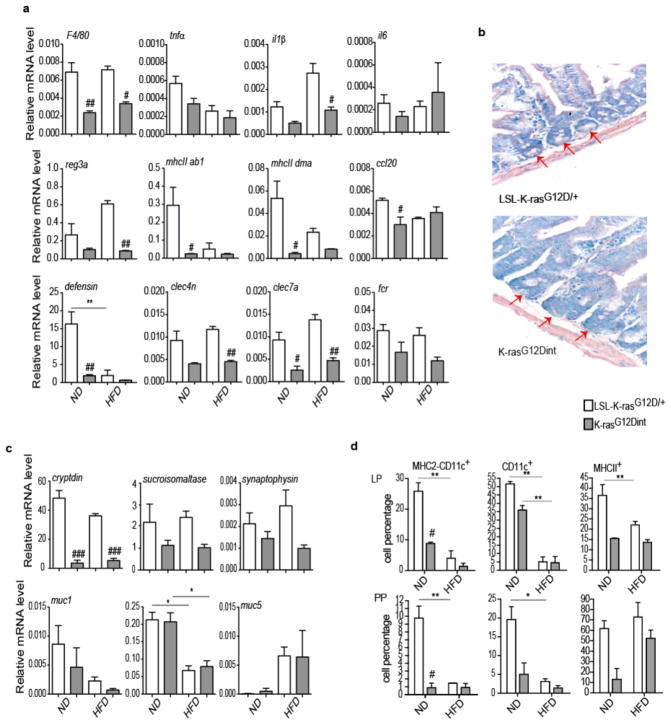
HFD induces a low-grade inflammatory state9 and inflammation is a hallmark of cancer10. Unexpectedly, TNF-α, as well as macrophage surface marker F4/80, were down-regulated in the duodenum of K-rasG12Dint mice (Extended Data Fig. 1f). Moreover, K-rasG12Dint animals exhibited a significant reduction in the expression of genes involved in recognition and immune response to antigens suggesting oncogene-driven down-modulation of host immunity (Fig. 1d and Extended Data Fig. 2a). This was indeed associated with decreased Paneth cell antimicrobial defense and altered differentiation markers in the small intestine (Extended Data Fig. 2b and 2c). Upon exposure to bacteria or their antigens, Paneth cells secrete defensins (cryptdins) with anti-bacterial function during immunity and shape the composition of the microbiota11. This activity was significantly decreased in K-rasG12Dint mice regardless of the tumor incidence. Intestinal epithelium is covered by a mucous layer, largely composed of mucins, providing a physical barrier to limit damage to the epithelium and to enhance gut homeostasis by delivering tolerogenic signals12. Indeed muc2 expression was significantly decreased after HFD (Extended Data Fig. 2c). In agreement with the gene expression data, MHC class II expression in CD11c+ and CD11b+ cell populations in the lamina propria (LP) (Fig. 1e) as well as in Peyer’s patches (PP) was significantly reduced in K-rasG12Dint mice (Extended Data Fig. 2d). Taken together these data suggest diminished cryptdin expression in Paneth cells due to oncogene activation in combination with altered mucin profiles caused by HFD could render K-rasG12Dint mice susceptible to dampened immunity.
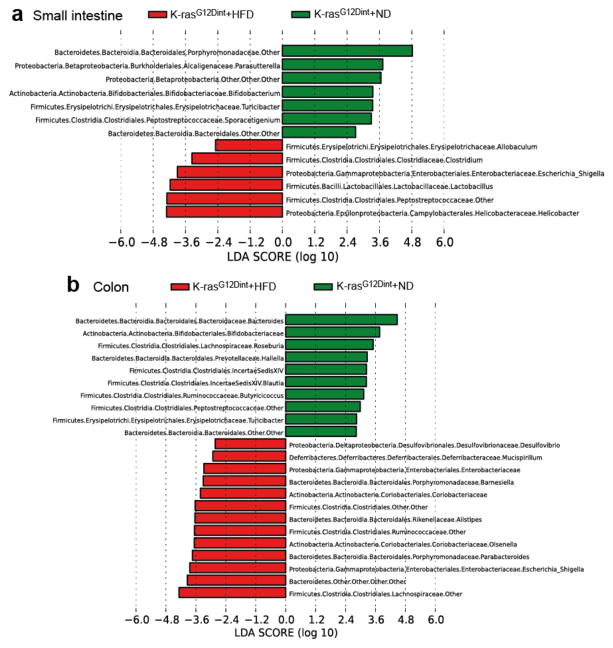
HFD may employ dramatic changes in secretory, absorptive, and immune function of the gut through regulating microbial communities13. To define whether HFD-induced alterations in microbiota were associated with increased tumor incidence, amplicons generated from small intestinal and colonic fecal DNA were subjected to 16S rRNA gene sequencing. HFD altered community diversity in the intestine in comparison to ND. Helicobacteraceae, Lactobacillaceae, Enterobacteriaceae, Clostridiaceae, Peptostreptococcaceae were significantly elevated, whereas Bifidobacteriaceae, Porphyromonadaceae, and Alcaligenaceae were significantly decreased in the small intestine of K-rasG12Dint mice following HFD (Fig. 2a). Moreover, although no tumors were detected in the colon, Enterobacteriaceae, Desulfovibrionaceae, Porhyromonadaceae, Rikenellaceae, Ruminococcaceae, Lachnospiraceae, Coriobacteriaceae, and Deferribacteraceae were significantly increased in colonic tissue of K-rasG12Dint mice, whereas Bifidobacteriaceae, Peptostreptococcaceae, Roseburia, and Butyricicoccus were decreased after HFD (Fig. 2b). Indeed HFD initiated a major structural change of the gut microbiota in tumor bearing K-rasG12Dint mice (Fig. 2 and Extended Data Fig. 3a-c).
Figure 2. Diet-induced tumor progression is associated with altered microbial community.
a, LEfSe results show bacteria that were statistically different among K-rasG12Dint mice on ND and HFD and indicated the effect size of each differentially abundant bacteria in the small intestine (ND: n=3; HFD: n=8) and b, colon (ND: n=3; HFD: n=7).
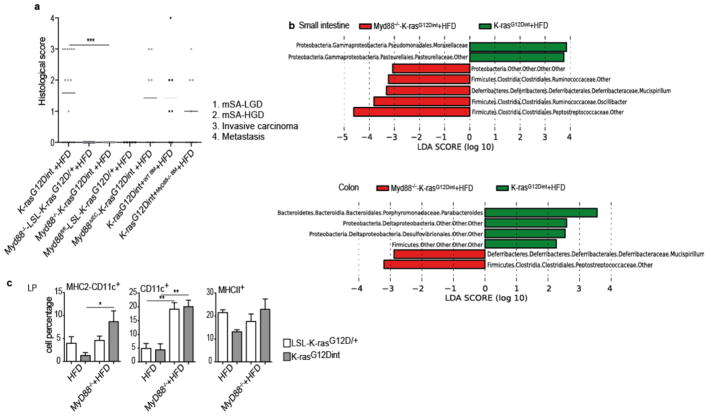
Bacteria are sensed through pattern recognition receptors (PRR), Toll-like receptors (TLRs), and the downstream adapter protein Myd8814. Interestingly, general ablation of Myd88 conferred complete protection against tumor progression, suggesting a causal role for intestinal microbiota in the tumorigenic process (Extended Data Fig. 4a). To distinguish which Myd88–deficient cell type conferred protection against tumorigenesis, K-rasG12Dint mice were either crossed to Myd88fl/fl animals or transplanted with wild type (WT) or Myd88-deficient bone marrow to restrict Myd88 deletion to intestinal epithelial cells (IEC) and hematopoietic cells, respectively. K-rasG12Dint mice continued to develop invasive cancer when Myd88-deletion was restricted to IEC (Extended Data Fig. 4a). Although adoptive transfer of Myd88–deficient bone marrow slightly reduced tumor incidence, it did not prevent tumor progression as the number of invasive cancers was comparable to mice that had received WT bone marrow cells (Extended Data Fig. 4a).
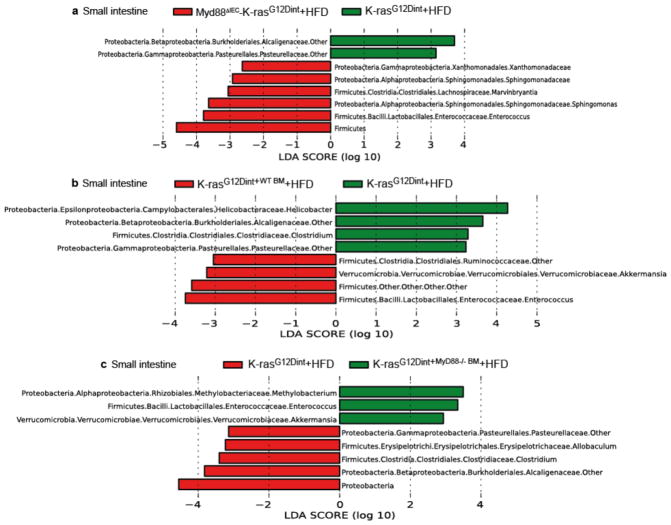
Defective innate immunity has been suggested to shape distinct intestinal microbiota in mice15–17. To test whether the discrepancy in tumor incidence between germ-line and tissue-specific Myd88-deficiency was due to a change in the gut microbiota, we surveyed microbial community diversity. Systemic deletion of Myd88 led to an increase in Peptostreptococcaceae, Deferribacteraceae, and butyrate-producing Ruminococcaceae (Extended Data Fig. 4b). Furthermore, Enterococcaceae, which were consistently increased in tissue-specific Myd88 deletion, were no more detectable when Myd88 was deleted in the germ-line (Extended Data Fig. 5a-c). Remarkably, oncogene and diet-uncoupled antigen presentation in DCs of the LP was significantly attenuated following Myd88 deletion (Extended Data Fig. 4c). The possible explanation for differential susceptibility to cancer could be that deletion of Myd88 in IEC and hematopoietic cells have an additive protective effect. Alternatively, Myd88 deficiency may have prevented tumor progression through mechanisms not only related to community changes or mucosal immunity, but rather through altering IEC differentiation during embryogenesis.
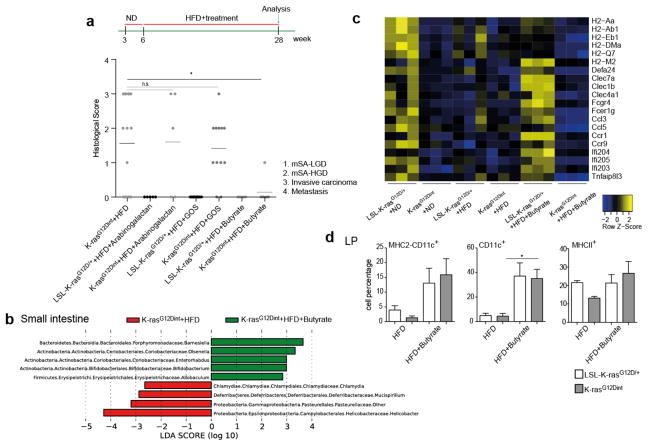
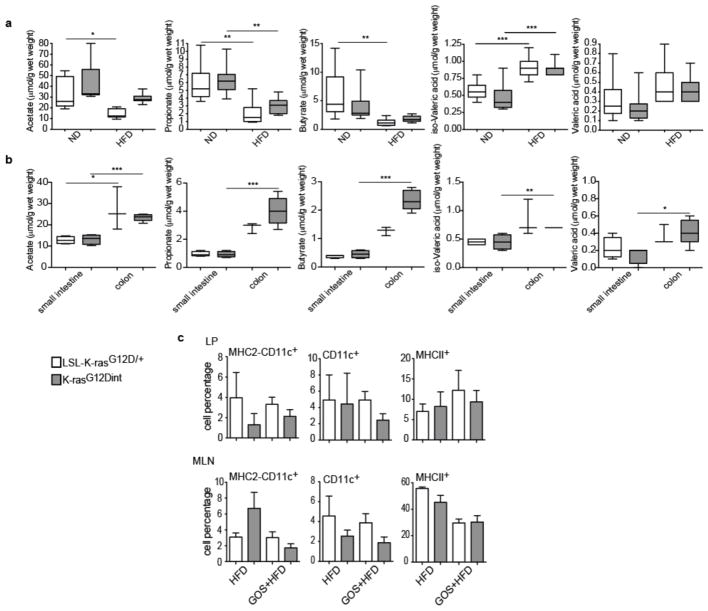
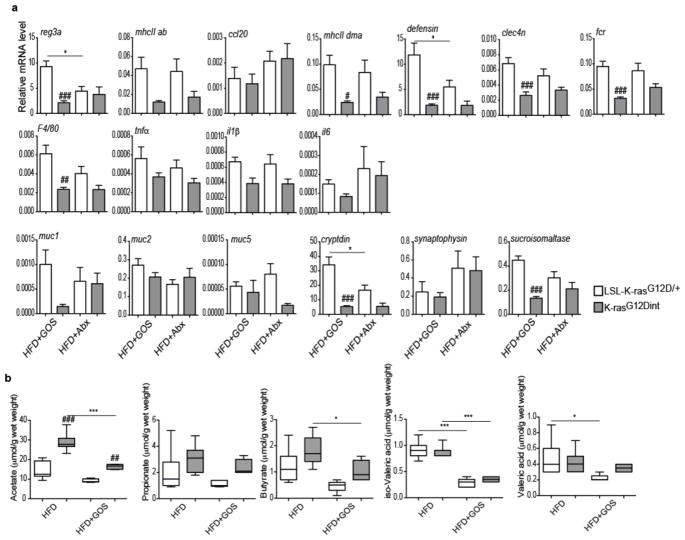
Dietary fibers promote short chain fatty acid (SCFA) formation and provide beneficial effects on health by selectively affecting a restricted number of bacteria (Bifidobacteria and Lactobacillus) in the gut18. Indeed, HFD-induced tumor progression was correlated with a significant reduction in acetate, propionate and butyrate concentrations (Extended Data Fig. 6a, b). To ascertain whether diet-induced tumorigenesis could be halted through further changes in microbiota, mice were supplemented with prebiotics. Interestingly, arabinogalactan supplementation did not provide any protective effect (Fig. 3a). However, there are different prebiotics with the key-differentiating factor being the length of the chemical chain, which determines where in the GI tract the prebiotic is going to exert its effect19. Supplementation of diet with galactooligosaccharide (GOS), did not affect tumor incidence (Fig. 3a) but slightly increased tumor numbers per mouse. CD11c+ DCs, MHC class II presentation on CD11c+ DCs in the LP and MLN (Extended Data Fig. 6c), as well as genes involved in immune response (Extended Data Fig. 7a), were equally reduced in K-rasG12Dint mice treated or not with GOS (compare to Extended Data Fig. 2). The lack of a protective effect could be due to the fact that prebiotics had very little or no effect on SCFA production throughout the gut (Extended Data Fig. 7b). Besides SCFA levels were significantly lower in the small intestine (Extended Data Fig. 6b).
Figure 3. Butyrate supplementation, but not prebiotics, confers protection against HFD-induced tumorigenesis.
a, Experimental scheme indicates additional nutritional supplementation during HFD and the time point for data analysis. Histological scores of the small intestine in K-rasG12Dint mice on HFD (n=16) compared to that of after arabinogalactan (LSL-K-rasG12D/+ controls n=5, K-rasG12Dint mice n=5), GOS (LSL-K-rasG12D/+ controls n=10, K-rasG12Dint mice n=12) and butyrate (LSL-K-rasG12D/+ controls n=6, K-rasG12Dint mice n=7) supplementation. Each point represents one animal and lines indicate mean. The scores were assessed using one-way ANOVA and adjustments on pairwise t-tests were made using the single-step method. *P ≤ 0.05. not significant, ns. b, LEfSe results show bacteria that were statistically different among K-rasG12Dint mice on HFD treated (n=5) or not (n=8) with butyrate and indicated the effect size of each differentially abundant bacteria in the small intestine. c, The expression profiles of selected top candidate genes involved in antigen recognition, immune response, and immune cell recruitment in duodenum samples from LSL-K-rasG12D/+ controls and littermate K-rasG12Dint animals (n=3 per group). P-values were obtained from the moderated t-statistic and corrected for multiple testing with the Benjamini–Hochberg method. d, FACS analysis of LP cells from LSL-K-rasG12D/+ control and K-rasG12Dint littermate animals on HFD treated with (LSL-K-rasG12D/+ controls n=4, K-rasG12Dint mice n=7) or without (LSL-K-rasG12D/+ controls n=2, K-rasG12Dint mice n=2) butyrate. P-values were determined by one-way ANOVA and adjusted for the number of comparisons with the Bonferroni method. Error bars indicate s.e.m. *P ≤ 0.05.
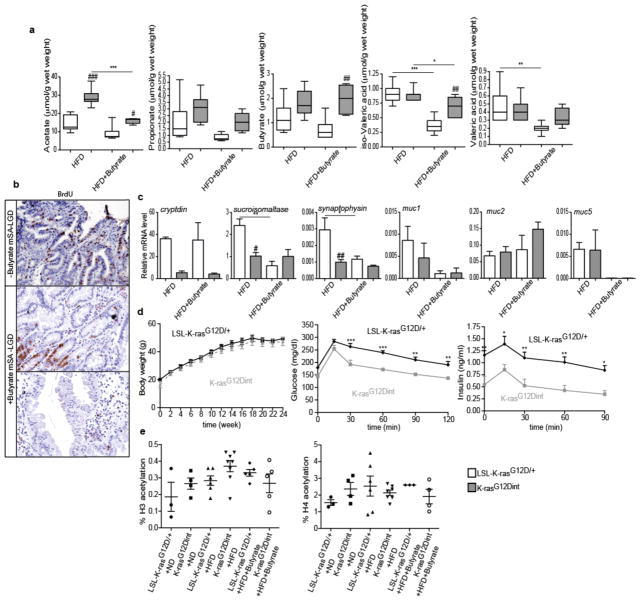
Therefore, we next aimed to determine whether diet-induced tumor progression could be prevented when mice were orally treated with butyrate. SCFAs, the end-products of colonic bacterial fermentation, employ several beneficial effects on the host. They serve as energy source, modulate intestinal motility, defense barrier, and are suggested to have immune-regulatory functions20,21. Although butyrate supplementation led to only a minor increase in fecal butyrate concentration (Extended Data Fig. 8a), it markedly reduced tumor incidence (Fig. 3a). This was associated with a significant increase in the abundance of Bifidobacteriaceae, Porphyromonadaceae and a sharp decrease in Helicobacteraceae in the small intestine (Fig. 3b). Interestingly, branching, serration and proliferation was partially blocked in K-rasG12Dint mice upon treatment with butyrate (Extended Data Fig. 8b). Diet-induced decrease in muc2 expression (Extended Data Fig. 8c) and genes involved in antigen recognition and immune response were partially restored to the level of the ND group (Fig. 3c). Moreover, compromised DC recruitment was nearly normalized (Fig. 3d). Although studies mainly focus on colonic bacteria, the small intestine plays a crucial role in carbohydrate and fat uptake22. However, the concentrations of SCFAs in the small intestine remained lower than those of the colonic or fecal samples (Extended Data Fig. 6b). Butyrate appeared to be a very potent SCFA having systemic effects on metabolic parameters during diet-induced obesity (Extended Data Fig. 8d), although histone H3 and H4 acetylation remained unaffected (Extended Data Fig. 8e). These results imply that butyrate may exert its protective effect on tumorigenesis at least in part through changes in bacterial composition and in regulating K-Ras signaling.
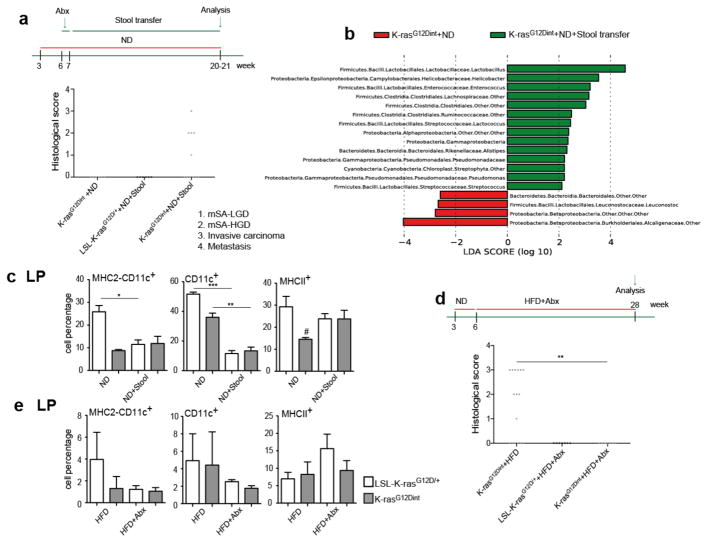
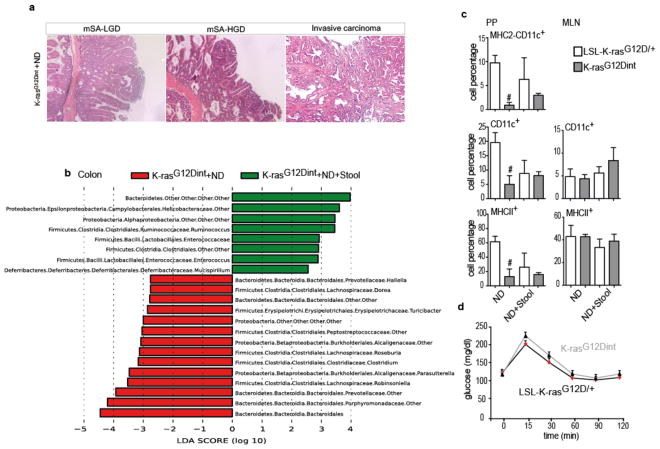
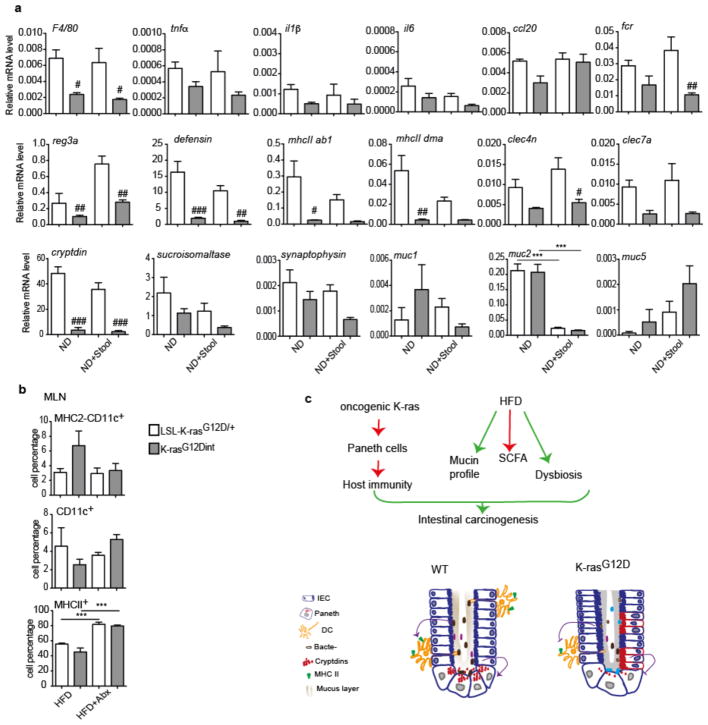
To prove the causal relationship between diet-induced dysbiosis and intestinal cancer, following one week of a treatment with an antibiotic mix, mice on ND were colonized with fresh fecal samples from HFD-fed K-rasG12Dint donors. Remarkably, disease could be transmitted to otherwise healthy K-rasG12Dint mice on ND, but not to LSL-K-rasG12D/+ controls (Fig. 4a and Extended Data Fig. 9a). Comparison of microbial community composition between K-rasG12Dint mice with or without stool transfer showed an increase in Lactobacillaceae, Helicobacteraceae and Clostridiaceae reflecting the transfer of the HFD-shaped microbiota in the ND phenotype (Fig. 4b and Extended Data Fig. 9b). Muc2 expression was significantly decreased reminiscent of the HFD group (Extended Data Fig. 10a). Recruitment and MHC-II presentation in LP and PP was also compromised (Fig. 4c and Extended Data Fig. 9c), and glucose clearance during GTT was similar to that of the ND group (compare Extended Data Fig. 9d to Fig. 1d). These findings provide evidence for a critical role of a diet-shaped microbiota synergizing with oncogenic K-Ras during tumorigenesis in the intestine, yet independent of obesity. To further support a causative role of a distinct shift in bacterial community for tumor progression, mice were treated with antibiotics. In support of the transfer experiments and a disease-associated microbiota, antibiotic supplementation completely abolished tumor incidence in K-rasG12Dint mice (Fig. 4d). Down-regulation of genes involved in immune response, mucin profile and differentiation markers in the duodenum were less pronounced (Extended Data Fig. 7a). MHC-II presentation on DCs in LP was still compromised (Fig. 4e), but not in MLN (Extended Data Fig. 10b). Taken together these results suggest a critical role for diet-shaped dysbiotic bacteria in aggravating oncogene-driven intestinal carcinogenesis (Extended Data Fig. 10c).
Figure 4. Disease-associated bacteria can be transmitted to healthy K-rasG12Dint animals and antibiotic treatment completely abolishes tumorigenesis.
a, Experimental scheme indicates stool transfer from HFD-fed donors, that were on the diet regimen for already 24 weeks at the time of experiment, to healthy 7-week old K-rasG12Dint recipients on ND following one week of antibiotic treatment. Histological score of the small intestine suggested delivery of disease-associated microbiota and increased tumor incidence in the recipient K-rasG12Dint mice (LSL-K-rasG12D/+ controls n=6, K-rasG12Dint mice n=11). Each point represents one animal and lines indicate means. The scores were assessed using two-sided Fisher test and adjustments on pairwise t-tests were made using the single-step method. b, LEfSe results show bacteria that were statistically different among K-rasG12Dint mice that have received (n=6) or not (n=3) stool transfer on ND. Increased and decreased abundance of bacteria in K-rasG12Dint mice that received stool transfer are shown in green and red, respectively. c, FACS analysis of LP cells after stool transfer. P-values were determined by one-way ANOVA and adjusted for the number of comparisons with the Bonferroni method. Error bars indicate s.e.m. *P = 0.05, **P = 0.001, ***P = 0.0001. #P = 0.05, compared to littermate controls. d, Experimental scheme indicating the application of antibiotic regimen during the course of HFD and the time point for data analysis. Histological scores of the small intestine samples showed complete protection from tumor incidence in the K-rasG12Dint mice (HFD+Abx: LSL-K-rasG12D/+ controls n=7, K-rasG12Dint mice n=7). Each point represents one animal and lines indicate means. The scores were assessed using two-sided Fisher test and adjustments on pairwise t-tests were made using the single-step method. **P = 0.001. e, FACS analysis of cells from the LP showed recruitment and surface antigen presentation on CD11c+ DCs in disease-free K-rasG12Dint mice after treatment with antibiotics (LSL-K-rasG12D/+ controls n=5, K-rasG12Dint mice n=7). P-values were determined by one-way ANOVA and adjusted for the number of comparisons with the Bonferroni method. Error bars indicate s.e.m. The differences were not significant.
Dysbiotic microbiota perturbing immune-regulatory functions is becoming increasingly recognized as a hallmark of immune-mediated diseases3. However, diet-associated cancer development may be based on profound shifts in bacterial communities rather than increased obesity and metabolic disorder. Thus, personalized dietary interventions may allow modulation of an individual’s microbiota to promote health, especially in those who are at a high risk due to genetic susceptibility and increased high-fat intake.
Methods
Mice
Littermate mice were co-housed randomly regardless of their genotype during different diet regimen and additional nutritional supplementation. However, during stool transfer experiments, mice were separated and co-housed according to their genotypes to avoid cross contamination. During treatment with antibiotics, mice were supplemented with a mix composed of 0.04 g ampicillin, 0.02 g vancomycin, 4.3 ml neomycin, 8.6 ml metronidazol dissolved in 200 ml drinking water. During transfer experiments, following antibiotic treatment for one week, 7 weeks old mice were colonized with fresh stool pellets (9×10⁶ bacteria) from mice fed on HFD (that were fed on HFD for already 24 weeks). GOS (Bi2muno) (5.5 gr) was provided in 150 ml drinking water, which was refreshed every 2 days. Sodium butyrate (Aldrich, 303410) (50 μg/g mouse in 100 μl H2O) and arabinogalactan (Fluka, A-09788) (0.01 g/g mouse in 100 μl H2O) were provided orally three times a week. K-rasG12Dint mice were further crossed to Myd88fl/fl and Myd88−/− animals (Jackson Laboratory, Bar Harbor, ME USA). During adoptive transfer experiments, six weeks old K-rasG12Dint mice were irradiated (9 Gy) and 2×10⁶ bone marrow cells from Myd88−/− or wildtype mice were transferred by tail vein injection to recipients. The procedures were approved by the Regierung von Oberbayern.
Human Samples
Human samples were collected with informed consent. Histological sections were microscopically evaluated after H&E staining by pathologists. All procedures were performed according to the recommendation of the ethics committee of LMU.
Glucose Tolerance Test (GTT)
Following 9 hours of fasting, basal glucose level was detected using a glucometer (Bayer, #3822850). Mice were injected with 1,5 g/kg body weight glucose (40% glucose solution, Eifelfango) and blood glucose levels were recorded up to 2 hours. Plasma samples were collected simultaneously to measure insulin secretion with Ultra Sensitive Rat Insulin ELISA Kit (Crystal Chem, #90060) using a mouse standard (Crystal Chem, #90070). Tests were assessed in a blinded manner.
RNA Analysis
Total RNA was extracted from small and large intestine using the RNeasy Mini Kit (Qiagen, Hilden, Germany). cDNA was synthesized using SuperScript II Reverse Transcriptase (Invitrogen, Carlsbad, CA USA). Real-time PCR analysis using Power SYBR Green PCR Master Mix (Applied Biosystems, Carlsbad, CA USA) was performed on a StepOne Plus Real-Time PCR System (Applied Biosystems). Primer sequences will be provided upon request.
Microarray analysis using the GeneChip® Mouse Gene 1.0 ST Array
RNA isolation from three biological replicates from duodenum samples was performed using the Trizol (Invitrogen) method according to the manufacturer’s instructions. The samples were treated with DNAse I (Sigma-Aldrich, St. Louis, MO USA). RNA quality was checked using the Agilent 2100 Bioanalyzer (Agilent Technologies, Santa Clara, CA, USA) microfluidic electrophoresis and only samples with comparable RNA integrity numbers were processed for microarray analysis.
cDNA was synthesized using 0.3 μg of total RNA. The synthesis of the double-stranded cDNA was performed using the WT Target Labeling and Control Reagents (Affymetrix, Santa Clara, CA, USA) and the cleanup was done using the GeneChip® Sample Cleanup module (Affymetrix).
In vitro transcription was conducted using the WT Target Labeling Kit (Affymetrix). The total amount of the reaction product was purified using the GeneChip® cRNA Sample Cleanup Module (Affymetrix) and quantified with the NanoDrop ND-1000 (Nanodrop (Thermo), Wilmington, DE USA). cDNA synthesis (ss) was done with the WT Target Labeling Kit (Affymetrix) and the total ssDNA (5.5 μg) was cleaved 35–200 bp fragments enzymatically. The degree of fragmentation and the length distribution of the ssDNA were analyzed by capillary electrophoresis using the Agilent 2100 Bioanalyzer (Agilent Technologies). Following fragmentation, a terminal labeling reaction (Biotin) was conducted using the WT Labeling Kit (Affymetrix).
Biotinylated fragmented ssDNA was then hybridized onto the GeneChip® Mouse Gene 1.0 ST Array (Affymetrix) according to the manufacturer’s instructions. The hybridization was carried out at 45°C in the GeneChip® Hybridization Oven 640 (Affymetrix) for 16 h. Washing and staining of the arrays on the Gene Chip® Fluidics Station 450 (Affymetrix) were performed according to the manufacturer’s recommendation. The amplification of the antibody signal, washing and staining protocols were used to stain the arrays with streptavidin R-phycoerythrin (SAPE; Invitrogen). SAPE solution was added twice together with a biotinylated anti-streptavidin antibody (Vector Laboratories, Burlingame, CA, USA) staining step in order to amplify staining. Finally the arrays were scanned using the GeneChip® Scanner 3000 7G (Affymetrix).
Microarray data processing and statistical analysis
Affymetrix AGCC Software (version 2.0) (Affymetrix) was used for the extraction of intensity data and analyzed using the affy23 and Limma package24 of Bioconductor25. The analysis has been performed exactly as previously described26. The data analysis consisted of between-array normalization, probe summary, global clustering and PCA-analysis, fitting the data to a linear model and detection of differential gene expression. To ensure that the intensities had similar distributions across arrays, quantile-normalization was applied to the log2-transformed intensity values as a method for between-array normalization27. As for the summary of probes a median polish procedure was chosen.
Significant changes in the expression of genes between the groups was analyzed by Empirical Bayes statistics by moderating the standard errors of the estimated values28.
P-values obtained from the moderated t-statistic were corrected for multiple testing with the Benjamini–Hochberg method29. P-value adjustments guarantee a smaller number of false positive findings by controlling the false discovery rate (fdr). For each gene the null hypothesis suggesting there is no differential expression between degradation levels was rejected when its fdr was lower than 0.05. Samples were assessed in a blinded manner.
Cell isolation from lamina propria (LP)
Intestinal tissue was cut into small pieces, shaken vigorously in 25 ml RPMI and washed 3 times with PBS. Tissue pieces were then incubated in 50 ml PBS containing 0.015 g DTT and 500 μl 0.5 M EDTA with constant shaking for 20 min at 37°C. The pieces were then collected and transferred in 10 ml RPMI containing 50 μl DNase l grade II (100 mg/ml) and 50 μl Collagenase D (100 mg/ml), and incubated further for 25 min in a rotating incubator at 37°C. Cells were passed through a cell strainer, centrifuged at 194 g for 5 min, and the resulting pellet was resuspended in FACS-buffer (2% FCS/PBS).
Cell isolation from Peyer′s Patches (PP)
PPs were excised from the intestine. They were incubated for 20 min in a mixture of 3 ml RPMI, 15 μl Collagenase D (100 mg/ml) and 15 μl DNase I grade II (20 mg/ml) at 37°C. The solution was then passed through a cell strainer and incubated for 10 min at 37°C. The reaction was stopped by the addition of 10 μl 0.5 M EDTA, and the volume was adjusted to 10 ml with RPMI. After centrifugation at 249 g for 5 min, cells were resuspended in FACS-buffer.
Cell isolation from mesenteric lymph node (MLN)
MLNs were collected in 5 ml 2% FCS/PBS, sheared on glass slides, and passed through 100 μm and 70 μm filters, respectively. Following centrifugation at 194 g for 5 min at 4°C, erythrocytes were lysed with 1 ml of Red blood cell lysing buffer (Sigma) for 5 min at room temperature. Pellets were then washed in 2% FCS/PBS, centrifuged and resuspended in FACS-buffer.
FACS
After cell isolation from LP, PP, and MLN, approximately 1 × 10⁶ cells were stained with 0.5 μg/ml Ethidium monoazide (EMA) (Sigma, #E2028) to stain dead cells for 15 min under light. Cells were washed and incubated with CD16/32 Fc Block (BD Pharmingen, Clone: 2.4G2, #553141) for 10 min on ice, washed, and then centrifuged at 775 g for 5 min. Fluorescent antibodies (FITC rat anti-mouse CD11b antibody, BD Pharmingen, Clone: M1/70, #557396; anti-mouse PE-Cyanine7 CD11c, eBioscience, Clone: N418, #25-0114-82; APC anti-Mouse MHC Class II (I-A/I-E), eBioscience, Clone: M5/114.15.2, #17-5321-81) (1:200) were added and incubated for 20 min on ice. After washing, cells were fixed by incubating in fixation buffer (eBioscience) for 30 min on ice. Following a further washing step, cells were suspended in FACS buffer, filtered using 50 μm filcons (Günter Keul GmbH) and sorted using the Gallios Flow Cytometer Beckman Coulter. Data analyses were done using FlowJo Version 8.8.6.
Sample preparation and pyrosequencing
Stool samples were freshly collected and immediately frozen in liquid nitrogen. Genomic DNA was isolated from 200 mg frozen fecal samples using the Qiagen Stool DNA Extraction Kit. PCR amplification of the V1-V3 region of bacterial 16S rDNA was performed using primers (338F- 5′-ACTCCTACGGGAGGCAGCAG-3′, 806R- 5′-GGACTACCAGGGTATCTAAT-3′) incorporating the FLX Titanium adapters and a sample barcode sequence. The PCR was made based on ‘Amplicon Library Preparation Method’ (Roche) using FastStart High Fidelity PCR System (Roche), 10 mM PCR Nucleotide Mix (Roche) and 10 ng stool DNA per reaction in a 25 μl reaction volume. After purification of the product on a 1.2 % agarose gel, equal concentrations of amplicons were pooled from each sample. Emulsion PCR and GS FLX Amplicon sequencing were performed according to the Roche Titanium series chemistry.
Pyrosequenced amplicon libraries were screened for quality characteristics, chimeric sequences, and PCR/pyrosequencing-induced duplication artifacts using AmpliconNoise and Perseus software version 1.28 as described in Quince et al.30. Cleaned data sets were processed using the Qiime amplicon analysis pipeline version 1.7.031. Briefly, sequences were clustered into distance-based (97% similarity) operational taxonomic units (OTUs) using mothur version 1.30.232. Representatives of each OTU were aligned to GreenGenes core set alignment33 using PyNAST version 1.134. Taxonomic assignments for each OTU were made using the Ribosomal Database Project (RDP) Classifier version 2.235.
LEfSe results on microbiomes
LEfSe is an algorithm for applying 16S rRNA gene datasets to detect bacterial organisms and functional characteristics differentially abundant between two or more microbial environments36. It emphasizes statistical significance, biological consistency and effect relevance, allowing identification of differentially abundant features that are also consistent with biologically meaningful categories (subclasses). LEfSe first robustly identifies features that are statistically different among biological classes. It then performs additional tests to assess whether these differences are consistent with respect to expected biological behavior. The non-parametric factorial Kruskal-Wallis (KW) sum-rank test is used to detect features with significant differential abundance with respect to the class of interest; biological consistency is subsequently investigated using a set of pairwise tests among subclasses using the (unpaired) Wilcoxon rank-sum test. As a last step, LEfSe uses LDA to estimate the effect size of each differentially abundant feature. Samples were assessed in a blinded manner.
SCFA measurement
Stool samples were freshly collected and immediately frozen in liquid nitrogen. A 1:5 dilution of the samples was centrifuged and the supernatant mixed with 12 mM Isobutyric acid, 1 M NaOH and 0.36 M HCIO4. After lyophilization overnight, the remaining was diluted with acetone and 5 M formic acid, centrifuged and the supernatant used for the measurement with an HP 5890 series II gas chromatograph from Hewlett-Packard. Samples were assessed in a blinded manner.
Histone Acetylation
Histones were extracted using EpiQuik Total Histone Extraction Kit (OP-0006). H3 or H4 acetylation was determined using EpiQuik Global Histone H3 or H4 Acetylation Assay Kit (P-4008, P-4009), respectively, according to the manufacturer’s instructions.
Statistical analysis
Outcomes on sufficiently metric scales (cell percentage, mRNA levels, SCFA levels, % histone acetylation) were assessed with linear models (one-way ANOVA), modeling the mean value of each group, which were defined through mutation, diet and diet supplementation. Relevant comparisons of mean values between groups were made with two-sided pairwise t-tests, the null hypotheses stated no difference in means. P-values were adjusted for the number of comparisons with the Bonferroni method.
Outcomes on discrete/ordinal scale (histological scores) were either assessed using Fisher’s test or one-way ANOVA models as above. The Fisher test was chosen when one of the groups to compare comprised only values on a single outcome level, as in such a case the assumption of equal variances is hardly violated. The two-sided Fisher test was applied to a two-by-two contingency table classifying the histological scores to either no pathology or any pathology. The ANOVA method was chosen when both groups had observations on at least two levels of the histological score and mimicked the Cochran-Mantel-Haenszel tests for linear trends in ordinal outcomes. Adjustments on pairwise t-tests were made using the single-step method37. Both types of adjustments control the family-wise error rate of making one or more false discoveries.
Outcomes measured over several time points (glucose tolerance test, insulin values, and weight curve) were assessed for differences between groups (LSL-K-rasG12D/+ control animals and K-rasG12Dint mice) with linear models. The models estimated the mean values of each group-time combination and t-tests were carried out for every pair of mean values at a specific time point. P-values were adjusted for multiple testing within each time series, i.e. for 5 to 6 tests for glucose and insulin and for 12 tests in the weight measurements. Adjustment was done with the single-step method as mentioned above, which is implemented in the glht (general linear hypothesis) function from R package multcomp.
The number of mice per each group used in an experiment is annotated in the corresponding figure legend as n. Although no prior sample size estimation was performed, we have used as many mice per group as possible. No gender differences were observed. Significance of tests is reported as: ns (not significant), * (p-value ≤ 0.05), ** (p-value ≤ 0.01) and *** (p-value = 0.001). Statistical tests were performed using Prism4 (GraphPad Software Inc.) and R (R Core Team, 2013).
Extended Data
Extended Data Figure 1.
a, Primary tumors metastasized to liver, pancreas and spleen in K-rasG12Dint mice kept on HFD for 43 weeks. b, Immunohistochemistry staining on duodenum samples using antibody against BrdU showed increased proliferation in K-rasG12Dint mice. c, Weight curves for LSL-K-rasG12D/+ controls (n=4) and K-rasG12Dint (n=6) littermate animals showed no difference in weight gain under ND condition although K-rasG12Dint mice (n=7) remained significantly leaner when fed on a HFD (LSL-K-rasG12D/+ controls n=5). P-values were determined by t-test and adjusted for multiple testing. Error bars indicate s.e.m. *P ≤ 0.05, **P ≤ 0.001. d, In accordance with weight curves, response to glucose overload and insulin secretion during a GTT remained similar between the two groups under ND, however K-rasG12Dint mice remained insulin sensitive on HFD. (ND: LSL-K-rasG12D/+ controls n=3, K-rasG12Dint mice n=5; HFD: LSL-K-rasG12D/+ controls n=8, K-rasG12Dint mice n=5). P-values were determined by t-test and adjusted for multiple testing. Error bars indicate s.e.m. *P ≤ 0.05, **P ≤ 0.001. Results are representative of 2–3 independent experiments. e, Along with resistance to diet-induced obesity, K-rasG12Dint mice showed microvesicular steatosis in contrast to littermate controls that had macrovesicular steatosis suggesting decreased lipid accumulation in the liver. f, mRNA expression levels for F4/80 and TNFα were analyzed by RT-PCR (n=5). Plasma TNFα levels determined by ELISA showed decreased levels in K-rasG12Dint mice. P-values were determined by t-test. Error bars indicate s.e.m. *P ≤ 0.05.
Extended Data Figure 2.
a, Relative mRNA expression levels for genes involved in immune responses were analyzed using duodenum samples by RT-PCR under ND and HFD condition (ND: LSL-K-rasG12D/+ controls n=3, K-rasG12Dint mice n=3; HFD: LSL-K-rasG12D/+ controls n=3, K-rasG12Dint mice n=6). P-values were determined by one-way ANOVA and adjusted for the number of comparisons with the Bonferroni method. Error bars indicate s.e.m. **P ≤ 0.001. #P ≤ 0.05, ##P ≤ 0.001 compared to littermate controls. b, Azure Eosin staining of duodenum samples showed decreased antimicrobial peptides in the crypts from K-rasG12Dint mice. c, Expression of differentiation markers for Paneth cells (cryptdin), epithelial cells (sucroisomaltase), and enteroendocrine cells (synaptophysin) as well as mucins in the duodenum was analyzed by RT-PCR under ND and HFD regimen (ND: LSL-K-rasG12D/+ controls n=3, K-rasG12Dint mice n=3; HFD: LSL-K-rasG12D/+ controls n=3, K-rasG12Dint mice n=4). P-values were determined by one-way ANOVA and adjusted for the number of comparisons with the Bonferroni method. Error bars indicate s.e.m. *P ≤ 0.05. ###P ≤ 0.0001 compared to littermate controls. d, FACS analysis of cells from lamina propria (LP) and Peyer’s Patches (PP) indicated CD11c+ DCs and MHC-II expression in K-rasG12Dint mice and littermate controls after ND or HFD regimen (n=2). P-values were determined by one-way ANOVA and adjusted for the number of comparisons with the Bonferroni method. Error bars indicate s.e.m. *P ≤ 0.05, **P ≤ 0.001. #P ≤ 0.05 compared to littermate controls.
Extended Data Figure 3.
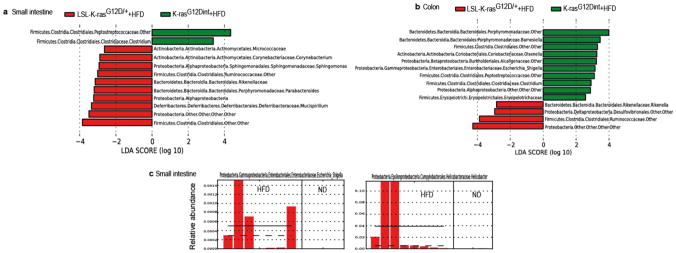
a, LEfSe results showed bacteria that were statistically different among K-rasG12Dint mice and littermate controls on HFD and indicated the effect size of each differentially abundant bacteria in the small intestine (LSL-K-rasG12D/+ controls n=3, K-rasG12Dint mice n=8) and b, the colon (LSL-K-rasG12D/+ controls n=5, K-rasG12Dint mice n=7). c, Relative abundance of Escherichia/Shigella and Helicobacter in the small intestine of K-rasG12Dint mice on ND and HFD.
Extended Data Figure 4.
a, Histological scores of the small intestine showed complete lack of tumor progression in K-rasG12Dint mice with Myd88 deletion after HFD. However, tissue-specific deletion of Myd88 did not confer any protection in K-rasG12Dint mice (Myd88−/−-LSL-K-rasG12D/+ controls n=19, Myd88−/−-K-rasG12Dint mice n=15; Myd88fl/fl-LSL-K-rasG12D/+ controls n=5, Myd88IEC-K-rasG12Dint mice n=7; K-rasG12Dint+WT BM mice n=7, K-rasG12Dint+MyD88−/− BM mice n=8). Each point represents one animal and lines indicate means. Two-sided Fisher test was applied. Adjustments on pairwise t-tests were made using the single-step method. ***P ≤ 0.0001. not significant, ns. b, LEfSe results showed bacteria that were statistically different among K-rasG12Dint mice with (n=8) or without (n=4) Myd88 deletion on HFD. Peptostreptococcaceae, Deferribacteraceae, and Ruminococcaceae in the small intestine and Peptostreptococcaceae, and Deferribacteraceae in the colon, became abundant after Myd88 deficiency (K-rasG12Dint mice n=7, Myd88−/−-K-rasG12Dint mice n=4). c, FACS analysis of lamina propria (LP) cells indicated decreased recruitment and surface antigen presentation in CD11c+ DCs following HFD was partially attenuated after MyD88 deletion (Myd88−/−-LSL-K-rasG12D/+ controls n=8, Myd88−/−-K-rasG12Dint mice n=4). P-values were determined by one-way ANOVA and adjusted for the number of comparisons with the Bonferroni method. Error bars indicate s.e.m. *P ≤ 0.05, **P ≤ 0.001.
Extended Data Figure 5.
a, LEfSe results showed small intestinal bacteria that were significantly different among K-rasG12Dint mice with and without Myd88 deletion in the IECs or b and c, hematopoietic cells on HFD (Myd88IEC-K-rasG12Dint mice n=4; K-rasG12Dint+WT BM mice n=4, K-rasG12Dint+MyD88−/− BM mice n=4, K-rasG12Dint mice n=8).
Extended Data Figure 6.
a,HFD decreased acetate, butyrate, and propionate concentration, whereas iso-Valeric acid and Valeric acid increased in stool samples from K-rasG12Dint mice and littermate controls (ND: LSL-K-rasG12D/+ controls n=6, K-rasG12Dint mice n=8; HFD: LSL-K-rasG12D/+ controls n=7, K-rasG12Dint mice n=11). P-values were determined by one-way ANOVA and adjusted for the number of comparisons with the Bonferroni method. Error bars indicate s.e.m. *P ≤ 0.05, **P ≤ 0.001, ***P ≤ 0.0001. b, SCFA concentrations of small intestinal (LSL-K-rasG12D/+ controls n=4, K-rasG12Dint mice n=4) and colonic samples (LSL-K-rasG12D/+ controls n=3, K-rasG12Dint mice n=5) from K-rasG12Dint and control littermates on HFD supplemented with arabinogalactan. P-values were determined by one-way ANOVA followed by Bonferroni’s multiple comparison test. Error bars indicate s.e.m. *P ≤ 0.05, **P ≤ 0.001, ***P ≤ 0.0001. c, FACS analysis of cells from lamina propria (LP) and mesenteric lymph nodes (MLN) revealed compromised DC recruitment and decreased surface antigen presentation on HFD following supplementation with GOS. (HFD: LSL-K-rasG12D/+ controls n=2, K-rasG12Dint mice n=2; HFD+GOS: LSL-K-rasG12D/+ controls n=5, K-rasG12Dint mice n=3). P-values were determined by one-way ANOVA and adjusted for the number of comparisons with the Bonferroni method. Error bars indicate s.e.m. The differences were not significant.
Extended Data Figure 7.
a, Relative mRNA expression levels for genes involved in immune responses, mucins and differentiation markers for Paneth, enteroendocrine, and epithelial cells using duodenum samples (HFD+GOS: LSL-K-rasG12D/+ controls n=5, K-rasG12Dint mice n=6; HFD+Abx: LSL-K-rasG12D/+ controls n=5, K-rasG12Dint mice n=6). P-values were determined by one-way ANOVA and adjusted for the number of comparisons with the Bonferroni method. Error bars indicate s.e.m. *P ≤ 0.05. #P ≤ 0.05, ##P ≤ 0.001, ###P ≤ 0.0001, compared to littermate controls. b, Prebiotic supplementation had very little or no effect on stool SCFA concentrations. (HFD: LSL-K-rasG12D/+ controls n=7, K-rasG12Dint mice n=11; HFD+GOS: LSL-K-rasG12D/+ controls n=5, K-rasG12Dint mice n=6). P-values were determined by one-way ANOVA and adjusted for the number of comparisons with the Bonferroni method. Error bars indicate s.e.m. *P ≤ 0.05, ***P ≤ 0.0001. ##P ≤ 0.001, ###P ≤ 0.0001, compared to littermate controls.
Extended Data Figure 8.
a, Sodium butyrate treatment affected butyrate and propionate concentrations in the stool only slightly when compared to prebiotic supplementation. (HFD: LSL-K-rasG12D/+ controls n=7, K-rasG12Dint mice n=11; HFD+Butyrate: LSL-K-rasG12D/+ controls n=6, K-rasG12Dint mice n=5). P-values were determined by one-way ANOVA and adjusted for the number of comparisons with the Bonferroni method. Error bars indicate s.e.m. *P ≤ 0.05, **P ≤ 0.001, ***P ≤ 0.0001. #P ≤ 0.05, ##P ≤ 0.001, ###P ≤ 0.0001, compared to littermate controls. b, Increased proliferation observed in the duodenum of K-rasG12Dint mice was decreased following butyrate supplementation. c, Expression of differentiation markers and mucins in the duodenum (HFD: LSL-K-rasG12D/+ controls n=3, K-rasG12Dint mice n=4; HFD+Butyrate: LSL-K-rasG12D/+ controls n=3, K-rasG12Dint mice n=3). P-values were determined by one-way ANOVA and adjusted for the number of comparisons with the Bonferroni method. Error bars indicate s.e.m. *P ≤ 0.05, **P ≤ 0.001. #P ≤ 0.05, ##P ≤ 0.001, compared to littermate controls. d, Butyrate employed systemic effects and protected K-rasG12Dint mice and littermate controls against HFD-induced hyperinsulinemia (n=5 per group). Data were assessed by t-test and P-values were adjusted for multiple testing. Error bars indicate s.e.m. *P ≤ 0.05, **P ≤ 0.001, ***P ≤ 0.0001. e, Butyrate treatment did not affect H3 or H4 acetylation (n= 3–8). Data was assessed with one-way ANOVA and P-values were adjusted for the number of comparisons with the Bonferroni method. Error bars indicate s.e.m. Results were not significant.
Extended Data Figure 9.
a, Following one week of antibiotic cocktail treatment, approximately 7 week-old K-rasG12Dint mice and littermate controls were gavaged three times a week with fresh stool pellets from HFD-fed mutants (24 weeks on HFD on the day of first transfer) for a total of 15 weeks on ND. H&E staining of duodenum samples from three gavaged K-rasG12Dint mice show mSA-LGD and HGD, as well as invasive carcinoma development. b, LEfSe results showed bacteria that were statistically different among K-rasG12Dint mice fed on ND, gavaged or not with stool samples from HFD K-rasG12Dint donors. Helicobacteraceae, Enterococcaceae and Deferribacteraceae became more abundant in the colon following stool transfer (K-rasG12Dint mice+ND n=3, K-rasG12Dint mice+ND+Stool n=6). c, FACS analysis of cells from PP and MLN showed antigen presentation on CD11c+ DCs. (ND: LSL-K-rasG12D/+ controls n=2, K-rasG12Dint mice n=2; ND+Stool: LSL-K-rasG12D/+ controls n=3, K-rasG12Dint mice n=8). P-values were determined by one-way ANOVA and adjusted for the number of comparisons with the Bonferroni method. Error bars indicate s.e.m. #P ≤ 0.05, compared to littermate controls. d, Glucose clearance in K-rasG12Dint mice and littermate controls (n=5 per group) on ND transferred with stool samples from HFD-fed K-rasG12Dint donors during a GTT. Results were analyzed by t-test. P-values were adjusted for multiple testing. Error bars indicate s.e.m. The differences were not significant.
Extended Data Figure 10.
a, The expression profiles of selected genes involved in antigen recognition, immune response, immune cell recruitment, differentiation markers and mucins in duodenum samples from LSL-K-rasG12D/+ and K-rasG12Dint littermate animals. (ND: LSL-K-rasG12D/+ controls n=3, K-rasG12Dint mice n=3; ND+Stool: LSL-K-rasG12D/+ controls n=3, K-rasG12Dint mice n=5). P-values were determined by one-way ANOVA and adjusted for the number of comparisons with the Bonferroni method. Error bars indicate s.e.m. ***P ≤ 0.0001. #P ≤ 0.05, ##P ≤ 0.001, ###P ≤ 0.0001, compared to littermate controls. b, FACS analysis of MLN cells indicates recruitment and antigen presentation on CD11c+ DCs following treatment with antibiotics. (HFD: LSL-K-rasG12D/+ controls n=2, K-rasG12Dint mice n=2; HFD+Abx: LSL-K-rasG12D/+ controls n=5, K-rasG12Dint mice n=7). P-values were determined by one-way ANOVA and adjusted for the number of comparisons with the Bonferroni method. Error bars indicate s.e.m. ***P = 0.0001. Results are not significant. c, Mechanistic scheme suggests HFD-induced changes in bacterial community, SCFA levels, and alterations in mucin profiles cooperate with oncogene-associated decreased host immunity, which collectively enhance carcinogenesis in the small intestine.
Acknowledgments
We would like to thank Kerstin Burmeister for technical assistance and Hermann Wagner for generously providing Myd88−/− mice. We are thankful to Katrin Offe and the PhD program ‘Medical Life Sciences and Technology’ for providing a fellowship to J.H. for one year. This work was supported in part by the LOEWE Center for Cell and Gene Therapy Frankfurt (CGT, III L 4-518/17.004) and institutional funds of the Georg-Speyer-Haus as well as grants from DFG (Gr1916/5-1), Deutsche Krebshilfe (108872) and ERC (ROSCAN-281967) to F.R.G. Computational infrastructure made available to S.W.P. by the University of Delaware Center for Bioinformatics and Computational Biology Core Facility and Delaware Biotechnology Institute was supported by grants from the US NIH National Institute of General Medical Sciences (8 P20 GM103446-12) and US National Science Foundation EPSCoR (EPS-081425). M.C.A. was supported by grants from Deutsche Krebshilfe (107977) and Deutsche Forschungsgemeinschaft (AR710/2-1). This work was supported by Deutsche Krebshilfe (107977).
Footnotes
Author Contributions
M.D.S., Ç.A., J.H. and M.C.A. performed the experimental work and managed data analyses. F.K.R., S.S., B.A., P.K.Z., J.V., W.R. and F.R.G. assisted with sample collection, bone marrow transplantation, and FACS analyses. C.P. and G.S.R. carried out sample preparation and microarray analyses. A.B. conducted statistical analyses. C.A. and M.B. performed gas chromatography. L.B. and T.K. provided human samples and evaluated all histological sections. S.C.P. and S.W.P. conducted 16S rRNA gene sequencing computational analyses. M.C.A. designed the study and prepared the manuscript.
The microarray data discussed in this paper were generated conforming to the MIAME guidelines and are deposited in the Gene Expression Omnibus (GEO) database at http://www.ncbi.nlm.nih.gov/geo/ under accession number GSE56257. Sequence data has been deposited to the NCBI Sequence Read Archive under BioProject PRJNA242565 (SRA project: SRP040736; samples: SRS584259-SRS584323, SRS584325).
The authors declare no competing financial interests.
References
- 1.Giovannucci E, Michaud D. The role of obesity and related metabolic disturbances in cancers of the colon, prostate, and pancreas. Gastroenterology. 2007;132:2208–2225. doi: 10.1053/j.gastro.2007.03.050. [DOI] [PubMed] [Google Scholar]
- 2.Wu GD, et al. Linking long-term dietary patterns with gut microbial enterotypes. Science. 2011;334:105–108. doi: 10.1126/science.1208344. [DOI] [PMC free article] [PubMed] [Google Scholar]
- 3.Schwabe RF, Jobin C. The microbiome and cancer. Nat Rev Cancer. 2013;13:800–812. doi: 10.1038/nrc3610. [DOI] [PMC free article] [PubMed] [Google Scholar]
- 4.Turnbaugh PJ, Backhed F, Fulton L, Gordon JI. Diet-induced obesity is linked to marked but reversible alterations in the mouse distal gut microbiome. Cell Host Microbe. 2008;3:213–223. doi: 10.1016/j.chom.2008.02.015. [DOI] [PMC free article] [PubMed] [Google Scholar]
- 5.Zimmet P, Alberti KG, Shaw J. Global and societal implications of the diabetes epidemic. Nature. 2001;414:782–787. doi: 10.1038/414782a. [DOI] [PubMed] [Google Scholar]
- 6.Ley RE, Turnbaugh PJ, Klein S, Gordon JI. Microbial ecology: human gut microbes associated with obesity. Nature. 2006;444:1022–1023. doi: 10.1038/4441022a. [DOI] [PubMed] [Google Scholar]
- 7.Turnbaugh PJ, et al. An obesity-associated gut microbiome with increased capacity for energy harvest. Nature. 2006;444:1027–1031. doi: 10.1038/nature05414. [DOI] [PubMed] [Google Scholar]
- 8.Bennecke M, et al. Ink4a/Arf and oncogene-induced senescence prevent tumor progression during alternative colorectal tumorigenesis. Cancer Cell. 2010;18:135–146. doi: 10.1016/j.ccr.2010.06.013. [DOI] [PubMed] [Google Scholar]
- 9.Arkan MC, et al. IKK-beta links inflammation to obesity-induced insulin resistance. Nat Med. 2005;11:191–198. doi: 10.1038/nm1185. [DOI] [PubMed] [Google Scholar]
- 10.Khasawneh J, et al. Inflammation and mitochondrial fatty acid beta-oxidation link obesity to early tumor promotion. Proc Natl Acad Sci U S A. 2009;106:3354–3359. doi: 10.1073/pnas.0802864106. [DOI] [PMC free article] [PubMed] [Google Scholar]
- 11.Clevers HC, Bevins CL. Paneth cells: maestros of the small intestinal crypts. Annu Rev Physiol. 2013;75:289–311. doi: 10.1146/annurev-physiol-030212-183744. [DOI] [PubMed] [Google Scholar]
- 12.Shan M, et al. Mucus enhances gut homeostasis and oral tolerance by delivering immunoregulatory signals. Science. 2013;342:447–453. doi: 10.1126/science.1237910. [DOI] [PMC free article] [PubMed] [Google Scholar]
- 13.Maslowski KM, Mackay CR. Diet, gut microbiota and immune responses. Nat Immunol. 2011;12:5–9. doi: 10.1038/ni0111-5. [DOI] [PubMed] [Google Scholar]
- 14.Kawai T, Akira S. The role of pattern-recognition receptors in innate immunity: update on Toll-like receptors. Nat Immunol. 2010;11:373–384. doi: 10.1038/ni.1863. [DOI] [PubMed] [Google Scholar]
- 15.Slack E, et al. Innate and adaptive immunity cooperate flexibly to maintain host-microbiota mutualism. Science. 2009;325:617–620. doi: 10.1126/science.1172747. [DOI] [PMC free article] [PubMed] [Google Scholar]
- 16.Larsson E, et al. Analysis of gut microbial regulation of host gene expression along the length of the gut and regulation of gut microbial ecology through MyD88. Gut. 2012;61:1124–1131. doi: 10.1136/gutjnl-2011-301104. [DOI] [PMC free article] [PubMed] [Google Scholar]
- 17.Ubeda C, et al. Familial transmission rather than defective innate immunity shapes the distinct intestinal microbiota of TLR-deficient mice. J Exp Med. 2012;209:1445–1456. doi: 10.1084/jem.20120504. [DOI] [PMC free article] [PubMed] [Google Scholar]
- 18.Redgwell RJ, Fischer M. Dietary fiber as a versatile food component: an industrial perspective. Mol Nutr Food Res. 2005;49:521–535. doi: 10.1002/mnfr.200500028. [DOI] [PubMed] [Google Scholar]
- 19.Macfarlane GT, Steed H, Macfarlane S. Bacterial metabolism and health-related effects of galacto-oligosaccharides and other prebiotics. J Appl Microbiol. 2008;104:305–344. doi: 10.1111/j.1365-2672.2007.03520.x. [DOI] [PubMed] [Google Scholar]
- 20.Furusawa Y, et al. Commensal microbe-derived butyrate induces the differentiation of colonic regulatory T cells. Nature. 2013 doi: 10.1038/nature12721. [DOI] [PubMed] [Google Scholar]
- 21.Brestoff JR, Artis D. Commensal bacteria at the interface of host metabolism and the immune system. Nat Immunol. 2013;14:676–684. doi: 10.1038/ni.2640. [DOI] [PMC free article] [PubMed] [Google Scholar]
- 22.Zoetendal EG, et al. The human small intestinal microbiota is driven by rapid uptake and conversion of simple carbohydrates. ISME J. 2012;6:1415–1426. doi: 10.1038/ismej.2011.212. [DOI] [PMC free article] [PubMed] [Google Scholar]
- 23.Gautier L, Cope L, Bolstad BM, Irizarry RA. affy--analysis of Affymetrix GeneChip data at the probe level. Bioinformatics. 2004;20:307–315. doi: 10.1093/bioinformatics/btg405. [DOI] [PubMed] [Google Scholar]
- 24.Wettenhall JM, Smyth GK. limmaGUI: a graphical user interface for linear modeling of microarray data. Bioinformatics. 2004;20:3705–3706. doi: 10.1093/bioinformatics/bth449. [DOI] [PubMed] [Google Scholar]
- 25.Gentleman RC, et al. Bioconductor: open software development for computational biology and bioinformatics. Genome Biol. 2004;5:R80. doi: 10.1186/gb-2004-5-10-r80. [DOI] [PMC free article] [PubMed] [Google Scholar]
- 26.Meyer S, Nolte J, Opitz L, Salinas-Riester G, Engel W. Pluripotent embryonic stem cells and multipotent adult germline stem cells reveal similar transcriptomes including pluripotency-related genes. Mol Hum Reprod. 2010;11:846–855. doi: 10.1093/molehr/gaq060. [DOI] [PubMed] [Google Scholar]
- 27.Irizarry RA, et al. Exploration, normalization, and summaries of high density oligonucleotide array probe level data. Biostatistics. 2003;4:249–264. doi: 10.1093/biostatistics/4.2.249. [DOI] [PubMed] [Google Scholar]
- 28.Smyth GK. Linear models and empirical bayes methods for assessing differential expression in microarray experiments. Stat Appl Genet Mol Biol. 2004;3:Article 3. doi: 10.2202/1544-6115.1027. [DOI] [PubMed] [Google Scholar]
- 29.Klipper-Aurbach Y, et al. Mathematical formulae for the prediction of the residual beta cell function during the first two years of disease in children and adolescents with insulin-dependent diabetes mellitus. Med Hypotheses. 1995;45:486–490. doi: 10.1016/0306-9877(95)90228-7. [DOI] [PubMed] [Google Scholar]
- 30.Quince C, Lanzen A, Davenport RJ, Turnbaugh PJ. Removing noise from pyrosequenced amplicons. BMC Bioinformatics. 2011;12:38. doi: 10.1186/1471-2105-12-38. [DOI] [PMC free article] [PubMed] [Google Scholar]
- 31.Caporaso JG, et al. QIIME allows analysis of high-throughput community sequencing data. Nat Methods. 2010;7:335–336. doi: 10.1038/nmeth.f.303. [DOI] [PMC free article] [PubMed] [Google Scholar]
- 32.Schloss PD, et al. Introducing mothur: open-source, platform-independent, community-supported software for describing and comparing microbial communities. Appl Environ Microbiol. 2009;75:7537–7541. doi: 10.1128/AEM.01541-09. [DOI] [PMC free article] [PubMed] [Google Scholar]
- 33.DeSantis TZ, et al. Greengenes, a chimera-checked 16S rRNA gene database and workbench compatible with ARB. Appl Environ Microbiol. 2006;72:5069–5072. doi: 10.1128/AEM.03006-05. [DOI] [PMC free article] [PubMed] [Google Scholar]
- 34.Caporaso JG, et al. PyNAST: a flexible tool for aligning sequences to a template alignment. Bioinformatics. 2010;26:266–267. doi: 10.1093/bioinformatics/btp636. [DOI] [PMC free article] [PubMed] [Google Scholar]
- 35.Wang Q, Garrity GM, Tiedje JM, Cole JR. Naive Bayesian classifier for rapid assignment of rRNA sequences into the new bacterial taxonomy. Appl Environ Microbiol. 2007;73:5261–5267. doi: 10.1128/AEM.00062-07. [DOI] [PMC free article] [PubMed] [Google Scholar]
- 36.Segata N, et al. Metagenomic biomarker discovery and explanation. Genome Biol. 2011;12:R60. doi: 10.1186/gb-2011-12-6-r60. [DOI] [PMC free article] [PubMed] [Google Scholar]
- 37.Hothorn T, Bretz F, Westfall P. Simultaneous inference in general parametric models. Biom J. 2008;50:346–363. doi: 10.1002/bimj.200810425. [DOI] [PubMed] [Google Scholar]


