Abstract
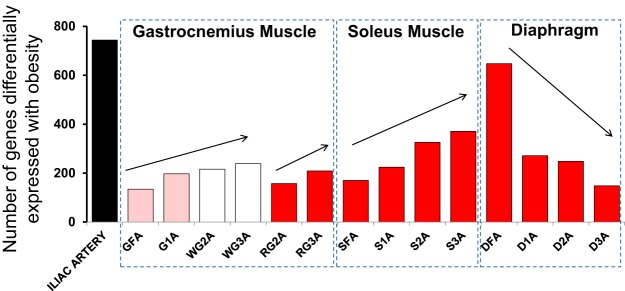
We used next-generation RNA sequencing (RNA-Seq) technology on the whole transcriptome to identify genes whose expression is consistently affected by obesity across multiple arteries. Specifically, we examined transcriptional profiles of the iliac artery as well as the feed artery, first, second, and third branch order arterioles in the soleus, gastrocnemius, and diaphragm muscles from obese Otsuka Long-Evans Tokushima Fatty (OLETF) and lean Long-Evans Tokushima Otsuka (LETO) rats. Within the gastrocnemius and soleus muscles, the number of genes differentially expressed with obesity tended to increase with increasing branch order arteriole number (i.e., decreasing size of the artery). This trend was opposite in the diaphragm. We found a total of 15 genes that were consistently upregulated with obesity (MIS18A, CTRB1, FAM151B, FOLR2, PXMP4, OAS1B, SREBF2, KLRA17, SLC25A44, SNX10, SLFN3, MEF2BNB, IRF7, RAD23A, LGALS3BP) and five genes that were consistently downregulated with obesity (C2, GOLGA7, RIN3, PCP4, CYP2E1). A small fraction (∼9%) of the genes affected by obesity was modulated across all arteries examined. In conclusion, the present study identifies a select number of genes (i.e., 20 genes) whose expression is consistently altered throughout the arterial network in response to obesity and provides further insight into the heterogeneous vascular effects of obesity. Although there is no known direct function of the majority of 20 genes related to vascular health, the obesity-associated upregulation of SREBF2, LGALS3BP, IRF7, and FOLR2 across all arteries is suggestive of an unfavorable vascular phenotypic alteration with obesity. These data may serve as an important resource for identifying novel therapeutic targets against obesity-related vascular complications.
Keywords: next-generation sequencing, gene expression, resistance arteries, vascular dysfunction, OLETF rat model, Type 2 diabetes
overnutrition and lack of physical activity are the major triggers of the obesity epidemic in United States and worldwide (8–10, 12, 39). Currently, one-third of Americans are obese (31), and according to projections this may reach 50% by 2030 (43). Obesity is an important contributor to the development of Type 2 diabetes and cardiovascular diseases (2, 15, 17, 44). Impairments in vascular function associated with obesity are attributable to concomitant systemic risk factors including hypertension, hyperlipidemia, hyperglycemia, hyperinsulinemia, inflammatory cytokines, and sympathetic overactivity (5, 20, 25, 27, 40, 41). Notably, there is evidence that obesity-related endothelial dysfunction and structural changes are not homogenous throughout the arterial tree. For example, studies using the hyperphagic Otsuka Long-Evans Tokushima Fatty (OLETF) rat model of obesity demonstrate that the soleus feed artery (SFA) is more resistant to impairments in vasomotor activity (6) as well as more resistant to increases in intima-media thickness (21) compared with the gastrocnemius feed artery (GFA). A possible explanation for the fundamental differences in vascular function and structure between the SFA and GFA may be related to differences in the fiber type of the perfused muscle and different recruitment patterns (3). Indeed, when the rat is standing, blood flow to the primarily slow-twitch, oxidative soleus muscle is two- to fourfold greater than that to the primarily fast-twitch, glycolytic gastrocnemius muscle (3). To better understand the molecular signature underlying vascular heterogeneity, we recently performed a transcriptome-wide RNA sequencing (RNA-Seq) analysis and compared the SFA and GFA in lean rats vs. obese OLETF rats (22). A striking finding in this analysis was that 78% of the obesity-altered gene transcripts in the SFA were not affected in the GFA (22). This remarkable heterogeneous transcriptional effect of obesity has also been demonstrated in other models of obesity. For example, we recently adopted a microarray analysis approach to determine the extent to which vascular gene expression is altered in a pig model of diet-induced obesity (33). We found that 85% of the genes altered with obesity in the left anterior descending coronary artery were not changed in the thoracic aorta (33). Together, these studies demonstrate that the vascular transcriptional and functional effects of obesity are not homogenous among arteries.
Here we turn our focus and seek to identify the portion of genes and molecular networks that are consistently affected by obesity across multiple arteries. Our rationale is that identification of genes whose expression is homogeneously modulated with obesity may enhance our understanding of systemic vascular effects of obesity and lead to novel therapeutic targets. Accordingly, we aim to extend our previous RNA-Seq work in the OLETF rat model (22) by evaluating the effect of obesity across 15 different arteries. Specifically, we examined the iliac artery as well as the feed artery, first, second, and third branch order arterioles in the soleus, gastrocnemius, and diaphragm muscles in obese OLETF rats compared with lean counterparts. We reasoned that the gene expression effects of obesity in the vasculature perfusing the diaphragm would display a transcriptional profile more similar to that found in the soleus, than the gastrocnemius, due to comparable fiber type compositions and levels of recruitment. In addition, based on our previous studies (22, 33), we hypothesized that a relatively small fraction (<20%) of the genes affected by obesity would be uniformly modulated across all arteries examined.
METHODS
Animals and experimental design.
Male OLETF (n = 12) and lean Long-Evans Tokushima Otsuka (LETO, n = 12) rats were obtained at age 4 wk (Japan SLC, Hamamatsu, Shizuoka, Japan). The OLETF rat, characterized by a mutated cholestokinin-1 receptor that results in a hyperphagic phenotype, is an established model of obesity, insulin resistance, and Type 2 diabetes mellitus (23). LETO and OLETF animals are from the original genetic background (23). Animals were individually housed in a temperature-controlled (21°C) environment with light from 0600 to 1800 and dark from 1800 to 0600. All animals were given ad libitum access to standard chow with a macronutrient composition of 56% carbohydrate, 17% fat, and 27% protein (Formulab 5008; Purina Mills, St Louis, MO). Rats were anesthetized at 30–32 wk of age with an intraperitoneal injection of pentobarbital sodium (50 mg/kg) between 0800 and 0930. Tissues were then harvested, and the animals were killed by exsanguination. Food was removed from the cages 12 h prior to death. All protocols were approved by the University of Missouri Animal Care and Use Committee.
Body weight, body composition, food intake, and blood parameters.
Body weights and food intakes were monitored and recorded on a weekly basis. Body composition was assessed by dual energy X-ray absorptiometry (Hologic QDR-1000, calibrated for rodents) on the day of death. Whole blood was collected on the day of euthanasia for analysis of glycosylated hemoglobin (HbA1c) by the boronate-affinity high-performance liquid chromatography method (Primus Diagnostics, Kansas City, MO) in the Diabetes Diagnostics Laboratory at the University of Missouri. Serum samples were prepared by centrifugation and stored at −80°C until analysis. Glucose, triglyceride (TG), and nonesterified fatty acid (NEFA) assays were performed by a commercial laboratory (Comparative Clinical Pathology Services, Columbia, MO) on an Olympus AU680 automated chemistry analyzer (Beckman-Coulter, Brea, CA) using commercially available assays according to manufacturers' guidelines. Plasma insulin concentrations were determined using a commercially available, rat-specific enzyme-linked immunosorbent assay (Alpco Diagnostics, Salem, NH). Samples were run in duplicate, and manufacturers' controls and calibrators were used according to assay instructions.
Isolation of arteries.
The iliac artery, the gastrocnemius-plantaris-soleus muscle complex, and diaphragm were harvested and pinned down in a Petri dish containing an RNA-stabilizing agent (RNAlater; Ambion, Austin, TX). A total of 15 arteries of interest were dissected clean of perivascular adipose tissue and excess adventitia under the microscope. The arteries were as follows: iliac artery, GFA, gastrocnemius first branch order arteriole (G1a), white gastrocnemius second branch order arteriole (WG2a), white gastrocnemius third branch order arteriole (WG3a), red gastrocnemius second branch order arteriole (RG2a), red gastrocnemius third branch order arteriole (RG3a), SFA, soleus first branch order arteriole (S1a), soleus second branch order arteriole (S2a), soleus third branch order arteriole (S3a), diaphragm feed artery (DFA), diaphragm first branch order arteriole (D1a), diaphragm second branch order arteriole (D2a), and diaphragm third branch order arteriole (D3a). Visible blood clots were gently removed from the lumen side of each vessel with forceps to minimize the contamination of blood cells into the sample. Except for the iliac artery, GFA, and DFA, ∼2–4 arteries were pooled within animal. Samples were kept in RNAlater for 48 h at 4°C and then removed from the RNAlater solution and stored at −80°C until analysis.
RNA extraction.
Total RNA isolations were performed by the NucleoMag 96 RNA kit procedure (Clontech part #744350.1), as described in detail previously (22, 32). All liquid handling was optimized for use on a Beckman3000 robotic liquid handler housed within a laminar flow hood (with UV decontamination) designed to ensure a clean room environment for working with microtissues that yield low (pg to ng) amounts of RNA. In brief, groups of 24 vessels were removed from the −80°C and immediately homogenized for 60–120 s in their own 2 ml microtube using the mini-bead beater 24 (Biospec Product) in the presence of NucleoMag lysis buffer and several miniature chrome-steel (RNase treated) BBs. Care was taken to get complete microvessel disruption without extending grinding times to prevent the generation of excess heat. The resulting homogenate was then loaded onto the robot deck, and a digital photo was taken prior to transferring sample into 96-well microplates. The photo allowed us to have a physical record of each sample ID prior to being loaded into the microplate for accurate tracking purposes. This process was repeated four times to completely fill a 96-well microplate within 10–20 min. The combination of using stabilized tissue and immediate homogenization in chaotropic salt-containing lysis buffer ensured the RNA was protected from RNase degradation during tissue disruption. Following homogenization, the RNA was bound to RNA beads in the presence of alcohol, and a magnet was used to perform several wash and elution steps in a completely automated fashion. This method included a DNase digestion step ultimately yielding RNA of similar yield and quality from column-based procedures. Immediately following RNA isolation, pure RNA was transferred to a new 96-well microplate, and a 5 μl aliquot was taken into a second plate for RNA quality control (QC). Both plates were stored at −80°C using cryogenic plate seals and placed in secondary containment to prevent frost build-up on the plates during storage. Because we studied mRNA levels from whole artery homogenates, it is unclear whether differences in gene expression reported in this study are originating from the endothelium, smooth muscle, or adventia.
RNA QC (concentration and integrity).
For assessing total RNA yield and integrity, we used tandem Agilent Bioanalyzer 2100 instruments in combination with the Total RNA 6000 Pico Assay. At the time of this study, the RNA Pico LabChip Kit was the only available platform to obtain unbiased assessment of RNA integrity (via RIN) and accurate results with extremely low RNA concentrations, such as those provided by microvessels. The qualitative range for the total RNA assay is 200–5,000 pg/μl, and the most important advantage of this system is the small amount of sample used (1 μl), leaving the rest of the RNA for other applications. Typical yields from rat microvessels were ∼500–1,000 pg/μl. RNA QC was performed using only the aliquot from each isolation plate.
Illumina library preparation (SMARTer amplification and RNA-Seq).
Due to the low yields of total RNA from microvessels, total RNA could not directly be used in traditional Illumina gene expression profiling methods (RNA-Seq). Thus, the SMARTer Ultra Low RNA Kit for Illumina Sequencing (Clontech, cat. #634935) was utilized for generating full-length cDNA transcripts prior to Illumina RNA-Seq library preparation. Briefly, the technology involves SMARTer first-strand cDNA synthesis and purification, utilizing the SMARTer anchor sequence and poly A sequence that serve as universal priming sites for end-to-end generation of single-stranded cDNA, followed by cDNA amplification with long-distance PCR (LD-PCR) using the manufacturer's recommended Advantage 2 PCR system (Clontech cat. #PT3281-1) containing a novel polymerase and ultrapure dNTPs specifically for Illumina sequencing. Using the concentration values from the Bioanalyzer RNA Pico Assay we sought to use 100–1,000 pg of total RNA as input to the SMARTer 1st cDNA reaction.
Following cDNA generation, validation was performed using the Bioanalyzer 2100 High Sensitivity DNA Assay (Agilent cat. #5067-4626) for select samples from each plate of 96 samples to accurately size and quantitate DNA up to 12 kb in length, again consuming minimal sample volumes (1 μl). After 14 cycles of LD-PCR amplification the final cDNA yields were estimated at ∼1–10 ng for each microvessel, which is a suitable input amount for library preparation for cDNA/ChIP Seq library preparation. To generate Illumina Paired-End RNA-Seq libraries, cDNA was fragmented to ∼200 bp using the Q700 DNA fragmentation system (QSonica) and then used directly with the NextFlex DNA preparation kit (Bioo Scientific, cat. #5140-02) with some modifications. Briefly, fragment cDNA was end repaired and purified with 1.8× SPRI beads to remove reaction components (Agencourt). The resulting blunt ends were A-tailed in preparation for cohesive ligation to the Illumina specific sequencing adapters diluted to 0.6 μM working concentration (NextFlex DNA Adapters, Bioo Scientific, cat. #514104). Ligated DNA was purified twice with 1.0× SPRI to remove adapter dimers and perform gel free size selection and then amplified through 14 cycles of PCR. The final sequencing construct was purified with a 1.0× SPRI to remove low-molecular-weight adapter dimer artifacts (if any), and libraries were validated to contain ∼330 bp fragments using the Bioanalyzer 2100 High Sensitivity DNA Assay. Library quantitation was performed using the Qubit 2.0 fluorimeter and the High Sensitivity DNA assay (Life Tech, cat. #Q32851).
RNA-Seq.
By utilizing 48 unique adapter indexes during library preparation across each plate of 96 libraries created, we were able to overcome several common technical mistakes. First, it allowed us to account for technical biases through randomization of samples by vessel type (group) and animal group across each plate of samples. Second, by having a priori knowledge of the sequencing index used to identify each sample from the sequencing, we were able use a single manufacturing lot of adapters that were uniformly diluted and preplated to ensure similar ligation efficiencies across several plates (hundreds of samples) used in the study. Third, this indexing scheme allowed us to standardize the pooling of several libraries by row within each plate, where equimolar volumes of each sample in a plate row were pooled to a final concentration of 5–10 nM. Altogether, this approach prevented inadvertent use of the wrong adapters during preparation, randomized the sample and index combinations, and precluded library mislabeling. The final pools (>50 total) were each loaded on a single lane of single read 50 base sequencing on the Illumina HiSeq2000 and ultimately yielded ∼175–200 million useable reads per lane (14–17 million reads per RNA-Seq sample). Note, the combination of the 48 adapters that resulted in four pools of 12 indexes was carefully designed and wet lab tested to be compatible with the HiSeq to ensure maximum sequence yields and to ensure that each sample was correctly identified by the HiSeq during the index identification steps.
Statistical analysis.
The analysis of the RNA-Seq data was carried out for all 15 arteries as described previously (22), with one minor methodological difference: nonspecific filtering of samples was based on mean counts per million, with the cutoff determined based on when the expression level of spike-ins at different concentrations began to converge. Adjustment to the P values was made to account for multiple testing using the false discovery rate (FDR) method of Benjamini and Hochberg (7). For all comparisons we chose 10% as our FDR threshold for statistical significance. As an empirical measure of the FDR, we evaluated what proportion of the identical ERCC probe/concentration combinations (“set B”) appeared in our list differentially expressed genes. Similarly, we looked at a set of 13 putative housekeeping genes derived from a study of >13,000 rat samples (14) to have another estimate of our FDR. The set of genes was: ACTB, B2M, GAPDH, GUSB, HPRT1, HMBS, HSP90B1, RPL13A, RPS29, RP1P0, PPIA, TBP, and TUBA1. For both of these sets of controls, we also estimated the fold change of each of the genes as a measure of the accuracy of the fold change estimates. Based on our list of differentially expressed genes across all 15 arteries, networks were generated through the use of Ingenuity Pathways Analysis (Ingenuity Systems, http://www.ingenuity.com), henceforth IPA, as previously described (22, 34). IPA networks were scored based on the number of Network Eligible Molecules (NEMs) they contained, so that the higher the score, the lower the probability of finding the observed number of NEMs in a given network by random chance. Specifically, the score is the negative log10 of the P value from Fisher's exact test applied to a given network. For example, a score of 9 for a network implies a one-in-a-billion chance of obtaining a network containing at least the same number of NEMs by chance when randomly picking 35 molecules from the Ingenuity Knowledge Base (IKB). For a detailed description of the network generating algorithm, readers are referred to Calvano et al. (11). Enrichment for canonical pathways, disease annotation, and gene ontology, were carried out using IPA and DAVID (with background of Rattus norvegicus). All tests were based on Fisher's exact test. In addition, we carried out Upstream Regulator Analysis in IPA in order to determine upstream molecules (i.e., regulators) in the causal network (IKB) that are connected to our set of reported genes through transcription or expression edges. Here, regulators may be transcription factors or any molecule (e.g., endogenous chemicals, drugs, microRNA) via indirect expression findings in the IKB. This is a two-step process that first tests for overlap between the regulators and the connected genes and the significant genes in the data set being analyzed (in our case this is the list of differentially expressed genes across all 15 arteries). This is carried out using Fisher's exact test. This is followed by an activation score, which is calculated based on the concordance of the predicted direction of the casual relationships, with each relationship weighted according to the degree of consensus on the literature and the number of reported findings they are based upon. Casual relationships with conflicting directions reported in the literature are naturally downweighted; findings based on several published reports are given more weight. The final score is reported in terms of z-scores (standard normal distribution). Finally, for the remaining data (i.e., non RNA-Seq) between-group differences for all descriptive variables were determined by using an independent t-test, for which statistical significance was declared at P ≤ 0.05.
RESULTS
The reader is referred to Jenkins et al. (22) for detailed description of animal characteristics including body composition, food intake (Fig. 1), and blood parameters. In short, compared with LETO rats, OLETF rats were significantly (all P < 0.05) heavier (685.5 ± 13.6 vs. 460.4 ± 15.4 g), fatter (31.6 ± 0.4 vs. 21.5 ± 0.3% fat), and exhibited greater total cholesterol (149.6 ± 7.1 vs. 95.3 ± 4.2 mg/dl), TG (371.1 ± 47.9 vs. 45.6 ± 4.5 mg/dl), insulin (8.4 ± 1.6 vs. 2.9 ± 0.4 ng/ml), glucose (303 ± 14.8 vs. 151 ± 5.8 mg/dl), and HbA1c levels (7.2 ± 0.4 vs. 5.0 ± 0.1%). For the subsequent group comparisons reported involving all 15 arteries, the average ERCC Spike-in (set B, n = 18 probes) empirical FDR was 0% at the nominal FDR cutoff of 10% (mean fold = 1.06), while for the putative housekeeping genes the average was 3.3% (mean fold = 0.992). When we ignored FDR, the observed type I error computed based on the spike-ins had a mean of 8.5% when we used α = 0.05. Although we planned a priori to use all 13 housekeeping genes as previously given, one of those (Tuba1) was not considered to be expressed in the data and was removed during the nonspecific filtering step. In their entirety, these findings strongly support the methodology used to identify differential expression because, on average, the fold changes for these controls are approximately equal to 1 and the empirical FDR is very low.
Fig. 1.
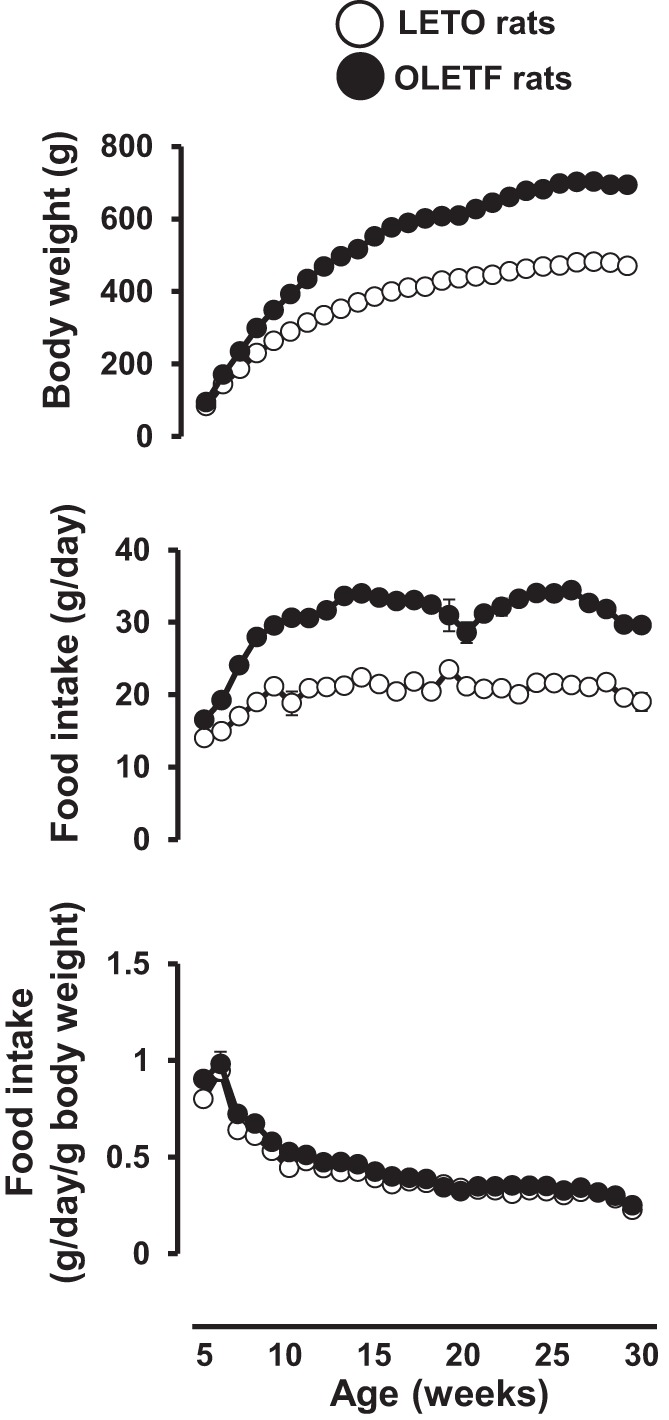
Body weight and food intake in Long-Evans Tokushima Otsuka (LETO) and Otsuka Long-Evans Tokushima Fatty (OLETF) rats throughout the course of the study. Values are expressed as means ± SE.
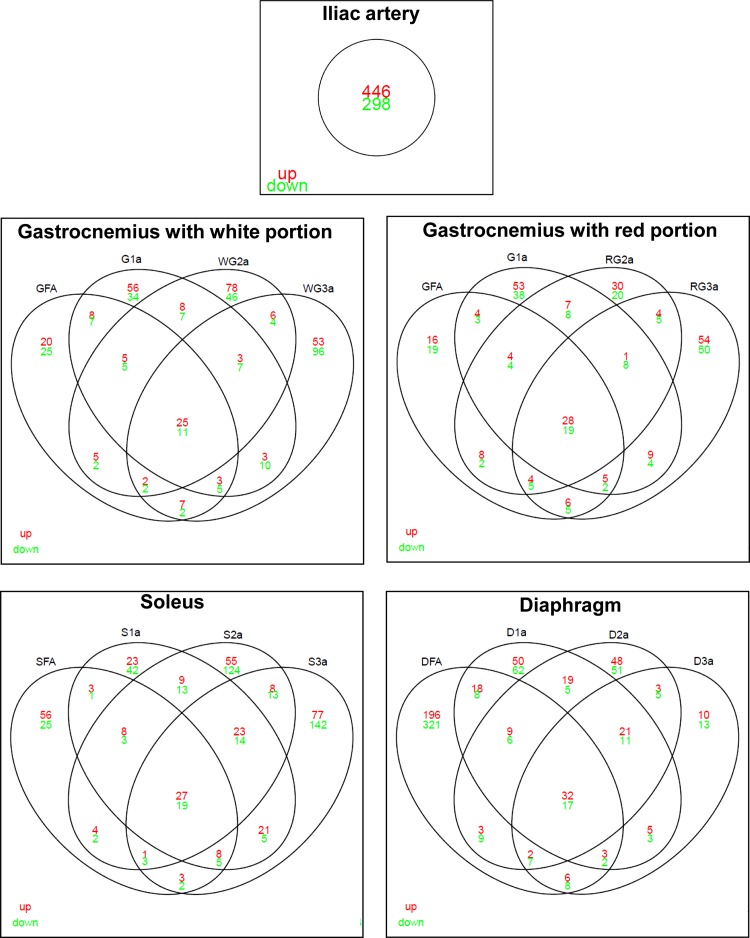
A full list of differentially expressed genes between LETO and OLETF rats for all 15 arteries is provided in Supplemental Dataset 1.1 In addition, Fig. 2 displays the number of genes altered with obesity across all 15 arteries. The greatest number of differentially expressed genes with obesity was found in the iliac artery (446 genes upregulated and 298 genes downregulated). Within the gastrocnemius and soleus muscles, the number of genes differentially expressed with obesity tended to increase with increasing branch order arteriole number (i.e., decreasing size). In contrast, within the diaphragm, the number of genes differentially expressed with obesity tended to decrease with increasing branch order. Using Venn diagrams, Fig. 3 summarizes the number of genes upregulated and downregulated with obesity across arteries and the intersections within muscle. The greatest amount of overlapping effects of obesity within a muscle occurred in the diaphragm with 49 genes (32 upregulated, 17 downregulated). An interesting observation from these data is that the greatest number of genes whose expression is uniquely altered with obesity (i.e., lack of intersection among arteries) occurs in the third order arteriole for gastrocnemius and soleus muscles. However, for the diaphragm circulation, the greatest number of genes whose expression is uniquely altered occurs in the feed artery.
Fig. 2.
Number of genes significantly altered by obesity in each of the 15 arteries. GFA, gastrocnemius feed artery; G1A, gastrocnemius 1st branch order arteriole; WG2A, white gastrocnemius 2nd branch order arteriole; WG3A, white gastrocnemius 3rd branch order arteriole; RG2A, red gastrocnemius 2nd branch order arteriole; RG3A, red gastrocnemius 3rd branch order arteriole; SFA, soleus feed artery; S1A, soleus 1st branch order arteriole; S2A, soleus 2nd branch order arteriole; S3A, soleus 3rd branch order arteriole; DFA, diaphragm feed artery; D1A, diaphragm 1st branch order arteriole; D2A, diaphragm 2nd branch order arteriole; D3A, diaphragm 3rd branch order arteriole.
Fig. 3.
Venn diagram illustrating number of genes significantly upregulated (red) and downregulated (green) by obesity in each of the 15 arteries organized by muscle. This figure illustrates the overlapping vascular effects of obesity within each muscle. Overlap of the circles of 2 arteries indicates arteries that had the same altered gene expression. Thus, the center overlap contains a subset of genes whose expression was changed in all arteries of that muscle/artery. For example, in the gastrocnemius with white portion there were 25 genes whose expression was upregulated and 11 genes whose expression was downregulated in all arteries/arterioles sampled from this muscle. The total number of genes interrogated was 10,447.
Figures 2 and 3 combined illustrate the marked heterogeneity effects of obesity on gene expression across the arterial network. It is also noted that the obesity effects in the diaphragm are distinctly different from the effects observed in the gastrocnemius and soleus circulations. We hypothesized that the gene expression effects of obesity in the vasculature perfusing the diaphragm would display a transcriptional profile more similar to that found in the soleus, vs. gastrocnemius, due to comparable fiber type compositions and activity of the muscle. Contrary to this hypothesis, we found a similar amount of overlap between the obesity effects produced in the soleus vs. diaphragm circulations (overlap of 27 genes) and the gastrocnemius vs. diaphragm circulations (overlap of 23 genes). Four genes that were modulated with obesity in the vasculature perfusing the hindlimb skeletal muscles, but not in the vasculature perfusing the diaphragm, were ANKRD29, AOX1, PLS1, and RTP4. Conversely, there were 29 genes that were modulated with obesity in the vasculature perfusing the diaphragm, but not in the vasculature perfusing the hindlimb skeletal muscles.
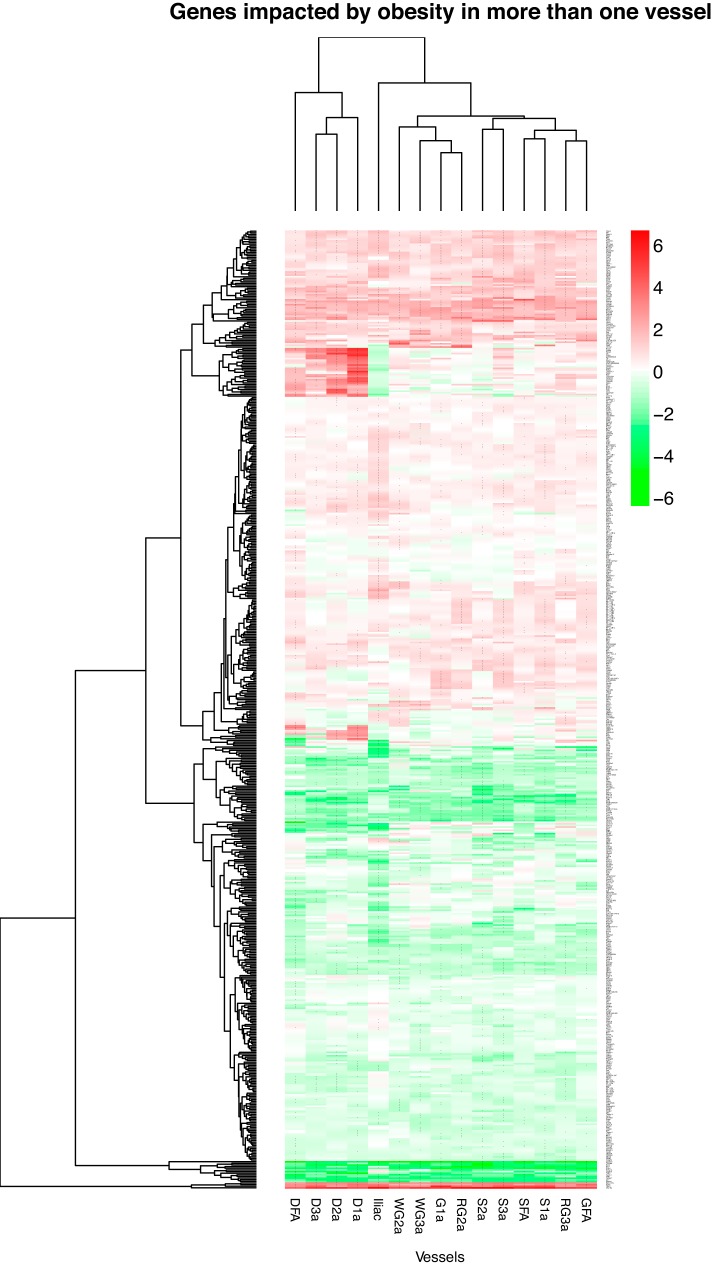
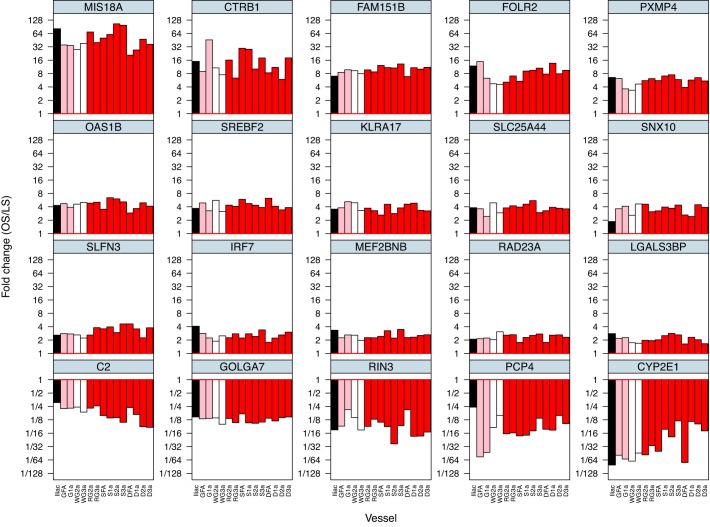
Figure 4 illustrates the number of genes affected by obesity (in the same direction) in any one artery (2297 genes), any two arteries or more (587 genes), etc., out of the 15 arteries examined. As noted, there is an exponential decline in the number of genes affected by obesity as the level of stringency increases (from any one artery out of the 15 arteries to 15 arteries out the 15 arteries). There were 36 genes affected by obesity in any 13 arteries or more out of the 15 arteries (Supplemental Dataset 2). There were 26 genes affected by obesity in any 14 arteries or more out the 15 arteries (Supplemental Dataset 3). There were 20 genes affected by obesity in all 15 arteries. The list of 587 genes affected in any two arteries or more out of the 15 arteries is presented in Fig. 5. In this heat-map the reader can appreciate the pattern of differences in gene expression between lean and obese rats (magnitude and direction) across all 15 arteries. A heat-map with all 2,297 genes affected by obesity in any one artery is not shown because the size of the figure impeded its legibility. Figure 6 shows the list and expression levels of the 20 genes (15 upregulated, 5 downregulated) that were altered with obesity in all 15 arteries. As noted, the direction of change in gene expression, but not the magnitude, was the same among all arteries. In addition, we examined the top Ingenuity Canonical Pathways and top Diseases/Functions Annotation produced by IPA using the list of 20 differentially expressed genes (Supplemental Dataset 4). DAVID analyses were also carried out, but no gene ontology terms or Kyoto Encyclopedia of Genes and Genomes pathways were significant.
Fig. 4.
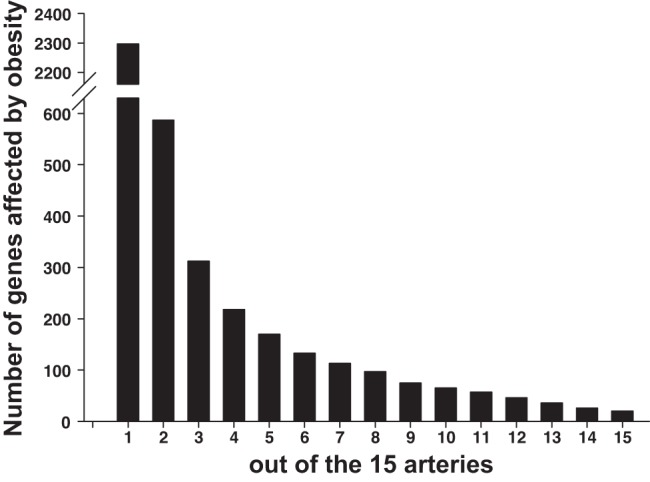
Number of genes significantly affected by obesity (in the same direction) in any 1 artery or more out of the 15 arteries (2,297 genes, most left) to number of genes affected by obesity in all 15 arteries (20 genes, most right). As noted, there is an exponential decline in the number of genes affected by obesity as the level of stringency increases.
Fig. 5.
Heat-map of 587 genes significantly affected by obesity in >1 artery out of the 15 arteries. Shading is in proportion to the size of the fold difference (red, upregulation; green, downregulation; log2 fold difference). Rows are genes and columns are vessels. Zoom-in function is needed to discern the name of the genes. *Fold changes (OS/LS) that were significant at false discovery rate < 0.10.
Fig. 6.
List of 20 genes whose expression is significantly altered by obesity across all 15 arteries. Values are expressed as mean fold difference in base 2 log scale.
As summarized in Fig. 7, we also sought to evaluate the gene expression effects of obesity according to vessel size. Beyond the 20 genes affected by obesity among all 15 arteries, there were 15 additional genes that were affected among all larger vessels and seven additional genes that were affected among all smaller vessels. We performed functional analyses on the genes consistently altered by obesity in the large and small vessels (i.e., the lists in Fig. 7). For small vessels, no biological processes were statistically significant. For large vessels, the two biological processes that were statistically significant were “Response to wounding” (molecules involved: MST1, CCL5, TM4SF4) and “Immune response” (molecules involved: OAS1I, RT1-CE14, CCL5). The lack of more significant biological functions is likely due to the short lists (i.e., 7 genes for small vessels and 15 genes for large vessels) entered into the analysis.
Fig. 7.
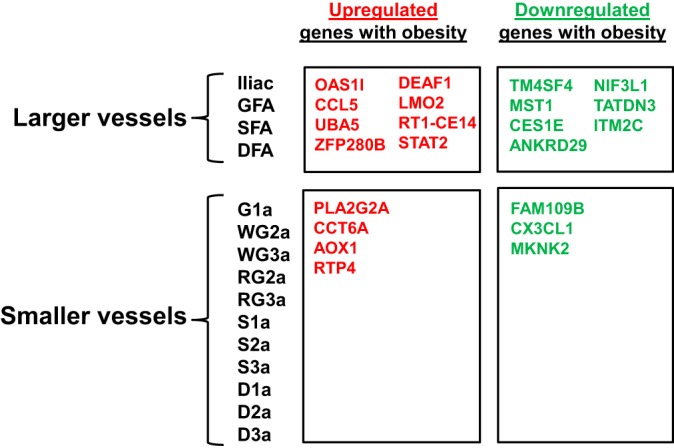
Genes whose expression is significantly altered by obesity in larger vs. smaller arteries. Beyond the 20 genes affected by obesity among all 15 arteries (Fig. 6), there were 15 additional genes that were affected among all larger vessels and 7 additional genes that were affected among all smaller vessels.
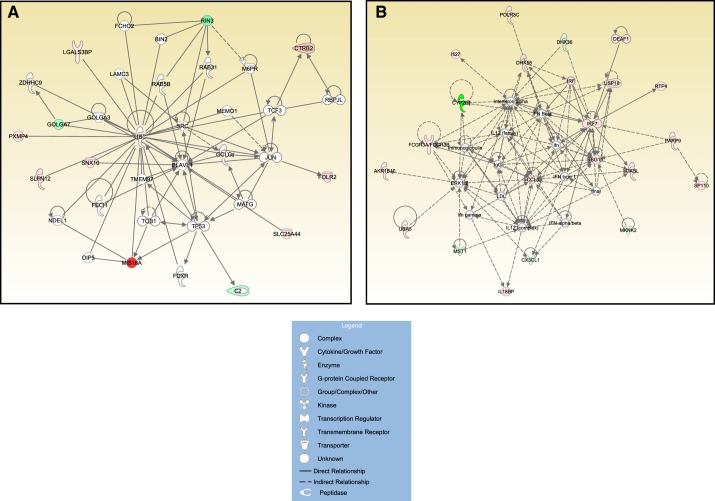
Figure 8A illustrates the top gene network generated by IPA based on the list of 20 genes consistently affected by obesity across all 15 arteries. The score of this gene networks was 28. Although this score may be deemed low, such a judgment is made on the basis of considering networks constructed using a much larger set of input genes (typically >100) than the small set of 20 genes used here. Indeed, it is quite remarkable that any substantial networks could be generated from a modest set of genes. For contrast, in Fig. 8B, we illustrate the top gene network generated by IPA based on a list of 97 genes (Supplemental Dataset 5) that corresponds to the number of genes altered with obesity in eight or more arteries out of the 15 arteries examined (Fig. 4). The score of this gene network was 44.
Fig. 8.
A: top significant Ingenuity Pathway Analysis (IPA) gene network using the 20 genes consistently affected by obesity across all 15 arteries (score 28). B: top significant IPA gene network using a list of 97 genes that corresponds to the number of genes affected by obesity in 8 or more arteries out of the 15 arteries (score 44). Solid and dotted lines denote direct and indirect relationships, respectively, between genes/molecules.
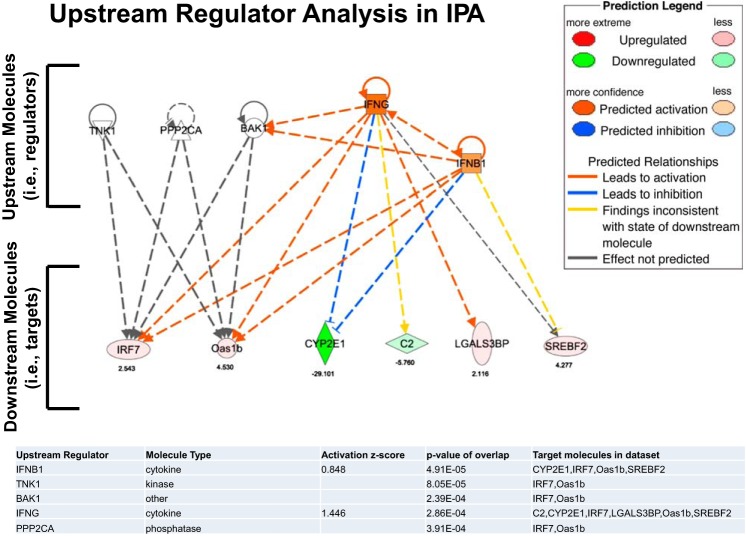
Figure 9 shows the results of the Upstream Regulator Analysis in IPA including overlapping P values (P < .001) for each of the top five regulators, along with the number of downstream targets in our data set. Activation scores are only given for regulators that overlap with more than two genes in our data set. Based on these findings, the diagram presented in Fig. 9 was constructed to illustrate the relationship between the top five regulators and their targets.
Fig. 9.
Diagram summarizing the results obtained by Upstream Regulator Analysis in IPA. This analysis identifies upstream molecules (i.e., regulators) that are causally connected to a subset of genes (i.e., downstream molecules or targets) consistently affected by obesity across all 15 arteries. Data are presented for the top 5 regulators. Values below the symbols indicate fold difference.
DISCUSSION
Using the OLETF rat model, we evaluated the impact of hyperphagia-induced obesity and related metabolic complications on arterial vascular gene expression profiles. In particular, RNA-Seq analysis was performed on the iliac artery as well as the feed artery, first, second, and third branch order arterioles of the soleus, gastrocnemius, and diaphragm muscles in lean and obese rats. We took a holistic approach to examine the effects of obesity associated with excess nutrient intake on the entire transcriptome from a variety of arteries instead of focusing on expression of a targeted set of genes from a single vessel. The artery with greatest number of differentially expressed genes with obesity was the iliac artery (446 genes upregulated, 298 genes downregulated). This high number of altered genes in the iliac artery, relative to downstream skeletal muscle feed arteries and arterioles, is perplexing and requires further investigation to elucidate the mechanisms. In the gastrocnemius and soleus muscles, the number of genes differentially expressed in the resistance arteries was increased with increasing artery branch order number; however, the reverse was true in the diaphragm. Notably, we identified 2,297 genes whose expression was significantly altered with obesity in any one artery out of the 15 arteries examined and 20 genes whose expression was significantly altered with obesity across all 15 arteries (Fig. 4). A small fraction (∼9%) of the genes affected by obesity was consistently modulated across all arteries examined. Alteration in the expression of a number of these genes is suggestive of a of an unfavorable vascular phenotypic alteration with obesity.
The concept that systemic cardiovascular risk factors, such as obesity, produce heterogeneous effects on the vasculature has been gaining recognition. For example, current data indicate that overweight women exhibit impaired flow-mediated dilation in the femoral, but not brachial, artery (4). Animal data also demonstrate that obesity-mediated changes in vascular function (6) and structure (21) are artery-specific. At the transcriptional level, recent studies also support the idea that the effects of obesity are not homogeneous throughout the arterial tree, independent of the animal model (22, 33).
The focus of the present study was to identify the genes whose expression was homogenously modulated with obesity across all arteries evaluated. Identification of genes whose expression was altered in all arteries in response to obesity may enhance our understanding of systemic vascular effects of obesity and possibly lead to novel therapies. Although the majority of differentially expressed genes uniformly altered across all 15 arteries have no identified function in the vasculature, some of these genes seem relevant for modulating arterial health, including SREBF2, LGALS3BP, IRF7, FOLR2, and CYP2E1.
The sterol regulatory element binding transcription factor 2 (SREBF2) gene codes for sterol regulatory element binding protein 2 (SREBP2), which is the master nuclear transcription factor that regulates genes involved in cellular cholesterol biosynthesis, uptake, and excretion (29, 30). Abnormally elevated SREBP2-dependent de novo lipogenesis contributes to the development of hepatic steatosis in insulin resistance (18, 26, 36). Indeed, the function of SREBP2 on lipid homeostasis, as well as its dysregulation in fatty liver disease and obesity, has been well described (16, 18). Hepatic SREBP2 upregulation parallels the severity of liver disease in animal models and humans (29). Given that nonalcoholic fatty liver disease and atherosclerotic lesions in humans have shared pathological traits, such as the deposition of excess lipids in the liver or on the vascular wall, the role of SREBP2 in modulating vascular function has also been recently explored (26). Current data provide evidence of increased expression of SREBP2 in atherosclerotic lesions from diabetic pigs and humans (26). The current understanding is that upregulation of SREBP2 can lead to stimulation of NLRP3 inflammasome and contribute to vascular lipid deposition and inflammation in atherosclerosis (1, 26, 45). In this regard, recent data from in vitro and in vivo approaches indicate that the atheroprone flow-induced endothelial inflammation and oxidative stress are mediated through SREBP2-elicited NLRP3 inflammasome (45). Also of interest is the finding in humans that polymorphisms of SREBF2 might be genetic factors involved in the pathogenesis of vascular dementia (24). These observations together with our finding that obesity is overtly associated with increased expression of SREBF2 throughout the arterial tree stimulates the possibility that SREBP2 may be a target of interest for preventing or treating obesity-related vascular disease.
We also found increased expression of LGALS3BP across all vessels examined. LGALS3BP encodes galectin-3-binding protein (Gal-3BP). Gal-3BP is a widely expressed and secreted glycoprotein that belongs to the galectin family of beta-galactoside-binding proteins. It binds to galectins, beta 1-integrins, collagens, and fibronectin and is implicated in modulating cell-cell and cell-extracellular matrix adhesion. It was originally identified in the supernatant of human breast cancer cells. In a recent study, it was found that Gal-3BP is produced from proinflammatory (M1), but not anti-inflammatory (M2), human macrophages (38). Importantly, this study demonstrated that plasma levels of Gal-3BP were significantly associated with increased carotid artery disease and stiffness in human patients (38). These findings combined with our observation that LGALS3BP expression was increased with obesity in all 15 arteries examined suggest that the assessment of Gal-3BP has potential predictive or diagnostic value with respect to vascular health.
In addition, we found that vascular expression of interferon regulatory factor 7 (IRF7) is uniformly increased in all 15 arteries with obesity. IRF7 is a member of the interferon regulatory transcription factor (IRF) family that has been shown to play a role in the transcriptional activation of virus-inducible cellular genes, including the type I interferon genes. Constitutive expression of IRF7 is largely specific to lymphoid tissue and plasmacytoid dendritic cells, whereas IRF7 is inducible in many tissues including the vascular wall, as shown here. Although endothelial cell culture studies show that viral infection upregulate IRF7 (13), to our knowledge the present study is the first to provide evidence that obesity leads to increased vascular expression of IRF7. This finding seems important given a recent report indicating that IRF7 deficiency prevents diet-induced obesity and insulin resistance (42). Wang et al. (42) demonstrated that IRF7 expression is increased in white adipose tissue, liver, and skeletal muscle of both diet-induced obese mice and ob/ob mice compared with lean counterparts. After eating a high-fat diet, IRF7 knockout mice had less weight gain and adiposity as well as improved insulin sensitivity (42). Notably, IRF7 knockout mice exhibited less macrophage infiltration into multiple organs and were protected from local and systemic inflammation (42). From this study it was concluded that IRF7 is involved in the etiology of obesity and metabolic abnormalities, thus presenting a potential target for treating obesity and Type 2 diabetes. Evaluating whether vascular-specific downregulation of IRF7 confers arterial protection in the setting of obesity and Type 2 diabetes seems a next logical step for future research in this area.
We also showed that obesity was associated with increased vascular expression of folate receptor 2 (FOLR2), which is a member of the folate receptor (FOLR) family. FOLR2 is a glycoprotein that is anchored to the membrane via glycosyl phosphatidylinositol. It mediates the cellular uptake of dietary folates that are required for key steps in amino acid metabolism. FOLR2 is predominantly expressed in placenta, myeloid cells, and some CD34+ hematopoietic progenitor cells. It is upregulated on some cancer cells and at sites of chronic inflammation including atherosclerotic lesions. Indeed, FOLR2 is upregulated on activated macrophages in atherosclerotic plaques (19, 28). Recent data demonstrate increased mRNA and protein expression of FOLR2 in atherosclerotic lesions compared with normal artery walls from humans (28). In addition, FOLR2-positive cells colocalize with activated macrophages (CD68) in plaque tissue (28). Interestingly, it has been proposed that selectively targeting FOLR2-positive macrophages through folate-based radiopharmaceuticals may be useful for noninvasive imaging of vascular inflammation (19, 28). Our finding is significant in that we show increased vascular expression of FOLR2 with obesity in the absence of atherosclerotic lesions.
Among the five genes downregulated with obesity across all arteries is CYP2E1, which encodes a member of the cytochrome P450 superfamily of enzymes. The cytochrome P450 proteins are mono-oxygenases that catalyze many reactions involved in drug metabolism and synthesis of cholesterol, steroids, and other lipids. Our finding that vascular expression of CYP2E1 was reduced with obesity can be interpreted in light of findings from others demonstrating that CYP2E1 is expressed in liver peroxisomes and downregulated with ischemia/reperfusion (35). Also relevant is the study by Zhang et al. (46) concluding that increased sensitivity to phenylephrine in arteries of spontaneously hypertensive rats is attributable to a vasoregulatory imbalance produced by a deficit in vascular CYP2E1-derived products. On the other hand, a recent study demonstrated increased CYP2E1 expression in the aorta of streptozotocin-induced diabetic mice (model of Type 1 diabetes), which was associated with impaired vasomotor function (37). Thus, it appears that the modulation of CYP2E1 expression is largely dependent on the disease model.
In conclusion, based on a whole transcriptome analysis, the present study identified 20 genes whose expression was consistently altered throughout the arterial network in response to obesity in the OLETF rat model (Fig. 6), which represents a ∼9% overlapping effect of obesity among all arteries examined. This list included the upregulation of SREBF2, LGALS3BP, IRF7, and FOLR2, which all may contribute to an unfavorable vascular phenotypic switch induced by obesity. Our Upstream Regulator Analysis using IPA reveals five molecules (i.e., TNK1, PPP2CA, BAK1, IFNG, and IFNB1) that regulate a number of downstream targets included in the list of 20 genes consistently altered with obesity throughout the vasculature (i.e., IRF7, OAS1B, CYP2E1, C2, LGALS3BP, and SREBF2) (Fig. 9). These upstream molecules may be viewed as regulators of vascular gene expression in response to obesity. Given our breadth in the vascular assessment (i.e., 15 arteries were examined), these data (Supplemental Dataset 1) are an important resource for identifying genes that may be mechanistically linked to obesity-associated systemic vascular complications. Future research should examine the interaction between genetic background differences and obesity in the regulation of vascular gene expression. For example, it is unknown if inherent differences in vascular gene expression are present in obesity prone vs. resistant animals (i.e., before the animals become obese). In addition, further research is also needed to evaluate whether expression of obesity-responsive genes is modulated with pharmacological and/or nonpharmacological (e.g., exercise) interventions.
GRANTS
This work was supported by National Institutes of Health (NIH) Grants RO1HL-036088 (M. H. Laughlin and J. W. Davis), T32-AR-048523 (N. T. Jenkins and J. S. Martin), and VHA-CDA2 1299-02 (R. S. Rector). J. Padilla is supported by the American Heart Association Grant 14SDG20320006. This work was also supported in part with resources and the use of facilities at the Harry S Truman Memorial Veterans Hospital in Columbia, MO.
DISCLOSURES
No conflicts of interest, financial or otherwise, are declared by the author(s).
AUTHOR CONTRIBUTIONS
Author contributions: J.P., N.T.J., R.S.R., J.W.D., and M.H.L. conception and design of research; J.P., N.T.J., P.K.T., J.S.M., J.W.D., and M.H.L. performed experiments; J.P. and J.W.D. analyzed data; J.P., N.T.J., J.S.M., R.S.R., J.W.D., and M.H.L. interpreted results of experiments; J.P. and J.W.D. prepared figures; J.P. drafted manuscript; J.P., N.T.J., P.K.T., J.S.M., J.W.D., and M.H.L. edited and revised manuscript; J.P., N.T.J., P.K.T., J.S.M., R.S.R., J.W.D., and M.H.L. approved final version of manuscript.
Supplementary Material
ACKNOWLEDGMENTS
We thank Nicholas Fleming, Eric Gibson, Kelcie Tacchi, and Matt Brielmaier for assisting in the care of the rats. Sean Blake (Global Biologics, LLC) performed the RNA extractions and generated the RNA libraries that were submitted to the University of Missouri DNA Core Facility for high-throughput sequencing services.
Footnotes
The online version of this article contains supplemental material.
REFERENCES
- 1.Abe Ji, Berk BC. Atheroprone flow activation of the sterol regulatory element binding protein 2 and nod-like receptor protein 3 inflammasome mediates focal atherosclerosis. Circulation 128: 579–582, 2013. [DOI] [PMC free article] [PubMed] [Google Scholar]
- 2.Alberti KGMM, Eckel RH, Grundy SM, Zimmet PZ, Cleeman JI, Donato KA, Fruchart JC, James WPT, Loria CM, Smith SC. Harmonizing the metabolic syndrome: a joint interim statement of the International Diabetes Federation Task Force on Epidemiology and Prevention; National Heart, Lung, and Blood Institute; American Heart Association; World Heart Federation; International Atherosclerosis Society; and International Association for the Study of Obesity. Circulation 120: 1640–1645, 2009. [DOI] [PubMed] [Google Scholar]
- 3.Armstrong RB, Laughlin MH. Blood flows within and among rat muscles as a function of time during high speed treadmill exercise. J Physiol 344: 189–208, 1983. [DOI] [PMC free article] [PubMed] [Google Scholar]
- 4.Barlow M, Restaino R. Limb specific comparison of flow-mediated dilation in overweight, pre-menopausal women. FASEB J 28: 2014. [Google Scholar]
- 5.Bastien M, Poirier P, Lemieux I, Després JP. Overview of epidemiology and contribution of obesity to cardiovascular disease. Prog Cardiovasc Dis 56: 369–381, 2014. [DOI] [PubMed] [Google Scholar]
- 6.Bender SB, Newcomer SC, Laughlin MH. Differential vulnerability of skeletal muscle feed arteries to dysfunction in insulin resistance: impact of fiber type and daily activity. Am J Physiol Heart Circ Physiol 300: H1434–H1441, 2011. [DOI] [PMC free article] [PubMed] [Google Scholar]
- 7.Benjamini Y, Hochberg Y. Controlling the false discovery rate: a practical and powerful approach to multiple testing. J Roy Stat Soc B 57: 289–300, 1995. [Google Scholar]
- 8.Booth FW, Laye MJ, Lees SJ, Rector RS, Thyfault JP. Reduced physical activity and risk of chronic disease: the biology behind the consequences. Eur J Appl Physiol 102: 381–390, 2008. [DOI] [PubMed] [Google Scholar]
- 9.Booth FW, Lees SJ. Fundamental questions about genes, inactivity, and chronic diseases. Physiol Genomics 28: 146–157, 2007. [DOI] [PubMed] [Google Scholar]
- 10.Booth FW, Roberts CK, Laye MJ. Lack of exercise is a major cause of chronic disease. Compreh Physiol 2: 1143–1211, 2012. [DOI] [PMC free article] [PubMed] [Google Scholar]
- 11.Calvano SE, Xiao W, Richards DR, Felciano RM, Baker HV, Cho RJ, Chen RO, Brownstein BH, Cobb JP, Tschoeke SK, Miller-Graziano C, Moldawer LL, Mindrinos MN, Davis RW, Tompkins RG, Lowry SF. A network-based analysis of systemic inflammation in humans. Nature 437: 1032–1037, 2005. [DOI] [PubMed] [Google Scholar]
- 12.Chakravarthy MV, Booth FW. Eating, exercise, and “thrifty” genotypes: connecting the dots toward an evolutionary understanding of modern chronic diseases. J Appl Physiol 96: 3–10, 2004. [DOI] [PubMed] [Google Scholar]
- 13.Colonne PM, Eremeeva ME, Sahni SK. Beta interferon-mediated activation of signal transducer and activator of transcription protein 1 interferes with rickettsia conorii replication in human endothelial cells. Infect Immun 79: 3733–3743, 2011. [DOI] [PMC free article] [PubMed] [Google Scholar]
- 14.de Jonge H, Fehrmann R, de Bont E, Hofstra R, Gerbens F, Kramps W, de Vries E, van der Zee A, te Meerman G, ter Elst A. Evidence based selection of housekeeping genes. PLoS One 2: e898, 2007. [DOI] [PMC free article] [PubMed] [Google Scholar]
- 15.Despres J. Intra-abdominal obesity: an untreated risk factor for Type 2 diabetes and cardiovascular disease. J Endocrinol Invest 29: 77–82, 2006. [PubMed] [Google Scholar]
- 16.Goldstein JL, Brown MS. From fatty streak to fatty liver: 33 years of joint publications in the JCI. J Clin Invest 118: 1220–1222, 2008. [DOI] [PMC free article] [PubMed] [Google Scholar]
- 17.Goran M, Ball G, Cruz M. Obesity and risk of Type 2 diabetes and cardiovascular disease in children and adolescents. J Clin Endocrinol Metab 88: 1417–1427, 2003. [DOI] [PubMed] [Google Scholar]
- 18.Horton JD, Goldstein JL, Brown MS. SREBPs: activators of the complete program of cholesterol and fatty acid synthesis in the liver. J Clin Invest 109: 1125–1131, 2002. [DOI] [PMC free article] [PubMed] [Google Scholar]
- 19.Jager NA, Teteloshvili N, Zeebregts CJ, Westra J, Bijl M. Macrophage folate receptor-β (FR-β) expression in auto-immune inflammatory rheumatic diseases: a forthcoming marker for cardiovascular risk? Autoimmun Rev 11: 621–626, 2012. [DOI] [PubMed] [Google Scholar]
- 20.Jahangir E, De Schutter A, Lavie CJ. The relationship between obesity and coronary artery disease. Transl Res [Epub ahead of print]. [DOI] [PubMed] [Google Scholar]
- 21.Jenkins NT, Padilla J, Martin JS, Crissey JM, Thyfault JP, Rector R, Laughlin M. Differential vasomotor effects of insulin on gastrocnemius and soleus feed arteries in the OLETF rat model: role of endothelin-1. Exp Physiol 99: 262–271, 2014. [DOI] [PMC free article] [PubMed] [Google Scholar]
- 22.Jenkins NT, Padilla J, Thorne P, Martin J, Rector R, Davis J, Laughlin M. Transcriptome-wide RNA sequencing analysis of rat skeletal muscle feed arteries. I. Impact of obesity. J Appl Physiol 116: 1017–1032, 2014. [DOI] [PMC free article] [PubMed] [Google Scholar]
- 23.Kawano K, Hirashima T, Mori S, Saitoh Y, Kurosumi M, Natori T. Spontaneous long-term hyperglycemic rat with diabetic complications. Otsuka Long-Evans Tokushima Fatty (OLETF) strain. Diabetes 41: 1422–1428, 1992. [DOI] [PubMed] [Google Scholar]
- 24.Kim Y, Nam YJ, Lee C. Analysis of the SREBF2 gene as a genetic risk factor for vascular dementia. Am J Med Genet B Neuropsychiatr Genet 139B: 19–22, 2005. [DOI] [PubMed] [Google Scholar]
- 25.Lambert E, Straznicky N, Lambert G. A sympathetic view of human obesity. Clin Auton Res 23: 9–14, 2013. [DOI] [PubMed] [Google Scholar]
- 26.Li Y, Xu S, Jiang B, Cohen RA, Zang M. Activation of sterol regulatory element binding protein and NLRP3 inflammasome in atherosclerotic lesion development in diabetic pigs. PLoS One 8: e67532, 2013. [DOI] [PMC free article] [PubMed] [Google Scholar]
- 27.Morioka T, Emoto M, Yamazaki Y, Kawano N, Imamura S, Numaguchi R, Urata H, Motoyama K, Mori K, Fukumoto S, Koyama H, Shoji T, Inaba M. Leptin is associated with vascular endothelial function in overweight patients with type 2 diabetes. Cardiovas Diabetol 13: 10, 2014. [DOI] [PMC free article] [PubMed] [Google Scholar]
- 28.Muller A, Beck K, Rancic Z, Muller C, Fischer C, Betzel T, Kaufmann P, Schibli R, Kramer S, Ametamey S. Imaging atherosclerotic plaque inflammation via folate receptor targeting using a novel 18F-folate radiotracer. Mol Imaging 13: 1–11, 2014. [PubMed] [Google Scholar]
- 29.Musso G, Cassader M, Bo S, De Michieli F, Gambino R. Sterol regulatory element-binding factor 2 (SREBF-2) predicts 7-year NAFLD incidence and severity of liver disease and lipoprotein and glucose dysmetabolism. Diabetes 62: 1109–1120, 2013. [DOI] [PMC free article] [PubMed] [Google Scholar]
- 30.Musso G, Gambino R, Cassader M. Cholesterol metabolism and the pathogenesis of non-alcoholic steatohepatitis. Prog Lipid Res 52: 175–191, 2013. [DOI] [PubMed] [Google Scholar]
- 31.Ogden CL, Carroll MD, Curtin LR, Lamb MM, Flegal KM. Prevalence of high body mass index in U.S. children and adolescents, 2007–2008. JAMA 303: 242–249, 2010. [DOI] [PubMed] [Google Scholar]
- 32.Padilla J, Jenkins N, Thorne P, Martin J, Rector R, Davis J, Laughlin M. Transcriptome-wide RNA sequencing analysis of rat skeletal muscle feed arteries. II. Impact of exercise training in obesity. J Appl Physiol 116: 1033–1047, 2014. [DOI] [PMC free article] [PubMed] [Google Scholar]
- 33.Padilla J, Jenkins NT, Lee S, Zhang H, Cui J, Zuidema MY, Zhang C, Hill MA, Perfield JW, 2nd, Ibdah JA, Booth FW, Davis JW, Laughlin MH, Rector RS. Vascular transcriptional alterations produced by juvenile obesity in Ossabaw swine. Physiol Genomics 45: 434–446, 2013. [DOI] [PMC free article] [PubMed] [Google Scholar]
- 34.Padilla J, Simmons GH, Davis JW, Whyte JJ, Zderic TW, Hamilton MT, Bowles DK, Laughlin MH. Impact of exercise training on endothelial transcriptional profiles in healthy swine: a genome-wide microarray analysis. Am J Physiol Heart Circ Physiol 301: H555–H564, 2011. [DOI] [PMC free article] [PubMed] [Google Scholar]
- 35.Pahan K, Smith BT, Singh AK, Singh I. Cytochrome P-450 2E1 in rat liver peroxisomes: downregulation by ischemia/reperfusion-induced oxidative stress. Free Radic Biol Med 23: 963–971, 1997. [DOI] [PubMed] [Google Scholar]
- 36.Raghow R, Yellaturu C, Deng X, Park EA, Elam MB. SREBPs: the crossroads of physiological and pathological lipid homeostasis. Trends Endocrinol Metab 19: 65–73, 2008. [DOI] [PubMed] [Google Scholar]
- 37.Schäfer A, Galuppo P, Fraccarollo D, Vogt C, Widder JD, Pfrang J, Tas P, Barbosa-Sicard E, Ruetten H, Ertl G, Fleming I, Bauersachs J. Increased cytochrome P4502E1 expression and altered hydroxyeicosatetraenoic acid formation mediate diabetic vascular dysfunction: rescue by guanylyl-cyclase activation. Diabetes 59: 2001–2009, 2010. [DOI] [PMC free article] [PubMed] [Google Scholar]
- 38.Shaked I, Hanna DB, Gleißner C, Marsh B, Plants J, Tracy D, Anastos K, Cohen M, Golub ET, Karim R, Lazar J, Prasad V, Tien PC, Young MA, Landay AL, Kaplan RC, Ley K. Macrophage inflammatory markers are associated with subclinical carotid artery disease in women with human immunodeficiency virus or hepatitis C virus infection. Arterioscler Thromb Vasc Biol 34: 1085–1092, 2014. [DOI] [PMC free article] [PubMed] [Google Scholar]
- 39.Szostak J, Laurant P. The forgotten face of regular physical exercise: a ‘natural’ anti-atherogenic activity. Clin Sci 121: 91–106, 2011. [DOI] [PubMed] [Google Scholar]
- 40.Van de Voorde J, Pauwels B, Boydens C, Decaluwé K. Adipocytokines in relation to cardiovascular disease. Metabolism 62: 1513–1521, 2013. [DOI] [PubMed] [Google Scholar]
- 41.Vykoukal D, Davies MG. Vascular biology of metabolic syndrome. J Vasc Surg 54: 819–831, 2011. [DOI] [PMC free article] [PubMed] [Google Scholar]
- 42.Wang XA, Zhang R, Zhang S, Deng S, Jiang D, Zhong J, Yang L, Wang T, Hong S, Guo S, She ZG, Zhang XD, Li H. Interferon regulatory factor 7 deficiency prevents diet-induced obesity and insulin resistance. Am J Physiol Endocrinol Metab 305: E485–E495, 2013. [DOI] [PubMed] [Google Scholar]
- 43.Wang Y, Beydoun MA, Liang L, Caballero B, Kumanyika SK. Will all Americans become overweight or obese? Estimating the progression and cost of the US obesity epidemic. Obesity (Silver Spring) 16: 2323–2330, 2008. [DOI] [PubMed] [Google Scholar]
- 44.Wang Y, Rimm EB, Stampfer MJ, Willett WC, Hu FB. Comparison of abdominal adiposity and overall obesity in predicting risk of type 2 diabetes among men. Am J Clin Nutr 81: 555–563, 2005. [DOI] [PubMed] [Google Scholar]
- 45.Xiao H, Lu M, Lin TY, Chen Z, Chen G, Wang WC, Marin T, Shentu Tp, Wen L, Gongol B, Sun W, Liang X, Chen J, Huang HD, Pedra JHF, Johnson DA, Shyy JYJ. Sterol regulatory element binding protein 2 activation of NLRP3 inflammasome in endothelium mediates hemodynamic-induced atherosclerosis susceptibility. Circulation 128: 632–642, 2013. [DOI] [PMC free article] [PubMed] [Google Scholar]
- 46.Zhang F, Deng H, Kemp R, Singh H, Gopal VR, Falck JR, Laniado-Schwartzman M, Nasjletti A. Decreased levels of cytochrome P450 2E1-derived eicosanoids sensitize renal arteries to constrictor agonists in spontaneously hypertensive rats. Hypertension 45: 103–108, 2005. [DOI] [PubMed] [Google Scholar]
Associated Data
This section collects any data citations, data availability statements, or supplementary materials included in this article.


