

Abstract
Localization microscopy is a fairly recently introduced super-resolution fluorescence imaging modality capable of achieving nanometre-scale resolution. We have applied the dSTORM variation of this method to image intracellular molecular assemblies in skeletal muscle fibres which are large cells that critically rely on nanoscale signalling domains, the triads. Immunofluorescence staining in fixed adult rat skeletal muscle sections revealed clear differences between fast- and slow-twitch fibres in the molecular organization of ryanodine receptors (RyRs; the primary calcium release channels) within triads. With the improved resolution offered by dSTORM, abutting arrays of RyRs in transverse view of fast fibres were observed in contrast to the fragmented distribution on slow-twitch muscle that were approximately 1.8 times shorter and consisted of approximately 1.6 times fewer receptors. To the best of our knowledge, for the first time, we have quantified the nanometre-scale spatial association between triadic proteins using multi-colour super-resolution, an analysis difficult to conduct with electron microscopy. Our findings confirm that junctophilin-1 (JPH1), which tethers the sarcoplasmic reticulum ((SR) intracellular calcium store) to the tubular (t-) system at triads, was present throughout the RyR array, whereas JPH2 was contained within much smaller nanodomains. Similar imaging of the primary SR calcium buffer, calsequestrin (CSQ), detected less overlap of the triad with CSQ in slow-twitch muscle supporting greater spatial heterogeneity in the luminal Ca2+ buffering when compared with fast twitch muscle. Taken together, these nanoscale differences can explain the fundamentally different physiologies of fast- and slow-twitch muscle.
Keywords: ryanodine receptor, skeletal muscle, junctophilin, localization microscopy
1. Introduction
Skeletal muscles serve fundamental physiological roles, facilitating movement, posture and breathing in animals. Controlled by the electrical signals received from a motor neuron at the neuromuscular junction, individual muscle fibres, the cellular units making up the muscle, contract either in twitches or tetani to generate the force required for such motor activity of the organism. These functions are met in muscle with a proportion of fast- and slow-twitch fibres [1]. For example, the extensor digitorum longus (EDL) muscles in adult rats consist of more than 95% fast-twitch fibres, whereas approximately 85% of fibres of the soleus (SOL) are slow-twitch [2]. The contractile function of fast- and slow-twitch fibres differs in velocity and maximal force, at least partly, as a result of the differing concentrations and time courses of calcium (Ca2+) released via the ryanodine receptors (RyRs) of the sarcoplasmic reticulum (SR) [3,4]. Heterogeneity in Ca2+ release between fast- and slow-twitch fibres has been attributed to differences in the SR Ca2+ handling properties [5] and the structural configurations of the release machinery. This release machinery is found in two parallel arrays of RyRs in ‘triads’—each consisting of two termini of the SR flanking a t-tubule (sarcolemmal invaginations) [6–8]. Electron microscopy has been used extensively to visualize RyRs [8–11] and indeed confirm differences between the fast- and slow-twitch triad architecture on the nanometre scale [11,12]. However, the spatial relationship of RyRs with other structural and functional proteins of the triads has not been studied in the same detail thus far owing to the lack of compatibility between protein-specific dyes/fluorescent probes with imaging modalities that offer similar resolution.
The advent of super-resolution fluorescence microscopy techniques such as PALM/dSTORM has unlocked the ability to visualize and compare very specific populations of proteins on a spatial scale that was previously unresolved with light microscopies owing to the diffraction of light. Previous image data of skeletal muscle immuno-stained for RyR [13] only offered limited capacity to resolve the fine structure of triads. Using dSTORM, we recently resolved the arrangement of RyRs and associated proteins within peripheral junctions of isolated cardiac muscle cells, demonstrating sufficient resolution to resolve morphological features in the nanometre scale [14]. Super-resolution imaging of triadic proteins should provide information of the molecular arrangement of the various triadic proteins and reveal differences between slow and fast muscle organization that have thus far been difficult to resolve using conventional approaches.
In addition to RyR, we extend the analysis here to other vital components of the calcium release machinery, such as the luminal Ca2+ buffer protein of the SR, calsequestrin (CSQ). CSQ may exist as diffusible monomers or dimers and can bind Ca2+ and polymerize in a Ca2+-dependent manner [15]. Murphy et al. [16] measured a more than threefold higher concentration of CSQ (per fibre volume) in rat fast-twitch fibres, a figure that can account for the approximately threefold maximal Ca2+ content in fast-twitch fibres well [5]. Polymers of CSQ are anchored to the luminal side of RyRs via protein linkers triadin (Trisk95) and junctin that can directly modulate RyR gating as well as buffer the near membrane luminal Ca2+ [17–20]. The physical interactions between these molecular species have been well characterized in vitro. Their native distributions relative to RyR, however, have not been examined at a resolution appropriate for visualizing muscle triads thus far. Among the junctional proteins that are vital for maintaining the close apposition between the terminal SR and the t-tubules, the role of the family of junctophilins (JPH) has been highlighted [21]. The localization and relative density of molecular species such as JPH and CSQ in proximity of the RyRs therefore provide the spatial framework for Ca2+ release. Unlike RyRs, these components are small in size and are not morphologically distinguishable with EM, which has thus far limited our capacity to resolve and quantify their spatial distributions.
In this study, we examine differences in the densities of RyR in fast- and slow-twitch muscle, and observe isoform-specific variations in the distributions of JPH1 and JPH2 in both muscle types. With novel approaches to quantify the regional densities of RyRs at single-channel resolution and a co-localization analysis that quantifies their nanometre-scale association with other triad proteins, we have unravelled the structural basis to the contrasting SR Ca2+ homeostasis in the two fibre types.
2. Material and methods
2.1. Sample preparation
EDL and SOL muscles from adult Wistar rats (euthanized according to a protocol approved by the University of Auckland Animal Ethics Committee; see the electronic supplementary material, Methods) were dissected, fixed and sectioned transversely into 10 µm thick cryo-sections. Sections were adhered to no. 1.5 glass coverslips and immunohistochemically stained for RyR1, JPH1, JPH2, CSQ or triadin (see electronic supplementary material, Methods for details protocols and solutions). Alexa-680- or Alexa-750-conjugated secondary antibodies (Life technologies) that were specific to the host species and/or isotype of the respective primary antibodies were applied to the tissue sections. Stained sections were immersed in a mounting medium which contained 90% glycerol (w/v; for achieving high refractive index), on time phosphate-buffered saline and 5 mM β-mercaptoethylamine (Sigma-Aldrich) as a reducing agent that promoted the effective photoswitching of the chosen fluorophores.
2.2. Nanoscale dSTORM imaging
dSTORM imaging was performed on a modified Nikon TE2000 inverted TIRF microscope with 60× 1.49NA oil-immersion TIRF objective (Nikon). Samples were illuminated in a ‘HiLo’ widefield configuration [22] with a highly inclined ‘light sheet’ of a 671 nm laser to achieve a power of 109 W m−2 in the focal plane. Emission from the Alexa 680 and Alexa 750 single-molecule events was split using a custom-made chromatic splitter into two channels (see electronic supplementary material, Methods and [23]) that were imaged side by side on the same Andor IXon DV887DCS-BV electron multiplying CCD camera. Upon initial illumination of the sample, the majority of the fluorophores transition into the triplet dark state which then provides a dark background above which the stochastic ‘photoswitching’ of individual fluorescent markers could be clearly seen (peak of 1000–3000 photon per pixel per event above a background of less than or equal to 300 photons per pixel).
2.3. Image analysis
A 20 Hz image series of 512 × 512 pixel frames of such events were recorded and analysed using the PYME acquisition program developed by Dr David Baddeley (code.google.com/p/python-microscopy/). Each single marker event was detected and fitted using a two-dimensional Gaussian matched-filter to determine its nanometre-scale location. The spectral identities of the Alexa 680 and Alexa 750 markers were distinguished by a ratiometric analysis of the matching image of a given event in the two spectral channels as described previously [23]. Delaunay triangulation was performed for visualization and binarization of the localization data. Protein density and co-localization was quantified using custom-written programs implemented in IDL (Exelis). See Methods in the electronic supplementary material for further details on experimental and analysis protocols.
3. Results
3.1. Quantitative super-resolution imaging of RyR distribution
Conventional diffraction-limited imaging of transverse sections of skeletal muscle in which RyRs were labelled reveals a meshwork (figure 1a), around the myofibrillar spaces (which contain the contractile proteins). Optical blurring is apparent resulting in both a very smooth but also low contrast pattern limiting the detail that could be resolved. When imaging conditions for dSTORM acquisition were selected, only images of individual marker molecules are visible and these molecules change from frame to frame owing to the stochastic nature of ‘photoswitching’ (figure 1c). The recorded centre locations of markers localized from approximately 30 000 frames trace out the pattern seen in the diffraction-limited image albeit at higher resolution and contrast. The marker map (figure 1d) can be converted into a marker density map using an estimation or ‘rendering’ algorithm [24] that resembles a conventional false colour image (figure 1e). This high-resolution data can then be thresholded to generate a binary mask of the labelled regions for some types of analysis (figure 1f) either directly from the marker position data or based on a threshold of marker density (see electronic supplementary material, Methods and figure S3). While figure 1 shows the RyR distribution in transverse view at the level of triads, the distribution of triads along the length of the cell is more apparent in a longitudinal view (see electronic supplementary material, figure S1) which reveals that each triad layer consists of two symmetric layers of RyRs flanking the central t-tubule.
Figure 1.

Single-molecule localization and visualization in dSTORM of skeletal muscle sections. (a) An example of RyR labelling in a transverse section of a rat EDL visualized through HiLo widefield fluorescence [22]. (b) Magnified view of the region in panel (a) indicated by the box. (c)(i–iii) Flashes of fluorescence (arrowheads) corresponding to single-molecule photoswitching within the same region that were localized. (d) Indicated with the white dots, are the positions of localized single-molecule events. (e) These localization data could also be rendered into greyscale images using the algorithm previously described by Baddeley et al. [24] where intensity was proportional to the local event density. (f) For binarization of these data, Delaunay triangulation was performed on the point data. Triangles longer than the effective image resolution (30 nm) were discarded while shorter triangles were merged into a binary mask that reliably captured areas of positive labelling. These binary masks were used for both the area-based RyR density analysis and the co-localization analyses presented in the manuscript. For details on the co-localization analysis method, see supporting material by Jayasinghe et al. [14]. Scale bars, (a) 1 mm, (b–f) 250 nm. (Online version in colour.)
3.2. Super-resolution imaging of the RyR organization within skeletal muscle
The high-resolution in super-resolution datasets is critical to a quantitative analysis of RyR distribution in muscle as well as the investigation of the co-registration of proteins in the triadic Ca2+ release machinery. The super-resolution data have better contrast than diffraction-limited micrographs and we observed that the segments of dense RyR labelling were often uniform in width and closely resemble the ‘polygonal’ mesh seen in EM sections where t-tubules were Golgi-stained [12]. These transverse super-resolution images provide a reliable and consistent view of the arrays of RyR in transverse view, which we use to measure their respective ‘footprint’ within each triad.
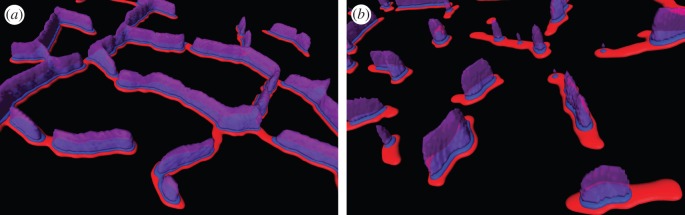
Figure 2a,b shows super-resolution comparisons of transverse sections of adult rat EDL and SOL muscles, respectively. The RyR labelling within a single plane of triads across the cross section of the fibre forms a fairly continuous mesh in EDL fibres with segments of near-constant width. This is consistent with the previous suggestion that triads in EDL (predominantly fast-twitch fibres) are arranged abutting each other and encircling the myofibrils [11]. In striking contrast, the RyR labelling in SOL fibres appeared more fragmented with 100–200 nm wide gaps between neighbouring segments. We quantified this difference by constructing histograms of the RyR segment lengths in EDL (blue) and SOL (green) fibres where segments were terminated at gaps or branch points. The lengths distribution in EDL fibres peaked at approximately 120 nm and extended from approximately 30 nm (equivalent to the size of a single receptor) to over 1000 nm. The corresponding distribution for SOL fibres had a mode at approximately 90 nm and dropped more sharply at increasing length (less than 1% was more than 800 nm). The mean (±s.e.m.) RyR segment length in EDL fibres (358.1 ± 9.69 nm) was approximately 80% longer than that in SOL fibres (200.3 ± 10.8 nm; Mann–Whitney U-test for d.f. = 12, p < 0.001). We analysed whether the sparser RyR pattern in SOL fibres was associated with larger diffusion distances (for example for Ca2+) to central parts of the myofibrillar space. By measuring the percentage of the myofibrillar cross-sectional area as a function of the distance to the edge of the nearest region of RyR labelling in EDL and SOL fibres, we constructed distance histograms. Both histograms decay towards larger distances and the steeper relationship in EDL fibres suggested that a larger fraction of the myofilaments is located closer to the triads in fast-twitch fibres, which are known to contract more rapidly. The cumulative histogram showing the percentage of the myofibrillar area within each transverse distance (inset in figure 2d) illustrates that nearly all myofibrils in fast-twitch fibres are within approximately 300 nm of the edge of the nearest triad. In contrast, the myofibrillar spaces are distributed as far as approximately 400 nm from the nearest triad edge as a result of the larger gaps between triads in the transverse plane.
Figure 2.

Comparison between the RyR distributions in fast- and slow-twitch fibres. dSTORM transverse images of EDL (a) and SOL (b) fibres labelled for RyR. Note the fragmented morphology of RyR staining in SOL compared with the highly continuous morphology in EDL. (c) This morphology and the differences in the cross-sectional fibre area containing RyRs are compared using binary masks of the dSTORM data of EDL (left) and SOL (right). (d) Percentage histogram analysis of the lengths of the RyR segments in EDL (blue) and SOL fibres (green). (e) Histograms of the percentage of transverse myofibrillar area as a function of the distance to the edge of RyR-labelled regions in EDL (blue) and SOL fibres (green). The inset shows the cumulative histogram of the same analysis where approximately 95% of the myoplasmic area is within 200 nm and 300 nm of RyRs in EDL and SOL respectively (shaded intervals indicate s.e.m.). (f) The mean values of the densities of RyR within triads show a 1.6-fold higher concentration of RyR within fibres from the EDL muscle (436 RyR µm−3) compared with those in SOL (279 RyR µm−3). The inset is a schematic of the typical double layer geometry of RyRs (red) flanking the flattened t-tubule (blue) within the triads considered in estimating the receptor densities. Scale bars, (a) and (b) 500 nm; (e) 1 µm.
3.3. Quantification of myoplasmic RyR densities
To quantify the RyR density within each image, we analysed the area of labelling observed in binarized dSTORM images of EDL and SOL (figure 2e left and right, respectively). RyR channels are arranged into highly symmetric densely filled planar arrays perpendicular to the long axis of the fibres, as seen in both fast- and slow-twitch muscle EMs [11,25] and shown in a schematic (figure 2f); therefore, the two-dimensional area occupied by RyR fluorescence in transverse images provides an approximation of the number of RyR channels on each side of the triad given that the effective resolution in our images was approximately 30 nm, i.e. the size of RyRs themselves [26,27], which should be on a grid with an approximately 30 nm × approximately 30 nm unit size [28].
Assuming that each RyR segment/footprint consists of receptors packed in two identical layers of 30 × 30 nm lattices (either side of the triad), we obtained a mean measured density of 436.3 ± 13.7 RyRs µm−2 of cross-sectional area in EDL fibres. This can be directly converted to a volume density of 436.3 ± 13.7 RyR fl−1 (n = 8 fibres) using the fact that there are two triad layers per sarcomere at A–I boundaries (i.e. 2 per 2 µm; see section on ‘dSTORM image analysis’ in electronic supplementary material for details). The equivalent analysis for SOL fibres produced a mean density of 279.5 ± 9.36 RyR fl−1 (n = 7 fibres), significantly different from the measurements made in EDL fibres (Mann–Whitney U-test: d.f. = 12, p = 0.002), reflecting a 1.62-fold higher measured RyR density in EDL fibres (figure 3d).
Figure 3.

Analysis of the spatial relationship between RyR, JPH1, JPH2 and CSQ in fast- and slow-twitch muscle. dSTORM images of RyR (red, left) and the JPH1 (green, right) in a rat (a) EDL and (b) SOL fibres report strong overlap between the two proteins in both muscles. Minor regions of little or no overlap were also observed (arrowheads). (c) Comparison of the histograms of the percentage of RyR staining as a function of the distance to the edge of the nearest region of JPH1 staining in EDL (front) and SOL fibres (back) illustrate 74.98% and 73.15% of RyRs co-localizing with JPH1 respectively (shaded regions of the histogram). dSTORM images of RyR (red, left) and JPH2 (cyan, right) staining in (d) EDL and (e) SOL fibres are shown. Note the distinctly smaller nanodomains within JPH2 staining that contrast with the widespread localization of JPH1 throughout the triads. (f) Shaded regions of the percentage histograms of RyR labelling illustrate that only 35.38% and 49.34% of the RyR is co-localized with JPH2 in EDL (front) and soleus muscle (back). Transverse dSTORM images contrast relative localizations of JPH1 (green, left) and CSQ (cyan, right) in (g) EDL and (h) SOL fibres. Note the clustered morphology of CSQ in SOL versus the more extended CSQ morphology that better follows the JPH1 staining in EDL. (i) The percentage histograms of JPH1 distribution in relation to the edge of CSQ illustrate the consequently smaller triad area consisting of CSQ in SOL (back) compared to EDL (front; 36.76% compared with 46.96%, respectively). Scale bars, (a, b, d, e, g and h) 0.5 µm.
3.4. Organization of the junctophilins within skeletal muscle triads
The striking differences between the RyR organization in fast- and slow-twitch fibres led us to investigate differences in other structural molecules of triads. A particular focus has been on junctophilins (JPH1 and JPH2) as important determinants of triad integrity and we therefore investigated the organization of JPH1 and JPH2 in relation to RyR within EDL and SOL muscle. As expected, JPH1 and JPH2 both localize to the triadic regions of the sarcomere, similar to RyR (electronic supplementary material, figure S2). Figure 3a shows super-resolution images of RyR (red) and JPH1 (green) within a fibre from a transverse section of EDL muscle contrasted with a similar region in an SOL fibre (figure 3b). In both fibre types, strong similarities in the labelling morphologies of RyR and JPH1 were observed. In EDL, JPH1 appeared in a web-like distribution that encircled myofibrils across the entire cross section of the fibre. By contrast in SOL, JPH1 expression had a more fragmented morphology strongly resembling the RyR organization. Close inspection of images, however, revealed intermittent nanodomains (white arrowheads) where the RyR and JPH1 localizations did not coincide.
Notably, the area-based absolute quantification used with RyRs was not possible for JPH owing to the much smaller size of JPH and its unknown packing density. Instead, we quantified and compared the spatial association of RyR with JPH1 in the two muscle types using a distance based co-localization quantification (see also electronic supplementary material, Methods and figure S3). Distances less than or equal to 0 denote regions of labelling of, say, RyR1 that are within areas occupied by JPH1. Histograms were constructed which compare the fraction of the RyR labelling at a given distance from the edge of the nearest region of JPH1 labelling in EDL and SOL fibres (figure 3c). On this basis, relatively large fractions of RyR labelling overlapped with JPH1 positive regions in EDL (front, approx. 74%) and SOL fibres (back, approx. 75%). Similarly, large percentages of JPH1 were found to co-localize with RyR using this analysis (see also table 1 and electronic supplementary material, figure S4a). To determine whether these values are indicative of a strong co-location of JPH and RyR within triads, we performed simulations in which two protein distributions fully overlap at the nanometre scale and occupy the same ‘junctional’ areas at comparable density to those observed experimentally. We then generated simulated marker distributions based on simulated dSTORM imaging and generated synthetic super-resolution images. Despite the underlying complete overlap at the nanoscale the images exhibited variations in the apparent marker densities qualitatively similar to those experimentally observed between JPH1 and RyR. When analysed in the same way as the experimental data, fractions of approximately 75–79% were co-localizing in the simulated data (see also supplementary analysis in electronic supplementary material, figure S5). Therefore, measured fractions of approximately 75% are compatible with near-perfect co-localization between RyR and JPH1 in both EDL and SOL fibres.
Table 1.
Co-localizing fractions of RyR, JPH1, JPH2, CSQ and triadin in the adult rat EDL and SOL muscles. Stated values correspond to mean % ± s.e.m. (number of fibres/number of animals).
| protein A | protein B | % of A colocalizing with B |
% of B colocalizing with A |
||
|---|---|---|---|---|---|
| EDL | SOL | EDL | SOL | ||
| JPH1 | RyR | 74.46 ± 1.30 (8/3) | 68.82 ± 2.15 (6/3) | 74.98 ± 2.55 (8/3) | 73.15 ± 1.55 (6/3) |
| JPH2 | RyR | 73.72 ± 3.54 (6/3) | 75.24 ± 2.79 (5/3) | 35.38 ± 2.59 (6/3) | 49.34 ± 2.57 (5/3) |
| CSQ | JPH1 | 63.54 ± 2.84 (5/2) | 63.76 ± 1.97 (7/2) | 61.42 ± 2.88 (5/2) | 40.35 ± 1.82 (7/2) |
| triadin | JPH1 | 49.62 ± 2.48 (7/2) | 46.96 ± 2.37 (5/2) | 62.12 ± 1.58 (7/2) | 36.76 ± 2.64 (5/2) |
In contrast, when RyR labelling (red) is compared with that of the isoform JPH2 (cyan) within the EDL (figure 4d) and SOL (figure 4f) tissue sections, the JPH2 was more fragmented and seemed to cover a smaller area in both muscle types but was yet restricted to the triads. This is somewhat less obvious in SOL (as the RyR distribution is itself fragmented) but becomes apparent on close inspection and is confirmed by quantitative measurement. A high fraction of JPH2 co-localizes with RyR, approximately 74% and approximately 75% in EDL and SOL fibres, respectively (table 1 and electronic supplementary material, figure S4b), compatible with the model that JPH2 is almost exclusively in triads, i.e. RyR positive regions. By contrast, a smaller fraction of the RyR co-localized with JPH2 in both EDL (approx. 35%) and SOL fibres (approx. 49%) as shown in figure 4f indicating a notable subset of RyRs that had no overlap with JPH2.
Figure 4.
Schematic of the organization of RyR, triadin and CSQ in fast- and slow-twitch skeletal muscle. (a) The proposed organization of RyR arrays (red) on one side of the triad forming a mesh-like distribution around the myofibrillar spaces in fast-twitch muscle. Based on co-localization analysis with JPH1, triadin (blue) is expected to overlap with much of the RyR arrays on their luminal side, closely coinciding with CSQ (magenta). (b) In slow-twitch fibres, RyR arrays are seen as comparatively fragmented segments with only a smaller fraction overlapping with triadin and CSQ.
The principal difference between the fractions of RyR co-localizing with JPH1 and JPH2 underscores the distinctly different extended and punctate morphologies of the two respective protein distributions. These measurements therefore strongly suggest the JPH2 is only present in some triads, whereas JPH1 is ubiquitous in all skeletal muscle triads and can also serve as a proxy for the presence of RyRs per triads.
3.5. Organization of calsequestrin in the skeletal muscle sarcomere
In the above analyses, we observed differences in the RyR density in fast- and slow-twitch muscle which may be related to the differences in Ca2+ release between fast and slow types. An important determinant of the functional capacity of RyR to release Ca2+ in skeletal muscle is the availability of the SR Ca2+ buffer, CSQ, in close proximity of triads.
Figure 3g,h illustrates transverse images of JPH1 (green, left panels) and CSQ (magenta, right) in EDL and SOL fibres, respectively. JPH1 staining showed the now familiar highly continuous web-like triad morphology in EDL and the less continuous pattern in SOL (see also figure 4). In EDL, the CSQ distribution appeared to trace out most of the highly continuous regions of JPH1 staining. In SOL fibres, by contrast, CSQ appeared generally in small clusters located in regions that generally overlapped with JPH1, but many JPH1 domains had no corresponding CSQ. Strikingly, these clusters of CSQ were approximately 50–100 nm wide and characteristically smaller than the corresponding triads (as identified by JPH1 labelling). Figure 3i shows histograms of the JPH1 labelling as a function of the distance from the edge of the nearest region of CSQ staining in EDL (front) and SOL fibres (back). Only approximately 40% of the JPH1 staining in SOL fibres overlap with CSQ, owing to the smaller CSQ domains, whereas approximately 61% of the JPH1 staining co-localize with CSQ in EDL fibres (figure 3i). In other words, most of the triad has associated CSQ in EDL but only a smaller fraction in SOL. By contrast, a similar fraction of the CSQ labelling was found in direct overlap with the JPH1 in EDL (approx. 64%) and in SOL fibres (approx. 64%), see electronic supplementary material, figure S5C, suggesting that most (if not all) of CSQ was associated with triads in both muscle types.
A similar difference between EDL and SOL was observed when comparing the distributions of triadin (known to be one of the linkers between CSQ and RyR) in relation to JPH1 (electronic supplementary material, figure S6).
4. Discussion
We have used super-resolution dSTORM microscopy to image the organization of key Ca2+ handling proteins and auxiliary structural proteins found in skeletal muscle triads. In our implementation of dSTORM, a typical in-plane resolution of approximately 30 nm was achieved, similar to the size of RyRs themselves. In doing so, we have achieved an approximately 10-fold improvement in the resolution for visualizing the extension of triads across the width of the fibres. The resulting RyR distribution patterns were quite similar to the flattened Golgi-stained t-tubule regions in rat skeletal muscle EMs by Appelt et al. [12] and Franzini-Armstrong & Protasi [11] and which were identified by Franzini-Armstrong et al. as triad areas. In addition, we used the ability of fluorescent methods to achieve molecular specificity and have refined the information on where accessory triad proteins are located using our high-resolution approach. Owing to the large size of RyRs, we were able to quantify the density of RyRs based on the area covered and quantify differences between fast and slow fibres. We extended these comparisons to other triadic proteins and reveal some basic differences in triad organization between muscle types.
4.1. Super-resolution dSTORM for visualizing and quantifying triadic proteins
There are detailed EM data on the distribution of RyRs in skeletal muscle [11,12,29]. This is complemented by a range of biochemical data on the expression of several triadic proteins in different types of muscle [16,30,31] but those typically lack spatial resolution. Approaches to combine the high specificity of the biochemical techniques with the nanometre-scale resolution of EM imaging would be extremely useful, and we here show that super-resolution microscopy of protein markers in skeletal muscle may fill this gap. Owing to the size of RyRs, comparable to the resolution of the dSTORM super-resolution data, RyR measurements can be made quantitative, given the knowledge of the tight clustering of RyRs in triads and a known area occupied per RyR, similar as previously described in skeletal muscle. For smaller proteins, the determination of absolute protein quantities is substantially more difficult which can be partially compensated for by the ability of multi-colour dSTORM to quantify the fractions of proteins that co-locate with each other and largely avoid artefacts resulting from limited resolution [32]. A considerable advantage is the very small spectral cross-talk that can be readily achieved with the single-molecule-based detection of this imaging approach [23]. This allows a nanometre-scale analysis of the distances between different protein distributions which can be analysed for the biologically important distances, e.g. Ca2+ diffusion distances, as well as the localization to the nanometre-sized compartments that form the triad.
4.2. Triadic organization of RyR in fast- and slow-twitch muscle
Combining immunofluorescence labelling of RyR with super-resolution imaging, we have produced, to the best of our knowledge, the first optical images that resolve the full extent of the RyR distribution in EDL and SOL skeletal muscles, which are predominantly fast- and slow-twitch type, respectively. Our images show ‘ribbon’-like segments of RyR staining with highly uniform widths in transverse dSTORM images that bear strong resemblance to the flattened t-tubule segments observed previously by Franzini-Armstrong et al. with Golgi-stained EMs [11,33]. The near-molecular resolution data revealed qualitative differences in triad organization with a quasi-continuous morphology of RyR staining in EDL which is likely the result of the end-to-end arrangement of triads. In contrast, the more discrete segments of RyR in SOL are compatible with the previous Golgi stain observation of discrete elements of flattened (presumably junctional) t-tubules that are connected by rounder segments of non-junctional t-tubules that appear narrower in thin sections [11]. Similar to previous studies [11,12,34], the triads surrounded myofibrils that were typically polygonal in shape. The lengths of the RyR segments were measured either end-to-end (typically in SOL) or between branch points (EDL). The distribution of triad lengths is broader and has a higher average (approx. 80% longer) in SOL than the corresponding segment lengths in EDL fibres. This is similar to the difference in triad length observed by Franzini-Armstrong et al. [11] (calculated to be approx. 60%). We note that our branch lengths are not quite the same as the triad length specified in the above study but visual inspection of their data suggested that most triads ended at branch points.
Our analysis of the RyR density based on the area of RyR staining in transverse super-resolution images estimated mean values of 436 and 280 RyR fl−1 in EDL and SOL fibres, respectively, i.e. 62% more RyRs per unit volume in EDL versus SOL. Area-based calculations of Appelt et al. [12] using Golgi staining of the t-system estimate that the density of ‘feet’ per unit surface membrane area (sum of t-tubular and surface membrane) is approximately 60% higher in rat EDL fibres than that in SOL. Given that their measurements of t-tubule membrane densities (length of tubule per unit cross-sectional area of fibre, perimeters of junctional and extra-junctional t-tubule membranes) and the perimeters of the fibre surface are all highly comparable between EDL and SOL, this approximately 60% difference in feet density would reflect a similar difference in feet density per fibre volume, in good agreement with our estimates (table 2 and figure 3). The general magnitude of the RyR volume density broadly agrees with a ryanodine binding study that quantified RyRs in rabbit fast skeletal muscle as 1000 fmol mg−1 [31]. Using an approximate conversion of 292 g homogenized protein l−1 cytosol [35], this can be converted to 175 RyRs fl−1 which is comparable to our estimates, if somewhat lower, given the uncertainty on differences of RyR content between rat and rabbit fast twitch muscles. Analysis of RyR density from EM ‘feet’ data by Cullen et al. [29] and Lamb [36] calculates a very similar density of RyR in fast-twitch fibres. However, ryanodine binding experiments by Margreth et al. [37] show a 2.5-fold difference in the densities between EDL and SOL fibres, a factor that is larger than that estimated in our data presented here. On the other hand, the analyses of Lamb [36] suggest a range of 172–204 pmol g−1 in fast twitch mammal versus 86–126 pmol g−1 in slow-twitch mammalian muscle which results in a ratio similar to our factor of approximately 1.6. The absolute RyR density estimates of EDL and SOL in the latter two analyses are approximately two- to threefold smaller than our estimates based on the area of labelling. In connection with this point, Lamb [36] discusses disagreement between the ryanodine binding experiments and the ‘feet’ analyses. We highlight that the lack of resolution to resolve between the two layers of RyR in the triad (as assumed in figure 2f) and potential variations in staining arising from the stochastic nature of antibody binding may be sources of error in our immunofluorescence dSTORM approach. This includes the possibility that we may miss small gaps in the staining pattern, because the limit of resolution is close to the size of a single RyR.
Table 2.
Summary of measurements of RyR segments in EDL and SOL fibres. Stated values correspond to mean % ± s.e. (number of fibres/number of animals).
| EDL | SOL | |
|---|---|---|
| mean segment length (nm) | 358.1±13.7 (8/3) | 200.3±10.8 (7/3) |
| mean RyR density by area (RyR fl−1) | 436.3±13.7 (8/3) | 279.5±9.4 (7/3) |
4.3. Relationship between JPH1, JPH2 and RyR in fast- and slow-twitch muscle
We used specific antibodies raised against divergent encoding regions of JPH1 (residues 425–633 of JPH-1 cDNA; [38]) and JPH2 (residues 436–664 of JPH-2 cDNA, [39]), for super-resolution localizations of these junctional proteins. Our data revealed a high degree of co-localization between JPH1 and RyR in both EDL and SOL fibres similar to that observed between JPH2 and RyR2 in rat cardiac muscle [14]. Our findings are strongly suggestive of a close packing of JPH1 in between RyRs throughout the entire triad (rather than specialized structural subdomains) which would also be compatible with direct functional interactions with RyR1 (and DHPR, see [30]). Therefore, it is conceivable that cleavage of JPH1 by µ-calpains is likely to affect the entire triad during the abolition of skeletal muscle excitation–contraction (EC) coupling as a result of sustained high [Ca2+]i [21,40]. By contrast, JPH2 was concentrated in smaller discrete domains (rather than uniformly present at low density) which could indicate that the triad structure or function is different in these domains, but further investigation would be required to test this idea. In addition, we noted that a larger fraction of RyR (by approx. 40%) co-localizes with JPH2 in slow-twitch fibres compared with fast-twitch fibres. In general, the role of JPH2 in skeletal muscle triads is not altogether clear. The differences between fast and slow muscle JPH2 expression raise the question if JPH2 is merely a background with little consequence or if it serves specific functions in skeletal muscle.
4.4. Calsequestrin and triadin organization in fast- and slow-twitch muscle
In transverse view of the EDL fibre triads, CSQ traced out the highly extended triad morphology revealed by both RyR and JPH1 images. Images by Franzini-Armstrong & Boncompagni in [41] suggest that CSQ polymers can occupy much of the terminal SR volume. In contrast, the CSQ appeared in very compact clusters within triads of SOL muscle. One possibility is that these clusters are discrete ‘trees’ of highly polymerized CSQ that are intrinsically constrained to a small space. It is however unknown how well our dSTORM images of fixed EDL and SOL fibres detect the soluble components of CSQ. Fixation with 2% paraformaldehyde, in our experiments, produced the optimal CSQ labelling densities but it is not completely clear whether (monomeric) CSQ is fully preserved with these methods. There is further uncertainty whether the fixation and the anti-CSQ antibody allow similar probabilities of detecting the more soluble isoform CSQ2 when compared with CSQ1, especially in slow-twitch fibres. Therefore, additional CSQ2-specific staining may be required for comparing the relative densities of the two isoforms present in skeletal muscle; in general, biochemical techniques that enable more direct quantification of such proteins [16] offer greater power in analysing expression levels of protein of unknown packing densities.
Triadin showed similar triad distribution to CSQ in both EDL and SOL. In the absence of direct double-label comparisons (owing to antibody host species restrictions), the data are therefore broadly consistent with the idea that triadin and CSQ are present in similar subdomains of triads in both EDL and SOL. Notably, triadin itself is revealed not to be a reliable triad marker owing to its limited coverage of the triad area which is only revealed using the nanoscale resolution used here.
4.5. A schematic view of triad organization in extensor digitorum longus and soleus
The general findings of triad protein distribution patterns support a picture as suggested in figure 4 which schematically shows RyR, triadin and CSQ in EDL versus SOL fibres. It reflects the more continuous triad pattern fully surrounding myofibrils in EDL and the relatively fragmented triad distribution in SOL. In EDL muscle, both CSQ and triadin are present throughout the triads (compatible with high co-localizing fractions with JPH1). By contrast, in SOL CSQ and triadin are limited to smaller, coinciding (as argued above), subdomains within triads. This could indicate that microdomains of RyR that have poorly buffered luminal Ca2+ are larger in SOL than in EDL fibres.
In constructing this view of the distribution, we interpreted high co-localization figures (more than 60%) as meaning ‘essentially co-localized’ within a junction. Our simulations support this idea (electronic supplementary material, figure S5) in principle and emphasize that 100% co-localization is not to be expected both owing to marker binding variability and other stochastic imaging properties, such as localization accuracies and stochastic variations in the photophysics.
In addition to this general picture, the data suggest some further more subtle differences. Similar proportions (approx. 64%) of CSQ were found to co-localize with JPH1 in SOL and EDL, a number broadly compatible with strong co-localization but lower than the approximately 75% expected for complete overlap (electronic supplementary material, figure S5) possibly indicating that a small fraction of CSQ is outside of terminal cisternae. This observation is even more pronounced in the case of triadin whose co-localization with JPH1 does not exceed 50%.
4.6. Implications for EC coupling and [Ca2+]i of fast- and slow-twitch fibres
The utility of the approaches shown here to quantitate protein distribution in the skeletal muscle triad relies in the ability to investigate structure–function relationships and attempt to explain the differences between slow- and fast-twitch muscle Ca2+ signalling mechanistically. A rigorous comparison would require construction of a detailed mathematical model, and the data shown here should be used to constrain such a model in spatial make-up and protein concentration. Nevertheless, even without a detailed model, some aspects can be discussed qualitatively from the point of view of muscle EC coupling.
The rate of rise in [Ca2+]i and the peak amplitude of [Ca2+]i during the activation of fast-twitch muscle were both measured to be more than threefold greater than those in slow-twitch fibres based on fast calcium indicator experiments [3]. Therefore, a 1.6-fold difference in the RyR densities in the two muscle types measured above may appear too small to explain the functional differences. A small correction of measurements in SOL takes account of the fact that approximately 9% of junctions will form dyads rather than triads, i.e. one layer of RyRs is absent from the local t-system segment. This would result in a 4.5% reduction of the total RyR estimate in SOL so that EDL samples have an effectively approximately 70% higher RyR density still leaving a sizable discrepancy between expression and functional data.
The discrepancy may be resolved by noting that both the above Ca2+ measurements are also affected by the fraction of RyRs functionally coupled to DHPR, Ca2+-dependent inactivation of release and the free luminal [Ca2+]. If JPH1 distribution within triads can be considered as a proxy for functional coupling between the RyR [30] and the voltage sensor, our co-localization estimates suggest comparable fractions of coupled RyRs. The junctional [Ca2+] responsible for the Ca2+-dependent inactivation is likely to be affected by the triad geometries such as triad size (figure 2c) and calcium diffusion distances (figure 2d) that determines the dissipation of the released Ca2+. While the larger RyR arrays and triads seen in fast-twitch fibres would favour Ca2+-dependent inactivation, our previous modelling in cardiac dyads suggests that this is a minor effect compared with that of other junctional buffers [42]. Fibre-type specific cytoplasmic Ca2+ buffer differences are known (e.g. parvalbumin is only in fast-twitch fibres [43]), their effect on intra-triadic Ca2+ buffering may be more pronounced and may produce a situation where the fast inactivation is fractionally higher in SOL fibres. Finally, a higher SR free [Ca2+] itself could potentiate the peak [Ca2+]i and rate of release. In connection with this point, a greater SR free [Ca2+] has been suggested in SOL fibres [16], but the interpretation of this result may be complicated by the fact that it was obtained in a skinned muscle preparation which may have resulted in subtly different conditions than the experiments by Baylor & Hollingworth [5]. We propose that the disparity in the triad area overlapping with CSQ between the two fibre types could lead to a more pronounced inhomogeneity in the local luminal Ca2+ buffering and therefore local free [Ca2+] in SOL fibres. This could manifest in a rapid drop in the luminal free [Ca2+] ‘seen’ by a considerable fraction of RyRs, contributing to a reduced peak rate of release and [Ca2+]i. How important such an effect could become would depend on the mobility of Ca2+ in the SR and its ability to replenish local [Ca2+] from adjacent parts of the SR [44]. Inhomogeneities in free [Ca2+] may also have implications for the placement of the SR Ca2+ sensors that signal store content (for example, to maintain store content via store operated Ca2+ entry; SOCE [45]) in slow-twitch muscle. We note that owing to the small distances it may be currently difficult to resolve such differences with kinetically limited indicators and diffraction-limited (e.g. confocal) imaging of these Ca2+ indicators. In the case of SOCE, if slow-twitch fibres indeed contain their luminal Ca2+ sensors (STIM1) pre-assembled into the triad area [45,46], this may result in a greater propensity of these fibres to exhibit SOCE in such triads compared to fast-twitch fibres, unless they are closely associated with CSQ.
5. Conclusion
In this study, we have examined the components of the Ca2+ release sites, the triads, of fast- and slow-twitch muscle of the rat limbs. The near-molecular resolution close to that of electron micrographs offered by dSTORM has been necessary for quantifying the organization of these components that provide both structure and functional modulation of triadic Ca2+. The major observation with respect to the RyR distribution was a clear difference in the extent of RyR arrays throughout the fibre cross section between the two muscle types investigated. Using the capability of dSTORM multi-colour super-resolution imaging, we have quantified the relative overlap of these proteins. Within the bounds limited by variability arising from the stochastic nature of antibody binding and dSTORM photoswitching, we reveal both isoform-specific (JPH1 versus JPH2) and fibre-type-specific (CSQ and triadin) variations in the spatial organization of proteins in skeletal muscle. Considered together, the fibre-type specific heterogeneities in RyR and CSQ distributions contribute to the contrasting buffering and release properties of the Ca2+ store in these two muscle types and help clarify the complex molecular basis of fibre-type differences.
Supplementary Material
Acknowledgements
The authors acknowledge Dr Masahiko Hoshijima (NCMIR, San Diego, CA), Prof. Stephen M. Baylor and Dr Stephen Hollingworth (University of Pennsylvania, PA) and an anonymous reviewer for helpful discussions on our findings.
Funding statement
This work was supported by a Health Research Council project held by C.S. and an Australian Research Council Discovery Project to B.S.L. (DP110102849). I.D.J., and C.S. designed the study. I.D.J. performed the primary experiments. M.M. performed supporting experiments. C.S. and D.B. developed the image acquisition and analysis programmes and hardware. I.D.J. and C.S. analysed the data. I.D.J., C.S., D.B. and B.S.L. interpreted the findings and prepared the manuscript.
References
- 1.Schiaffino S, Reggiani C. 2011. Fiber types in mammalian skeletal muscles. Physiol. Rev. 91, 1447–1531. ( 10.1152/physrev.00031.2010) [DOI] [PubMed] [Google Scholar]
- 2.Close RI. 1972. Dynamic properties of mammalian skeletal muscles. Physiol. Rev. 52, 129–197. [DOI] [PubMed] [Google Scholar]
- 3.Baylor SM, Hollingworth S. 2003. Sarcoplasmic reticulum calcium release compared in slow-twitch and fast-twitch fibres of mouse muscle. J. Physiol. 551, 125–138. ( 10.1113/jphysiol.2003.041608) [DOI] [PMC free article] [PubMed] [Google Scholar]
- 4.Barclay CJ. 2012. Quantifying Ca2+ release and inactivation of Ca2+ release in fast- and slow-twitch muscles. J. Physiol. 590, 6199–6212. ( 10.1113/jphysiol.2012.242073) [DOI] [PMC free article] [PubMed] [Google Scholar]
- 5.Fryer MW, Stephenson DG. 1996. Total and sarcoplasmic reticulum calcium contents of skinned fibres from rat skeletal muscle. J. Physiol. 493, 357–370. [DOI] [PMC free article] [PubMed] [Google Scholar]
- 6.Porter KR, Palade GE. 1957. Studies on the endoplasmic reticulum. III. Its form and distribution in striated muscle cells. J. Biophys. Biochem. Cytol. 3, 269–300. ( 10.1083/jcb.3.2.269) [DOI] [PMC free article] [PubMed] [Google Scholar]
- 7.Peachey LD. 1965. The sarcoplasmic reticulum and transverse tubules of the frog's sartorius. J. Cell Biol. 25, 209–231. ( 10.1083/jcb.25.3.209) [DOI] [PubMed] [Google Scholar]
- 8.Dulhunty AF. 1984. Heterogeneity of T-tubule geometry in vertebrate skeletal muscle fibres. J. Muscle Res. Cell Motil. 5, 333–347. ( 10.1007/BF00713111) [DOI] [PubMed] [Google Scholar]
- 9.Ferguson DG, Schwartz HW, Franzini-Armstrong C. 1984. Subunit structure of junctional feet in triads of skeletal muscle: a freeze-drying, rotary-shadowing study. J. Cell Biol. 99, 1735–1742. ( 10.1083/jcb.99.5.1735) [DOI] [PMC free article] [PubMed] [Google Scholar]
- 10.Franzini-Armstrong C. 1970. Studies of the triad: I. Structure of the junction in frog twitch fibers. J Cell Biol 47, 488–499. ( 10.1083/jcb.47.2.488) [DOI] [PMC free article] [PubMed] [Google Scholar]
- 11.Franzini-Armstrong C, Protasi F, Ramesh V. 1999. Shape, size, and distribution of Ca2+ release units and couplons in skeletal and cardiac muscles. Biophys. J. 77, 1528–1539. ( 10.1016/S0006-3495(99)77000-1) [DOI] [PMC free article] [PubMed] [Google Scholar]
- 12.Appelt D, Buenviaje B, Champ C, Franzini-Armstrong C. 1989. Quantitation of ‘junctional feet’ content in two types of muscle fiber from hind limb muscles of the rat. Tissue Cell 21, 783–794. ( 10.1016/0040-8166(89)90087-6) [DOI] [PubMed] [Google Scholar]
- 13.Flucher BE, Conti A, Takeshima H, Sorrentino V. 1999. Type 3 and type 1 ryanodine receptors are localized in triads of the same mammalian skeletal muscle fibers. J. Cell Biol. 146, 621–630. ( 10.1083/jcb.146.3.621) [DOI] [PMC free article] [PubMed] [Google Scholar]
- 14.Jayasinghe ID, Baddeley D, Kong CH, Wehrens XH, Cannell MB, Soeller C. 2012. Nanoscale organization of junctophilin-2 and ryanodine receptors within peripheral couplings of rat ventricular cardiomyocytes. Biophys. J. 102, L19–L21. ( 10.1016/j.bpj.2012.01.034) [DOI] [PMC free article] [PubMed] [Google Scholar]
- 15.Park H, Wu S, Dunker AK, Kang C. 2003. Polymerization of calsequestrin. Implications for Ca2+ regulation. J. Biol. Chem. 278, 16 176–16 182. ( 10.1074/jbc.M300120200) [DOI] [PubMed] [Google Scholar]
- 16.Murphy RM, Larkins NT, Mollica JP, Beard NA, Lamb GD. 2009. Calsequestrin content and SERCA determine normal and maximal Ca2+ storage levels in sarcoplasmic reticulum of fast- and slow-twitch fibres of rat. J. Physiol. 587, 443–460. ( 10.1113/jphysiol.2008.163162) [DOI] [PMC free article] [PubMed] [Google Scholar]
- 17.Boncompagni S, Thomas M, Lopez JR, Allen PD, Yuan Q, Kranias EG, Franzini-Armstrong C, Perez CF, Launikonis BS. 2012. Triadin/junctin double null mouse reveals a differential role for triadin and junctin in anchoring CASQ to the jSR and regulating Ca2+ homeostasis. PLoS ONE 7, e39962 ( 10.1371/journal.pone.0039962) [DOI] [PMC free article] [PubMed] [Google Scholar]
- 18.Jones LR, Zhang L, Sanborn K, Jorgensen AO, Kelley J. 1995. Purification, primary structure, and immunological characterization of the 26-kDa calsequestrin binding protein (junctin) from cardiac junctional sarcoplasmic reticulum. J. Biol. Chem. 270, 30 787–30 796. ( 10.1074/jbc.270.51.30787) [DOI] [PubMed] [Google Scholar]
- 19.Goonasekera SA, Beard NA, Groom L, Kimura T, Lyfenko AD, Rosenfeld A, Marty I, Dulhunty AF, Dirksen RT. 2007. Triadin binding to the C-terminal luminal loop of the ryanodine receptor is important for skeletal muscle excitation–contraction coupling. J. Gen. Physiol. 130, 365–378. ( 10.1085/jgp.200709790) [DOI] [PMC free article] [PubMed] [Google Scholar]
- 20.Rebbeck RT, Karunasekara Y, Board PG, Beard NA, Casarotto MG, Dulhunty AF. 2014. Skeletal muscle excitation–contraction coupling: who are the dancing partners? Int. J. Biochem. Cell Biol. 48, 28–38. ( 10.1016/j.biocel.2013.12.001) [DOI] [PubMed] [Google Scholar]
- 21.Murphy RM, Dutka TL, Horvath D, Bell JR, Delbridge LM, Lamb GD. 2013. Ca2+-dependent proteolysis of junctophilin-1 and junctophilin-2 in skeletal and cardiac muscle. J. Physiol. 591, 719–729. ( 10.1113/jphysiol.2012.243279) [DOI] [PMC free article] [PubMed] [Google Scholar]
- 22.Tokunaga M, Imamoto N, Sakata-Sogawa K. 2008. Highly inclined thin illumination enables clear single-molecule imaging in cells. Nat. Methods 5, 159–161. ( 10.1038/nmeth1171) [DOI] [PubMed] [Google Scholar]
- 23.Baddeley D, et al. 2011. 4D super-resolution microscopy with conventional fluorophores and single wavelength excitation in optically thick cells and tissues. PLoS ONE 6, e20645 ( 10.1371/journal.pone.0020645) [DOI] [PMC free article] [PubMed] [Google Scholar]
- 24.Baddeley D, Cannell MB, Soeller C. 2010. Visualization of localization microscopy data. Microsc. Microanal. 16, 64–72. ( 10.1017/S143192760999122X) [DOI] [PubMed] [Google Scholar]
- 25.Eisenberg BR, Kuda AM. 1975. Stereological analysis of mammalian skeletal muscle. II. White vastus muscle of the adult guinea pig. J. Ultrastruct. Res. 51, 176–187. ( 10.1016/S0022-5320(75)80146-8) [DOI] [PubMed] [Google Scholar]
- 26.Franzini-Armstrong C, Protasi F. 1997. Ryanodine receptors of striated muscles: a complex channel capable of multiple interactions. Physiol. Rev. 77, 699–729. [DOI] [PubMed] [Google Scholar]
- 27.Dulhunty AF. 1989. Feet, bridges, and pillars in triad junctions of mammalian skeletal muscle: their possible relationship to calcium buffers in terminal cisternae and T-tubules and to excitation–contraction coupling. J. Memb. Biol. 109, 73–83. ( 10.1007/BF01870792) [DOI] [PubMed] [Google Scholar]
- 28.Yin CC, Lai FA. 2000. Intrinsic lattice formation by the ryanodine receptor calcium-release channel. Nat. Cell Biol. 2, 669–671. ( 10.1038/35023625) [DOI] [PubMed] [Google Scholar]
- 29.Cullen MJ, Hollingworth S, Marshall MW. 1984. A comparative study of the transverse tubular system of the rat extensor digitorum longus and soleus muscles. J. Anat. 138, 297–308. [PMC free article] [PubMed] [Google Scholar]
- 30.Golini L, et al. 2011. Junctophilin 1 and 2 proteins interact with the L-type Ca2+ channel dihydropyridine receptors (DHPRs) in skeletal muscle. J. Biol. Chem. 286, 43 717–43 725. ( 10.1074/jbc.M111.292755) [DOI] [PMC free article] [PubMed] [Google Scholar]
- 31.Bers DM, Stiffel VM. 1993. Ratio of ryanodine to dihydropyridine receptors in cardiac and skeletal muscle and implications for E-C coupling. Am. J. Physiol. 264, C1587–C1593. [DOI] [PubMed] [Google Scholar]
- 32.Ronneberger O, Baddeley D, Scheipl F, Verveer PJ, Burkhardt H, Cremer C, Fahrmeir L, Cremer T, Joffe B. 2008. Spatial quantitative analysis of fluorescently labeled nuclear structures: problems, methods, pitfalls. Chromosome Res. 16, 523–562. ( 10.1007/s10577-008-1236-4) [DOI] [PubMed] [Google Scholar]
- 33.Franzini-Armstrong C. 2002. Veratti and beyond: structural contributions to the study of muscle activation. Rend Fis. Acc. Lincei. 13, 289–323. ( 10.1007/BF02904357) [DOI] [Google Scholar]
- 34.Peachey LD, Eisenberg BR. 1978. Helicoids in the T system and striations of frog skeletal muscle fibers seen by high voltage electron microscopy. Biophys. J. 22, 145–154. ( 10.1016/S0006-3495(78)85480-0) [DOI] [PMC free article] [PubMed] [Google Scholar]
- 35.Bers DM. 2001. Excitation–contraction coupling and cardiac contractile force, 2nd edn Dordrecht, The Netherlands: Kluwer Academic. [Google Scholar]
- 36.Lamb GD. 1992. DHP receptors and excitation–contraction coupling. J. Muscle Res. Cell Motil. 13, 394–405. ( 10.1007/BF01738035) [DOI] [PubMed] [Google Scholar]
- 37.Margreth A, Damiani E, Tobaldin G. 1993. Ratio of dihydropyridine to ryanodine receptors in mammalian and frog twitch muscles in relation to the mechanical hypothesis of excitation–contraction coupling. Biochem. Biophys. Res. Commun. 197, 1303–1311. ( 10.1006/bbrc.1993.2619) [DOI] [PubMed] [Google Scholar]
- 38.Ito K, Komazaki S, Sasamoto K, Yoshida M, Nishi M, Kitamura K, Takeshima H. 2001. Deficiency of triad junction and contraction in mutant skeletal muscle lacking junctophilin type 1. J. Cell Biol. 154, 1059–1067. ( 10.1083/jcb.200105040) [DOI] [PMC free article] [PubMed] [Google Scholar]
- 39.Takeshima H, Komazaki S, Nishi M, Iino M, Kangawa K. 2000. Junctophilins: a novel family of junctional membrane complex proteins. Mol. Cell 6, 11–22. [DOI] [PubMed] [Google Scholar]
- 40.Lamb GD, Junankar PR, Stephenson DG. 1995. Raised intracellular Ca2+ abolishes excitation–contraction coupling in skeletal muscle fibres of rat and toad. J. Physiol. 489, 349–362. [DOI] [PMC free article] [PubMed] [Google Scholar]
- 41.Royer L, Rios E. 2009. Deconstructing calsequestrin. Complex buffering in the calcium store of skeletal muscle. J. Physiol. 587, 3101–3111. ( 10.1113/jphysiol.2009.171934) [DOI] [PMC free article] [PubMed] [Google Scholar]
- 42.Soeller C, Cannell MB. 1997. Numerical simulation of local calcium movements during L-type calcium channel gating in the cardiac diad. Biophys. J. 73, 97–111. ( 10.1016/S0006-3495(97)78051-2) [DOI] [PMC free article] [PubMed] [Google Scholar]
- 43.Heizmann CW, Berchtold MW, Rowlerson AM. 1982. Correlation of parvalbumin concentration with relaxation speed in mammalian muscles. Proc. Natl Acad. Sci. USA 79, 7243–7247. ( 10.1073/pnas.79.23.7243) [DOI] [PMC free article] [PubMed] [Google Scholar]
- 44.Cully TR, Edwards JN, Launikonis BS. 2014. Activation and propagation of Ca2+ release from inside the sarcoplasmic reticulum network of mammalian skeletal muscle. J. Physiol. ( 10.1113/jphysiol.2014.274274) [DOI] [PMC free article] [PubMed] [Google Scholar]
- 45.Launikonis BS, Murphy RM, Edwards JN. 2010. Toward the roles of store-operated Ca2+ entry in skeletal muscle. Pflugers Archiv. 460, 813–823. ( 10.1007/s00424-010-0856-7) [DOI] [PubMed] [Google Scholar]
- 46.Wei-LaPierre L, Carrell EM, Boncompagni S, Protasi F, Dirksen RT. 2013. Orai1-dependent calcium entry promotes skeletal muscle growth and limits fatigue. Nat. Commun. 4, article number 2805 ( 10.1038/ncomms3805) [DOI] [PMC free article] [PubMed] [Google Scholar]
Associated Data
This section collects any data citations, data availability statements, or supplementary materials included in this article.