Abstract
Social animals commonly form aggregates that exhibit emergent collective behaviour, with group dynamics that are distinct from the behaviour of individuals. Simple models can qualitatively reproduce such behaviour, but only with large numbers of individuals. But how rapidly do the collective properties of animal aggregations in nature emerge with group size? Here, we study swarms of Chironomus riparius midges and measure how their statistical properties change as a function of the number of participating individuals. Once the swarms contain order 10 individuals, we find that all statistics saturate and the swarms enter an asymptotic regime. The influence of environmental cues on the swarm morphology decays on a similar scale. Our results provide a strong constraint on how rapidly swarm models must produce collective states. But our findings support the feasibility of using swarms as a design template for multi-agent systems, because self-organized states are possible even with few agents.
Keywords: collective animal behaviour, statistical mechanics, self-organization
1. Introduction
It is extremely common in nature for groups of social animals to behave collectively, in flocks, schools, herds, crowds or swarms. This collective behaviour is thought to arise so frequently because it balances the pressures of competition and cooperation [1–3]. But, beyond its clear importance for ecology, collective animal behaviour has attracted attention from a broad range of other disciplines owing to its ubiquity as an example of non-equilibrium self-organization and its potential utility as a design principle for engineered systems [4–6]. It has thus been the subject of a significant modelling effort over many decades [7–9]. Although individual models vary, most share a set of key assumptions. Chief among these is the notion that the group-level dynamics emerge spontaneously as a consequence of the low-level interactions between individuals [2]. The behaviour of the group can then be viewed as a ‘thermodynamic’ property that arises as the large-number limit of the interactions between individuals, and is expected to be (statistically) universal across different aggregation events.
Animal aggregations in the wild come in many different sizes, ranging from just a few individuals up to potentially millions [10,11]. When the group is very large, the idea that the group behaviour represents some kind of universal state is reasonable, as is the assumption that all the individuals in the group can be treated as interchangeable, uniform agents. But for small groups, these assumptions become more suspect [12], and the group may behave differently [13,14]. One must ask, then, how large an animal aggregation must be before the asymptotic state is reached and the addition of more individuals does not change the dynamics. The answer to this question impacts the modelling of collective animal behaviour by providing a condition on how the model should perform in the low-number limit. But it also has implications for bioinspired engineered systems based on collective animal behaviour, by setting a lower bound on the number of independent agents that must be included before the desired group behaviour will be exhibited.
To explore the small-number limit of collective behaviour, we studied the dynamics of swarms of the non-biting midge Chironomus riparius in the laboratory. We collected data for 344 swarming events, with participating populations ranging from 1 (i.e. single flying midges) to 60. Mating swarms such as these show no overall group ordering [15,16], so we cannot define a relevant macroscopic-order parameter to determine whether an aggregation is a swarm or not. Instead, we measured the statistical properties of the swarms as a function of the number of individuals. Although even the smallest groups show complex behaviour, the statistics do change as the number of individuals in the swarms increases. Surprisingly, however, these statistical changes saturate for small numbers: our results indicate that by order 10 individuals, midge swarms are in the asymptotic, ‘thermodynamic’ limit.
2. Experimental methods
2.1. Insects
We studied the swarming behaviour of C. riparius midges in a self-sustaining laboratory colony. The C. riparius larvae are cultivated in nine tanks containing a thin layer of cellulose sediment and 7 l of water that is dechlorinated and continually oxygenated. Twice a week, the water is replaced, and the larvae are fed 5 g of commercial rabbit food. The development tanks are kept in a cubical enclosure measuring 91 cm on a side that is maintained at a constant 23°C and 50% humidity. After approximately 14 days, the larvae emerge from the water as adults and live for another 2–3 days. The enclosure is illuminated with 16 h of light and 8 h of darkness per day. At each ‘dawn’ and ‘dusk’, male midges gather above a swarm marker and begin to swarm. Note that all swarms begin with a only a few flying males; more males may join the swarm over time, and it can take as long as 20 min for the average number of participating individuals to stabilize. The swarming males are epigamic, attracting females and leading to mating and oviposition [10,17,18].
2.2. Imaging and measurement
The midges swarm over a black matt marker placed in the centre of the enclosure. The marker is thought to provide a visual cue to initiate the swarm [19]. We image the swarm using three hardware-synchronized cameras (Flea3, Point Grey), recording 1 megapixel images at a rate of 100 Hz. Using an array of near-infrared LEDs, the swarms are illuminated at a wavelength that is visible to the cameras but not to the midges, so that their behaviour is not disturbed. Each swarming event is filmed for approximately 1 min.
We reconstruct the three-dimensional trajectories for all individuals in the swarm using techniques originally designed for tracking particles in turbulent fluid flows [20]. In each two-dimensional camera frame, midges are located by segmenting the image; their centres are found using an intensity-weighted centroid. Using these two-dimensional positions as found from each camera and the relative coordinates of the cameras (found by calibration using Tsai's model [21]), we construct an epipolar line of sight for each midge image on each camera. Near intersections, within a small tolerance, of triplets of these epipolar lines give the location of the midges in three-dimensional space. We then link these three-dimensional positions in time using a multi-frame predictive tracking algorithm [20]; short track segments are spliced together by retracking them in a six-dimensional position–velocity space [22]. Once the time-resolved trajectories are known, we compute velocities and accelerations by convolving the trajectories with a Gaussian smoothing and differentiating kernel [23,24]. Derivatives computed using this convolution method are less noisy than what would be obtained from a simple finite-difference scheme. For the data presented here, the convolution kernel was chosen to have a standard deviation of two frames, and the position information from 12 frames was used to calculate each derivative.
3. Results
We recorded midge trajectories and kinematics for 344 swarming events with varying numbers of participating individuals N, ranging from 1 to 60. In general, because individual midges were free to join or leave swarms, N can change with time; we report here the mean value  observed over the entire recording time. Movies for which N changed significantly were not included in our analysis. Swarms were largest at dawn and dusk, but we sometimes observed small swarms consisting of only a few individuals during the middle of the day. On occasion, we were also able to record ‘swarms’ consisting of only a single midge. We note that such single-individual ‘swarms’ can also sometimes be observed in nature [10].
In all cases, the trajectories followed by the midges are complex. Indeed, as shown in figure 1, they are qualitatively indistinguishable for different swarm sizes. Even midges in ‘swarms’ of N = 1 follow paths that are similar to those taken by midges in large swarms. Qualitative considerations are clearly thus not sufficient to determine how the swarm dynamics change as a function of the number of participating individuals. To understand the emergence of asymptotic swarm behaviour, and to test whether such a state even exists, we measured many different statistical properties of the swarms, as reported below, and looked for saturation as the number of individuals increased.
Figure 1.

Example trajectories of single midges from three different swarming events, with (a)  , (b)
, (b)  and (c)
  . All three trajectories are 6.5 s long. The x- and y-directions are in the horizontal plane, and gravity points in the −z-direction. (Online version in colour.)
3.1. Spatial arrangement
Unlike flocks of birds or schools of fish that show net motion and overall velocity polarization, insect mating swarms tend to be stationary and possess no net velocity ordering. The collective nature of the swarm state is manifest instead in its spatial localization: the insects explore only a compact region of space while they are swarming. As a simple first analysis of the bulk swarm properties, then, we can measure how the insects arrange themselves in space.
Because the insects in our swarms are flying, collisions are disadvantageous and the sharp manoeuvres required to avoid a collision when two individuals come close together are energetically costly. Thus, the midges tend to arrange themselves to maintain some empty space in their local neighbourhood, and rarely come closer together than about a wingspan distance [16]. In figure 2, we show the average volume occupied by each individual as a function of the number of midges in the swarms. To calculate this quantity, we first compute the overall swarm volume V by measuring rCM, the mean distance of the midges from the time-averaged centre of mass of the swarm, and defining  . The volume per individual is then given by dividing V by
  , and is thus well defined even in the limit of a single individual. Here and throughout, we compute statistics by first calculating the quantity of interest (the volume per individual, in this case) for each time instant in a given swarm and then averaging over time. Time averages from different swarms of the same size are then averaged together, producing the values reported in the figures; error bars show the standard error of these mean values.
Figure 2.
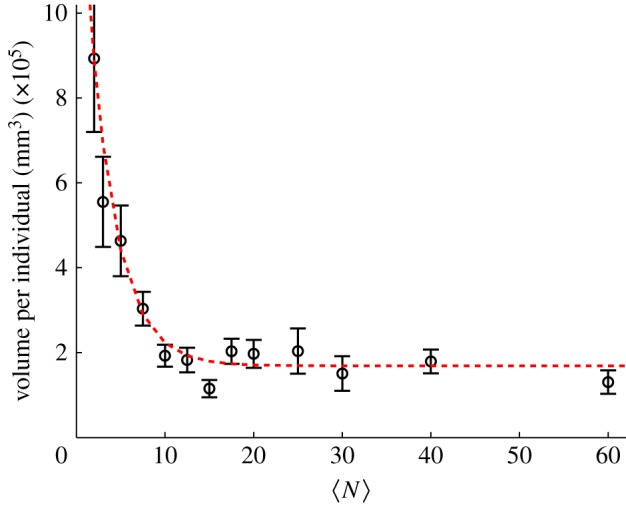
Volume per individual (i.e. the total swarm volume divided by the number of participating individuals) as a function of number of individuals in the swarm. Error bars here and throughout show the standard error of the mean calculated over all measured swarms of the same size. The dashed line is an exponential fit with a characteristic scale (see the main text) of N0 = 3.1 ± 0.8. (Online version in colour.)
For  , the volume per individual plotted in figure 2 appears to become independent of
  ; this result is consistent with our earlier finding that the swarm number density is independent of swarm size [15]. But for small
  , each midge on average occupies more space. To quantify the approach to saturation, we fitted the data in figure 2 with a decaying exponential function of the form
| 3.1 |
where Vind is the volume per individual. The constant B gives the asymptotic value for the volume per individual (in the large-swarm limit), whereas A determines the overall scale of the variation with  . More interesting, though, is the decay constant N0 that quantifies the rate of approach to saturation with increasing swarm size. Thus, although we do not have an a priori theoretical reason to expect exponential decay, an exponential fit is convenient because it allows us to quantify objectively how the volume per individual approaches its asymptotic value. We refer to N0 as the characteristic scale of the approach to this asymptotic limit: by the time the swarm size has reached N0, the volume per individual will be 1 − e−1 ≈ 63% of the way to its large-swarm-size value. Fitting equation (3.1) to the averaged data points shown as circles in figure 2 using a robust nonlinear least-squares algorithm, we find N0 = 3.1 ± 0.8.
A related, though distinct, measure for how the midges arrange themselves in space is the average distance from an individual to its nearest neighbour. As opposed to the volume per individual, the nearest-neighbour distance may be more sensitive to any pairwise interactions present in the swarm (but note that the distance to a neighbour is not defined in the limit of a single individual). Figure 3 shows the average nearest-neighbour distance as a function of  . Like the volume per individual, the nearest-neighbour distance falls off rapidly with swarm size for small swarms, but eventually saturates. We again fitted the data with an exponential of the same form as equation (3.1), and find a characteristic scale of N0 = 8.6 ± 2.0, larger than for the volume per individual but still relatively small.
Figure 3.
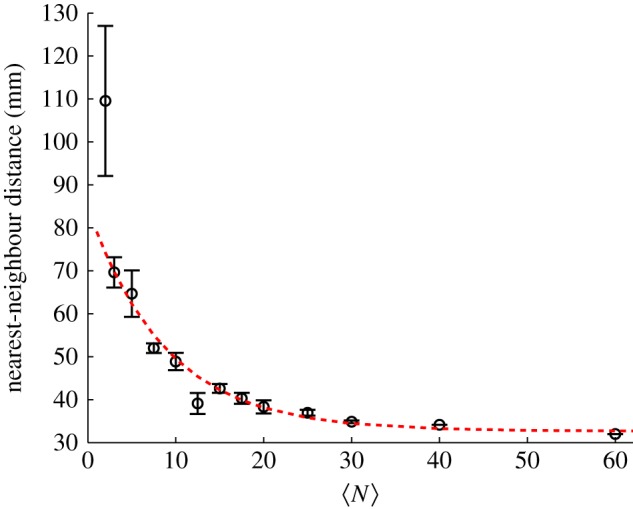
Average distance from a given midge to its nearest neighbour as a function of the number of individuals in the swarm. The dashed line is again an exponential fit with N0 = 8.6 ± 2.0. (Online version in colour.)
3.2. Kinematics
Because we measure not only the spatial structure of the swarms but also the kinematics of each individual, we can study how these kinematic properties change with  . The simplest such property is the mean speed of the individuals, which we show in figure 4. Although there is a trend that midges in very small swarms (with
  ) tend to move faster than midges in larger swarms, the data are noisy and the approach to saturation is very rapid. Again fitting an exponential, we find N0 = 1.2 ± 1.0.
Figure 4.
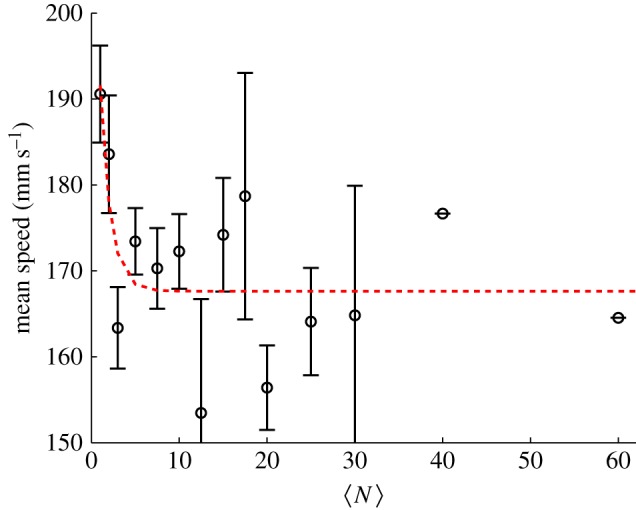
Mean speed of the individual midges as a function of the number of individuals in the swarm. The dashed line is an exponential fit with N0 = 1.2 ± 1.0. (Online version in colour.)
The mean speed, however, is relatively insensitive to the dynamics of the swarms, particularly because the midges tend to be weakly coupled [16]. Kinematic measures that are sensitive to the tails of distributions are more likely to give useful information. We previously reported that the velocity distributions are nearly Gaussian for small swarms, as had been seen in prior work [25], but develop heavy tails for larger swarms [15]—a feature that we argued was indicative of cooperative motion. To quantify how these tails develop as a function of  , we calculated the kurtosis (i.e. the normalized fourth moment, also known as the flatness) of the velocity components. In figure 5, we plot the excess kurtosis, defined to be the difference between the measured velocity kurtosis and the Gaussian value of 3. As with the other quantities we have showed, the excess kurtosis changes rapidly for small
  before approximately saturating. In this case, we find that the excess kurtosis grows with
  , as expected; the velocity distributions for very small
  have slightly sub-Gaussian tails, whereas those for large
  are super-Gaussian. Fitting the excess kurtosis with an exponential, we find N0 = 5.8 ± 1.9.
Figure 5.
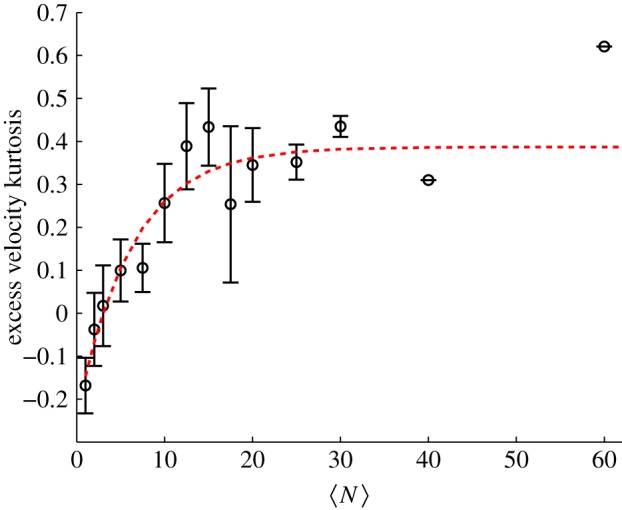
Excess kurtosis of the velocity components (i.e. the difference between the normalized fourth moment of the midge velocity distributions and 3, the kurtosis of a Gaussian distribution), averaged over all three components, as a function of the number of individuals in the swarm. The dashed line is an exponential fit with N0 = 5.8 ± 1.9. (Online version in colour.)
3.3. Free paths
As can be seen in figure 1, the motion of even an isolated midge is complex. The midge trajectories are typically characterized by smoothly varying sections punctuated by sharp turns and reorientations. Many of these rapid manoeuvres are likely to be random, but some may be due to interactions with other insects—and thus may occur more frequently in larger swarms. We locate these ‘scattering’ events by measuring the trajectory curvature [16], defined as κ = |v × a|/|v|3, where v is the velocity and a is the acceleration. Because curvature has a very high dynamic range [26,27], high-curvature events are straightforward to pick out from the background signal by simple peak-finding; here, all local maxima of the curvature larger than 1/30 mm−1 are identified as high-curvature events. We define the trajectory segments between these events as free paths, and measure their statistics to compute a mean free path for each swarm.
We show the evolution of the mean free path with  in figure 6. As anticipated, the mean free path becomes smaller as
  increases, an effect that may be partly due to more interaction between individuals but that is also consistent with the increase in number density for small swarms seen in figure 2. We also note that, for small swarms, the mean free path is nearly as large as the swarm itself, suggesting that the midges behave nearly as free particles. As with all the data we have shown, the mean free path saturates to a constant value as
  grows; fitting an exponential to the data in figure 6, we find N0 = 5.8 ± 2.2.
Figure 6.
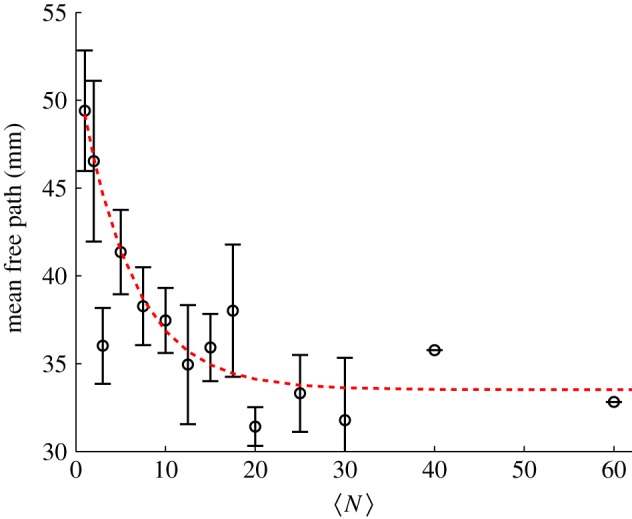
Mean free path between high-curvature events as a function of the number of individuals in the swarm. The dashed line is an exponential fit with N0 = 5.8 ± 2.2. (Online version in colour.)
3.4. Environmental cues
As mentioned above, swarms tend to form in the wild over objects or regions that are visually distinct from their surroundings [28]. In our experiments, we use a piece of black felt as a swarm marker; without such a marker, swarms will not form [19]. It has been suggested that the swarm marker provides an effective confinement for swarming individuals, so that insect swarms are really just a collection of independent individuals rather than a self-organized collective [10], although this viewpoint has recently been disputed [29].
We tested the effect of this external environmental cue on the swarms by using three markers of different sizes and shapes: a square of size 32 × 32 cm, a rectangle of size 16 × 32 cm and a smaller rectangle of size 12 × 24 cm. In figure 7, we show the qualitative effects of these three different markers on the swarm morphology. For small swarms, the shape of the swarm reflects that of the marker: higher aspect-ratio markers produce higher aspect-ratio swarms. But as the swarm size grows, and particularly as it grows larger than the marker, the swarms tend to relax back to a nearly isotropic shape.
Figure 7.
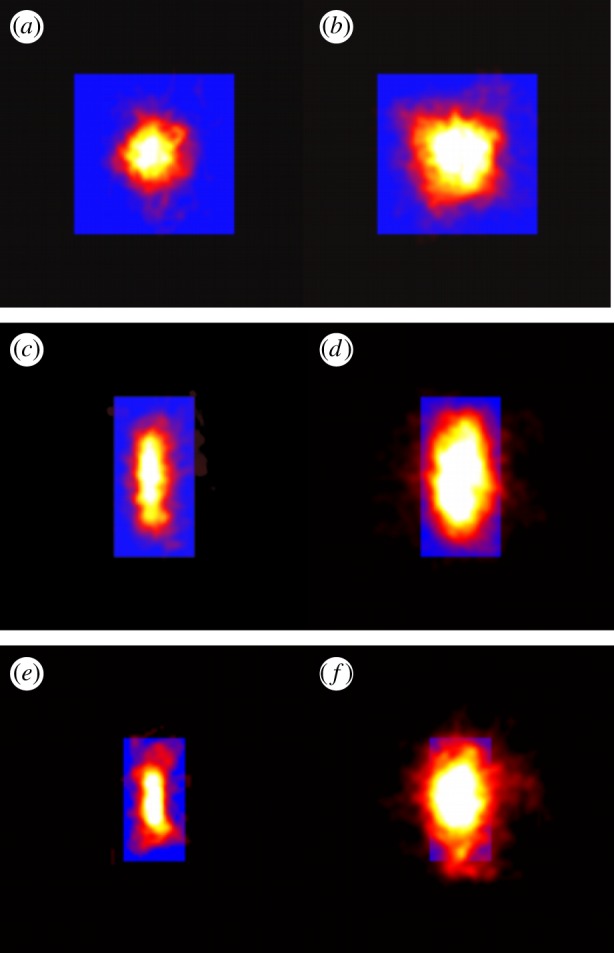
Heat maps showing the likelihood of finding a midge for (a,b) a 32 × 32 cm swarm marker, (c,d) a 16 × 32 cm marker and (e,f) a 12 × 24 cm marker, all as viewed from above, for swarms of (a)  , (b)
, (b)  , (c)
, (c)  , (d)
, (d)  , (e)
, (e)  and (f)
  . The markers are shown as solid-colour rectangles. For small swarms (left column), the swarm shape tracks the shape of the marker, but for larger swarms (right column), the swarms are more isotropic. (Online version in colour.)
We can quantify these effects by measuring the swarm aspect ratios as a function of  for each of the markers, as shown in figure 8. For swarms over the square marker, we see no appreciable change in swarm aspect ratio with
  . But for the two rectangular markers, swarms with small
  are notably differently shaped. As
  increases, however, the aspect ratio of the swarms relaxes back to the value for the square marker, with a characteristic scale of N0 = 3.7 ± 2.1 for the small rectangle and 12.0 ± 8.6 for the large rectangle. Thus, we conclude that even though the swarm marker clearly plays a role for small swarms, its effect becomes less and less important as the swarm size grows. Midge swarms appear to use a swarm marker for nucleation, but once they are large enough the swarms behave as true self-organized states.
Figure 8.
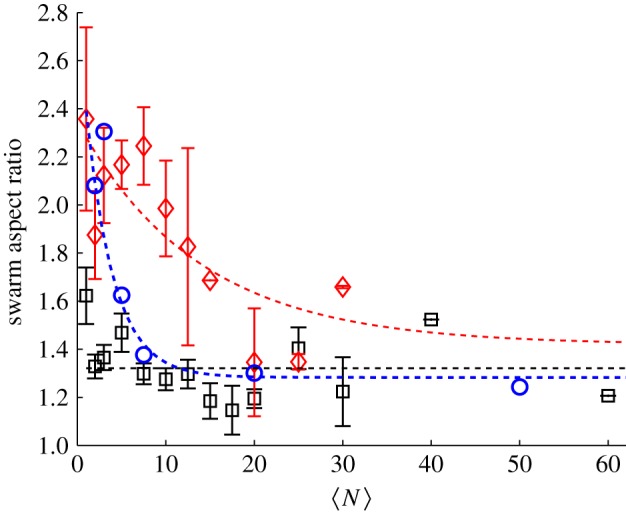
Measured in-plane swarm aspect ratios as a function of the number of individuals participating in the swarm for three different swarm markers: (squares) 32 × 32 cm, (diamonds) 16 × 32 cm and (circles) 12 × 24 cm. As  increases, the swarms over the rectangular markers become more isotropic. The dashed lines are exponential fits, with N0 = 12.0 ± 8.6 for the 16 × 32 cm marker and N0 = 3.7±2.1 for the 12 × 24 cm marker. (Online version in colour.)
4. Discussion and conclusions
By measuring the trajectories of swarming midges for aggregations of varying sizes, we have addressed here a simple question: how large must an insect swarm be before it is asymptotically large? We approached this question by measuring various statistical properties of the swarms as a function of the number of participating individuals  . In all cases, we found that the statistics of the swarm change with
  when
when  is small, but that the statistics rapidly saturate to a constant value as
  becomes larger. The threshold for this asymptotic behaviour is surprisingly small. To estimate it, we fitted all of our data with exponential functions and measured the characteristic scales, finding values that ranged from 1 (for the mean speed of an individual) to 12 (for the effects of a large, anisotropic marker). Thus, our data suggest that, once swarms are of order 10 individuals, they are more or less asymptotically large. In addition, our finding that the influence of the swarm marker decays with
  suggests that our larger swarms are indeed in a real self-organized state [29] rather than being simply a non-interacting collection of individuals exploring the same region of space [10].
Our results have important implications for both modelling and bioinspired design. Models of swarms must be able to replicate the rapid onset of the asymptotic regime we observe; if a model requires a very high number of individuals (or, correspondingly, a high number density) to produce swarming, it is unlikely to describe real swarms correctly. But for engineered multi-agent systems where the desired outcome is organized behaviour, our results are encouraging: only a few agents are required to achieve this state, making this potentially a practical strategy for bioinspired design.
This study also suggests several avenues for future work. Although we observed saturation of all of the statistics we investigated, our largest swarm contained only 60 individuals; midge swarms in nature, however, can contain orders of magnitude more individuals [28]. It would be interesting to extend our analysis to larger swarms, such as those measured in the wild [29]. It will also be interesting to study the approach to asymptotic behaviour in more ordered animal groups such as flocks and schools. Bird flocks must be studied in the field, and so control of the number of individuals in the flock is difficult; but schooling fish can be studied in the laboratory, and thus controlled studies of the schooling behaviour as a function of number of individuals are possible [13]. Recent work has shown that the number of fish in a school affects their ability to avoid predators [30] or sense their environment [31]; the simpler question of the evolution of the group statistics as a function of number of fish would also be interesting to study.
Funding statement
This work was supported by the US Army Research Office under grant no. W911NF-13-1-0426.
References
- 1.Clark CW, Dukas R. 1994. Balancing foraging and antipredator demands: an advantage of sociality. Am. Nat. 144, 542–548. ( 10.1086/285693) [DOI] [Google Scholar]
- 2.Parrish JK, Edelstein-Keshet L. 1999. Complexity, pattern, and evolutionary trade-offs in animal aggregation. Science 284, 99–101. ( 10.1126/science.284.5411.99) [DOI] [PubMed] [Google Scholar]
- 3.Levin S. 2010. Crossing scales, crossing disciplines: collective motion and collective action in the global commons. Phil. Trans. R. Soc. B 365, 13–18. ( 10.1098/rstb.2009.0197) [DOI] [PMC free article] [PubMed] [Google Scholar]
- 4.Grünbaum D. 1998. Schooling as a strategy for taxis in a noisy environment. Evol. Ecol. 12, 503–522. ( 10.1023/A:1006574607845) [DOI] [Google Scholar]
- 5.Amé J-M, Halloy J, Rivault C, Detrain C, Deneubourg JL. 2006. Collegial decision making based on social amplification leads to optimal group formation. Proc. Natl Acad. Sci. USA 103, 5835–5840. ( 10.1073/pnas.0507877103) [DOI] [PMC free article] [PubMed] [Google Scholar]
- 6.Couzin ID. 2009. Collective cognition in animal groups. Trends Cogn. Sci. 13, 36–43. ( 10.1016/j.tics.2008.10.002) [DOI] [PubMed] [Google Scholar]
- 7.Aoki I. 1982. A simulation study on the schooling mechanism in fish. Bull. Jpn Soc. Sci. Fish. 48, 1081–1088. ( 10.2331/suisan.48.1081) [DOI] [Google Scholar]
- 8.Huth A, Wissel C. 1992. The simulation of the movement of fish schools. J. Theor. Biol. 156, 365–385. ( 10.1016/S0022-5193(05)80681-2) [DOI] [Google Scholar]
- 9.Couzin ID, Krause J, James R, Ruxton GD, Franks NR. 2002. Collective memory and spatial sorting in animal groups. J. Theor. Biol. 218, 1–11. ( 10.1006/jtbi.2002.3065) [DOI] [PubMed] [Google Scholar]
- 10.Downes JA. 1969. The swarming and mating flight of Diptera. Annu. Rev. Entomol. 14, 271–298. ( 10.1146/annurev.en.14.010169.001415) [DOI] [Google Scholar]
- 11.Reiczigel J, Lang Z, Rózsa L, Tóthemérész B. 2008. Measures of sociality: two different views of group size. Anim. Behav. 75, 715–721. ( 10.1016/j.anbehav.2007.05.020) [DOI] [Google Scholar]
- 12.Herbert-Read JE, Krause S, Morrell LJ, Schaerf TM, Krause J, Ward AJW. 2013. The role of individuality in collective group movement. Proc. R. Soc. B 280, 20122564 ( 10.1098/rspb.2012.2564) [DOI] [PMC free article] [PubMed] [Google Scholar]
- 13.Partridge BL. 1980. The effect of school size on the structure and dynamics of minnow schools. Anim. Behav. 28, 68–77. ( 10.1016/S0003-3472(80)80009-1) [DOI] [Google Scholar]
- 14.Treherne JE, Foster WA. 1982. Group size and anti-predator strategies in a marine insect. Anim. Behav. 30, 536–542. ( 10.1016/S0003-3472(82)80066-3) [DOI] [Google Scholar]
- 15.Kelley DH, Ouellette NT. 2013. Emergent dynamics of laboratory insect swarms. Sci. Rep. 3, 1073 ( 10.1038/srep01073) [DOI] [PMC free article] [PubMed] [Google Scholar]
- 16.Puckett JG, Kelley DH, Ouellette NT. 2014. Searching for effective forces in laboratory insect swarms. Sci. Rep. 4, 4766 ( 10.1038/srep04766) [DOI] [PMC free article] [PubMed] [Google Scholar]
- 17.Caspary VG, Downe AER. 1971. Swarming and mating of Chironomus riparius (Diptera: Chironomidae). Can. Entomol. 103, 444–448. ( 10.4039/Ent103444-3) [DOI] [Google Scholar]
- 18.Péry ARR, Mons R, Garric J. 2005. Chironomus riparius solid-phase assay. In Small-scale freshwater toxicity investigations (eds Blaise C, Férard J-F.), pp. 437–451. Dordrecht, The Netherlands: Springer. [Google Scholar]
- 19.Downe AER, Caspary VG. 1973. The swarming behaviour of Chironomus riparius (Diptera: Chironomidae) in the laboratory. Can. Entomol. 105, 165–171. ( 10.4039/Ent105165-1) [DOI] [Google Scholar]
- 20.Ouellette NT, Xu H, Bodenschatz E. 2006. A quantitative study of three-dimensional Lagrangian particle tracking algorithms. Exp. Fluids 40, 301–313. ( 10.1007/s00348-005-0068-7) [DOI] [Google Scholar]
- 21.Tsai RY. 1987. A versatile camera calibration technique for high-accuracy 3D machine vision metrology using off-the-shelf TV cameras and lenses. IEEE J. Robot. Autom. 3, 323–344. ( 10.1109/JRA.1987.1087109) [DOI] [Google Scholar]
- 22.Xu H. 2008. Tracking Lagrangian trajectories in position–velocity space. Meas. Sci. Technol. 19, 075105 ( 10.1088/0957-0233/19/7/075105) [DOI] [Google Scholar]
- 23.Mordant N, Crawford AM, Bodenschatz E. 2004. Experimental Lagrangian probability density function measurement. Physica D 193, 245–251. ( 10.1016/j.physd.2004.01.041) [DOI] [Google Scholar]
- 24.Ouellette NT, Xu H, Bodenschatz E. 2007. Measuring Lagrangian statistics in intense turbulence. In Springer handbook of experimental fluid mechanics (eds Tropea C, Foss J, Yarin A.), pp. 789–799. Berlin, Germany: Springer. [Google Scholar]
- 25.Okubo A, Chiang HC. 1974. An analysis of the kinematics of swarming of Anarete pritchardi Kim (Diptera: Cecidomyiidae). Res. Popul. Ecol. 16, 1–42. ( 10.1007/BF02514077) [DOI] [Google Scholar]
- 26.Xu H, Ouellette NT, Bodenschatz E. 2007. Curvature of Lagrangian trajectories in turbulence. Phys. Rev. Lett. 98, 050201 ( 10.1103/PhysRevLett.98.050201) [DOI] [PubMed] [Google Scholar]
- 27.Ouellette NT, Gollub JP. 2008. Dynamic topology in spatiotemporal chaos. Phys. Fluids 20, 064104 ( 10.1063/1.2948849) [DOI] [PubMed] [Google Scholar]
- 28.Armitage PD, Cranston PS, Pinder LCV. (eds). 1995. The Chironomidae: biology and ecology of non-biting midges. London, UK: Chapman and Hall. [Google Scholar]
- 29.Attanasi A, et al. 2014. Collective behaviour without collective order in wild swarms of midges. PLoS Comput. Biol. 10, e1003697 ( 10.1371/journal.pcbi.1003697) [DOI] [PMC free article] [PubMed] [Google Scholar]
- 30.Ward AJW, Herbert-Read JE, Sumpter DJT, Krause J. 2011. Fast and accurate decisions through collective vigilance in fish shoals. Proc. Natl Acad. Sci. USA 108, 2312–2315. ( 10.1073/pnas.1007102108) [DOI] [PMC free article] [PubMed] [Google Scholar]
- 31.Berdahl A, Torney CJ, Ioannou CC, Faria JJ, Couzin ID. 2013. Emergent sensing of complex environments by mobile animal groups. Science 339, 574–576. ( 10.1126/science.1225883) [DOI] [PubMed] [Google Scholar]


