Abstract
In a study on metabolic consumption of photosynthetic electrons and dissipation of excess light energy under water stress, O2 and CO2 gas exchange was measured by mass spectrometry in tomato plants using 18O2 and 13CO2. Under water stress, gross O2 evolution (EO), gross O2 uptake (UO), net CO2 uptake (PN), gross CO2 uptake (TPS), and gross CO2 evolution (EC) declined. The ratio PN/EO fell during stress, while the ratios UO/EO and EC/TPS rose. Mitochondrial respiration in the light, which can be measured directly by 12CO2 evolution during 13CO2 uptake at 3000 µl l–1 13CO2, is small in relation to gross CO2 evolution and CO2 release from the glycolate pathway. It is concluded that PSII, the Calvin cycle and mitochondrial respiration are down‐regulated under water stress. The percentages of photosynthetic electrons dissipated by CO2 assimilation, photorespiration and the Mehler reaction were calculated: in control leaves more than 50 % of the electrons were consumed in CO2 assimilation, 23 % in photorespiration and 13 % in the Mehler reaction. Under severe stress the percentages of electrons dissipated by CO2 assimilation and the Mehler reaction declined while the percentage of electrons used in photorespiration doubled. The consumption of electrons in photorespiration may reduce the likelihood of damage during water deficit.
Key words: Lycopersicon esculentum, tomato, high‐pigment mutant, water stress, oxygen exchange, CO2 assimilation, photorespiration, mitochondrial respiration in the light, Mehler reaction, mass spectrometry
INTRODUCTION
We investigated the effects of water stress on the light reactions of photosynthesis and on the primary metabolism of wild‐type tomato (Lycopersicon esculentum Mill. ‘Moneymaker’) and a high‐pigment hp‐1 mutant with respect to their use of photosynthetic electrons and the consumption of surplus electrons in primary leaf metabolism.
Net CO2 uptake (PN) is the result of CO2 fixation (TPS), CO2 evolution in the glycolate pathway (PR) and CO2 evolution from mitochondrial respiration in the light (RC). The rates of net O2 evolution, which are almost identical to PN, are composed of O2 evolution in the Hill reaction of photosystem II (PSII), O2 uptake by the Mehler reaction and the glycolate pathway and O2 uptake in mitochondrial respiration in the light.
We analysed the contribution of these reactions and pathways to the energy balance in water‐stressed tomato plants by feeding leaves with 18O2 and 13CO2 during steady state photosynthesis. By combining data from CO2 and O2 gas exchange measurements it is possible to determine the rates of the electron‐consuming reactions: CO2 assimilation (including intercellular reassimilation); photorespiration (taking account of mitochondrial CO2 release from dissimilation/respiration); and also the Mehler reaction. Earlier results and theoretical considerations of these mass spectrometric 16O2/18O2 and 12CO2/13CO2 gas exchange studies have been published elsewhere (Haupt‐Herting and Fock, 2000; Haupt‐Herting et al., 2001).
Compared with wild‐type tomato plants, the hp‐1 mutant has darker green foliage and higher contents of chlorophyll, carotenoid and anthocyanin (Adamse et al., 1989) because of an increased sensitivity to far‐red light and activated phytochrome (Kerckhoffs et al., 1997). The hp‐1 gene product, which is less expressed in the mutant, may be an inhibitor of the signal cascade of the phytochrome answer (Peters et al., 1992). As a consequence, the chlorophyll content of mutant leaves is 30 % higher than in the wild type, and light absorption and net photosynthesis are increased (Nieuwhof and van de Dijk, 1988; Peters et al., 1992; Haupt‐Herting, 2000). Enhanced light absorption in the mutant could lead to higher rates of photosynthetic electron transport and therefore necessitate the dissipation of surplus electrons under high light and water deficit. As a consequence, the metabolic reactions that are involved in consumption of surplus electrons may be more distinct in the mutant than in the wild type.
MATERIALS AND METHODS
Plant growth and stress application
Seeds of wild‐type tomato (Lycopersicon esculentum Mill. ‘MoneyMaker’; Hild, Marbach, Germany) and a high‐pigment mutant (hp‐1w; Dr D. Kendrick, Institute for Plant Breeding, Wageningen, The Netherlands) were sown individually in small pots of compost (ED 73, Einheitserdenwerk, Hameln, Germany) and then transferred 7 d after germination to 2·5 l pots containing a mixture of 10 % sand in potting compost. Plants were grown in a growth chamber under moderate light intensity (200 µmol m–2 s–1, fluorescent lamps; Osram, München, Germany) with a 16/8 h light/dark period, temperatures of 23 °C (light)/17 °C (dark) and a constant relative air humidity of 70 %. Plants were watered daily and were regularly supplied with a commercial nutrient solution (Flori 3; Planta Düngemittel, Regenstauf, Germany). The youngest, fully expanded leaf (normally the fifth leaf from the top) of 5‐week‐old plants was used in experiments. Leaves of well‐watered plants had a leaf water potential of –0·6 MPa, measured according to Scholander et al. (1965) using a pressure bomb (Metallwerkstätten der Universität, Kaiserslautern, Germany) just after photosynthetic measurements had been made. To induce an almost natural, reversible water stress allowing the plant enough time to acclimate, irrigation was stopped 2, 5 or 8 d before measurements were taken. These treatments resulted in weak (leaf water potential –0·9 MPa), moderate (–1·3 MPa) or severe (–1·8 MPa) water stress. Even severely stressed plants showed complete recovery of leaf water potential, transpiration and net photosynthesis within 2 d after rewatering.
Gas exchange measurements
Rates of gross O2 evolution (EO) and gross O2 uptake (UO) were determined on attached leaves at photosynthetic steady state in a closed gas exchange system coupled to a mass spectrometer (5970 Series Mass Selective Detec tor; Hewlett‐Packard, Waldbronn, Germany) using 18O2 (Chemotrade, Leipzig, Germany) in the atmosphere (210 ml l–1 18O2 in N2, 350 µl l–1 CO2) as described previously (Canvin et al., 1980; Biehler et al., 1997; Haupt‐Herting and Fock, 2000). In addition, a humidifier, water vapour sensor and a gas phase Clark oxygen electrode (MSIPO; Biolytik, Bochum, Germany) were integrated into the system.
To determine rates of net CO2 uptake, gross CO2 assimilation, gross CO2 evolution (EC), photorespiration and mitochondrial respiration in the light, attached leaves were provided with 13CO2 in an open gas exchange system coupled to a mass spectrometer as described by Haupt‐Herting et al. (2001).
RESULTS AND DISCUSSION
The 12CO2/13CO2 isotope technique
In order to study 12C/13C carbon fluxes, a new gas exchange system was established and its validity tested (Haupt‐Herting et al., 2001). Net CO2 uptake was first determined in relation to light intensity and water stress by conventional 12CO2 gas analysis in an open system with an infrared gas analyser (Fig. 1). As is well documented, PN values increase with increasing light intensities and decline as water stress increases (Lawlor, 1995). Differences in PN between the wild type and the hp‐1 mutant of tomato are significant only in unstressed control plants at saturating light intensities. Higher rates of PN in the mutant may be correlated to the higher chlorophyll content (Nieuwhof and van de Dijk, 1988; Peters et al., 1992).
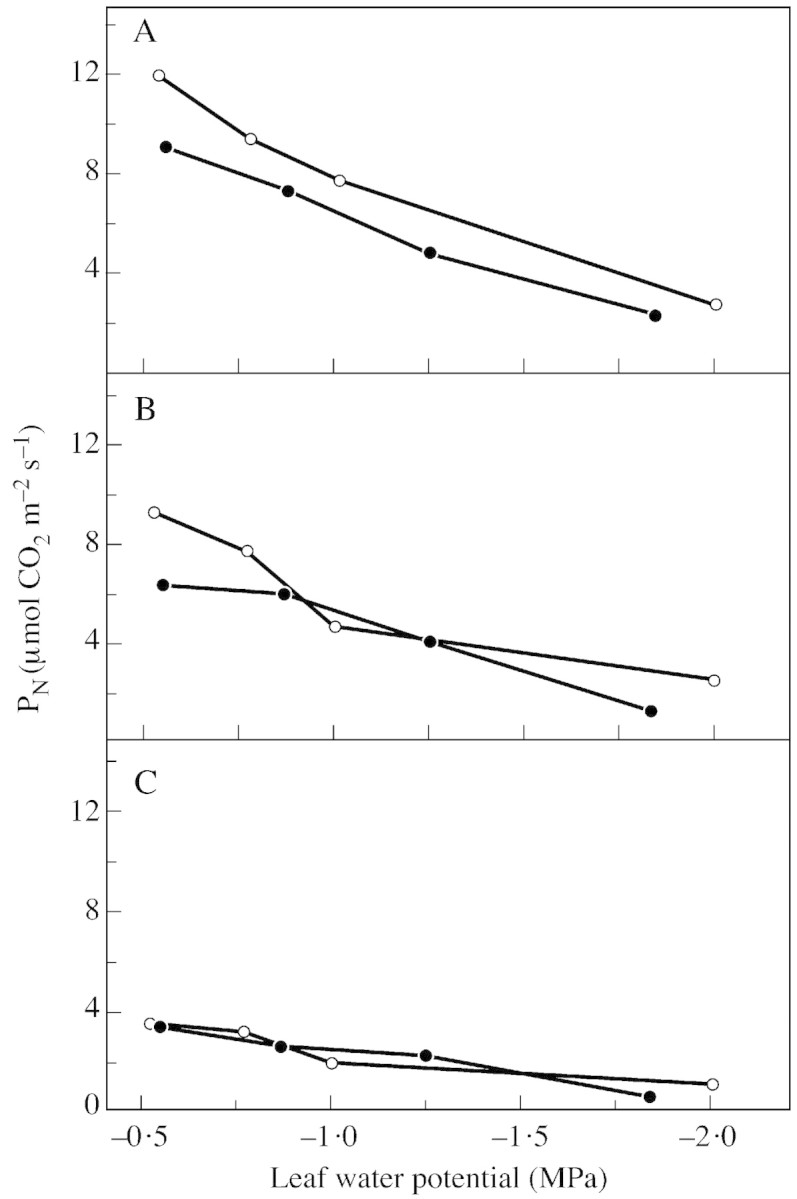
Fig. 1. Net CO2 uptake (PN) by attached leaves of wild‐type tomato (closed circles) and the hp‐1 mutant (open circles) during steady state photosynthesis at three different light intensities [850 (A), 400 (B) and 90 (C) µmol photons m–2 s–1] in relation to leaf water potential. Measurements were made in an open gas exchange system using an infrared gas analyser. Leaves (23 cm2) were supplied with air (gas flow 50 l h–1) containing 350 µl l–1 CO2 and 210 ml l–1 O2 at 70 % relative humidity and 23 °C. Points are means of six replicates (= independent plants); s.e. ≤ 10 %.
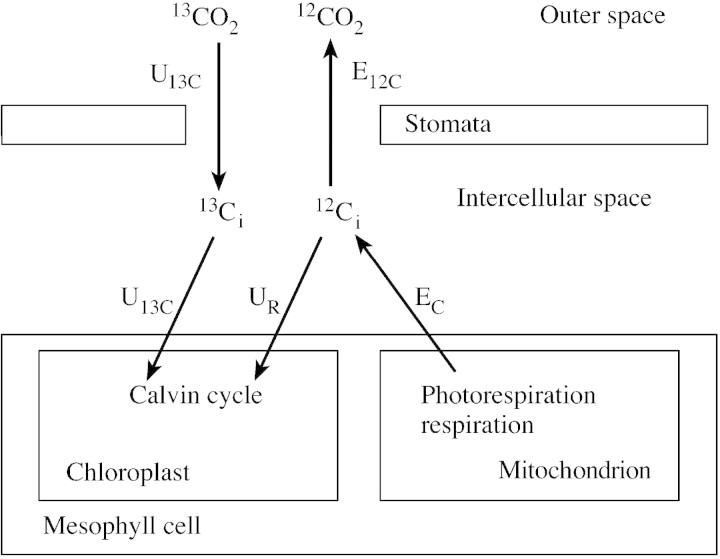
Mass spectrometric measurements of PN, determined as net 12CO2 uptake, show the same rates as conventional measurements with an infrared gas analyser. When 350 µl l–1 12CO2 is replaced by 350 µl l–1 13CO2 in long‐term experiments during steady state photosynthesis, the same rates are obtained. Furthermore, when 12CO2 is replaced by 13CO2 for 1 min, the uptake of 13CO2 into (U13C) and the evolution of 12CO2 (E12C) out of an illuminated leaf are measured (Fig. 2). If reassimilation of evolved CO2 (UR) is considered, gross CO2 uptake (TPS = U13C + UR), net CO2 uptake and gross CO2 evolution (EC = TPS – PN = E12C + UR) can be determined (Haupt‐Herting et al., 2001).
Fig. 2. Scheme of CO2 fluxes into and out of an illuminated leaf provided with 13CO2 in the atmosphere for 1 min. The measurable fluxes of 12CO2 and 13CO2 (E12C, 12CO2 evolution; U13C, gross 13CO2 uptake) outside the leaf and the assumed fluxes inside the leaf (EC, gross 12CO2 evolution; UR, 12CO2 reassimilation) are shown.
Thus, TPS, PN and EC of attached wild‐type tomato leaves were studied in relation to the CO2 concentration around the leaves (Fig. 3). At 350 µl l–1 CO2 and 850 µmol photons m–2 s–1, the rate of net CO2 uptake was 12·4 µmol m–2 s–1 and was similar to PN measured in Fig. 1. Under these conditions, 14·8 µmol CO2 m–2 s–1 were fixed in TPS and 2·4 µmol CO2 m–2 s–1 evolved in gross CO2 evolution. With decreasing CO2 partial pressures from 350 to 220 to 100 µl l–1 CO2, oxygenation was favoured over carboxylation (Lawlor, 1995) and TPS and PN declined. Correspondingly, EC and the ratio of EC/TPS increased. These results are in the same order of magnitude and agree with those reported by Gerbaud and André (1987) for sunflower and bean leaves and those obtained by Stuhlfauth et al. (1990) for Digitalis. The rates of gross CO2 uptake, net CO2 uptake and gross CO2 evolution in the light measured with the new mass spectrometric 12CO2/13CO2 isotope technique changed typically in relation to ambient CO2 (Fig. 3) and O2 (not shown) partial pressures. This is convincing evidence for the validity of the new method.
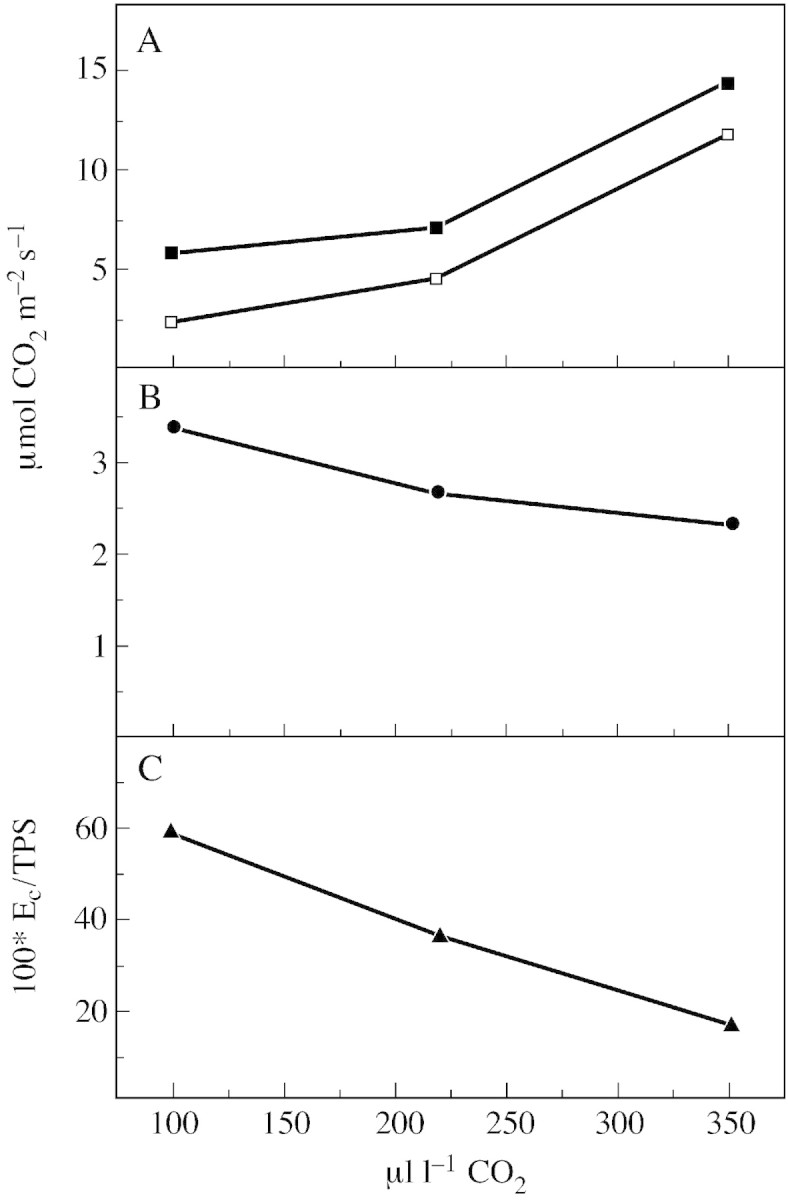
Fig. 3. Rates of gross CO2 uptake (TPS, closed squares), net CO2 uptake (PN, open squares) (A) and gross CO2 evolution in the light (EC) (B) by attached leaves of wild‐type tomato during steady state photosynthesis at saturating light intensity (850 µmol photons m–2 s–1) in relation to ambient CO2. C, Ratio of EC/TPS. Measurements were made in an open gas exchange system using a 12CO2 /13CO2 isotope technique. Leaves (23 cm2) were supplied with air (gas flow 50 l h–1) containing 210 ml l–1 O2 and 350 µl l–1 12CO2, or 250 µl l–1 12CO2 or 100 µl l–1 12CO2 at 70 % relative humidity and 23 °C. When steady state photosynthesis was reached 12CO2 uptake was measured. Then 350 µl l–1 13CO2 (or 250 µl l–1 13CO2 or 100 µl l–1 13CO2) in 21 % O2 was supplied for 1 min and 13CO2 uptake as well as 12CO2 evolution were determined. From mass spectrometer readings, TPS, PN, EC and the ratio of EC/TPS were calculated. Points are means of six replicates; s.e. ≤ 10 %.
Gross O2 evolution and gross O2 uptake
The rate of gross O2 evolution by PSII is used as a measure of the rate of photosynthetically generated electrons, as four electrons traversing the photosystems equal one O2 released. In our experiments leaves were fed 18O2 in ambient air and EO was determined with a mass spectrometer in a closed gas exchange system. Simultaneously, gross oxygen uptake was determined. Net O2 evolution calculated as EO – UO was almost identical to net O2 evolution as measured with a Clark electrode at the same time, and net O2 evolution fitted net CO2 uptake determined under the same conditions (data not shown).
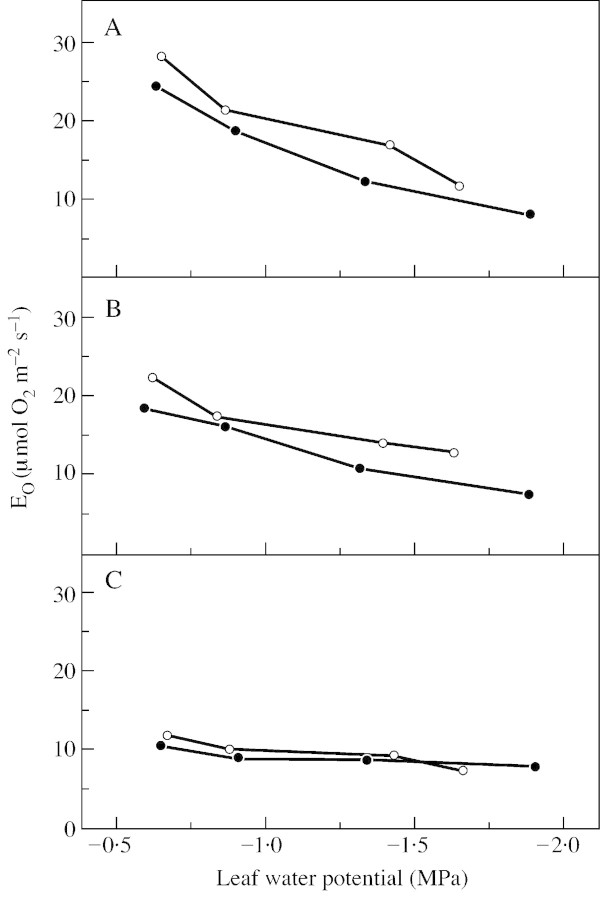
In accordance with earlier experiments on wheat (Gerbaud and André, 1980; Biehler and Fock, 1996), Hirschfeldia and bean leaves (Canvin et al., 1980), EO rose with increasing light intensity (Fig. 4). From low light at 90 µmol photons m–2 s–1 to high light at 850 µmol photons m–2 s–1, EO changed from 10·9 to 24·3 µmol O2 m–2 s–1 in wild‐type controls. EO values of the hp‐1 mutant were slightly higher than those of the wild type in control plants at moderate and high light intensities because of enhanced light absorption. The stimulation of EO by decreasing light, with increasing water deficit, or under saturating light and severe stress (8·1 µmol O2 m–2 s–1) was only a fraction of EO in the controls (24·3 µmol O2 m–2 s–1). In stressed plants differences between the two plant types were not significant.
Fig. 4. Gross oxygen evolution (EO) of attached leaves of wild‐type tomato (closed circles) and the hp‐1 mutant (open circles) during steady state photosynthesis at three different light intensities [850 (A), 400 (B) and 90 (C) µmol photons m–2 s–1] in relation to leaf water potential. Measurements were made in a closed gas exchange system using a mass spectrometric 16O2/18O2 isotope technique. Leaves (23 cm2) were supplied with air (gas flow 50 l h–1) containing 350 µl l–1 CO2 and 210 ml l–1 18O2 in N2 at 70 % relative humidity and 23 °C. Points are means of six replicates; s.e. ≤ 10 %.
The decline of EO and thus the declining flux of photosynthetic electrons in relation to increasing water deficit was also observed on potato leaf discs (Tourneux and Peltier, 1995) and soybean leaves (Thomas and André, 1982). Therefore, the flux of photosynthetic electrons under severe stress is already saturated at low light intensity and charge separation at photosystem II is strongly reduced under these conditions.
The ratios of PN to EO (Haupt‐Herting and Fock, 2000) and TPS to EO (Figs 4 and 6) declined with increasing water deficit. Therefore, a smaller proportion of photosynthetic electrons was consumed by CO2 assimilation in water‐stressed leaves compared with control leaves. Although EO declines under conditions of water deficit with increasing light intensities, there are still excess electrons that must be used up by acceptors other than CO2.
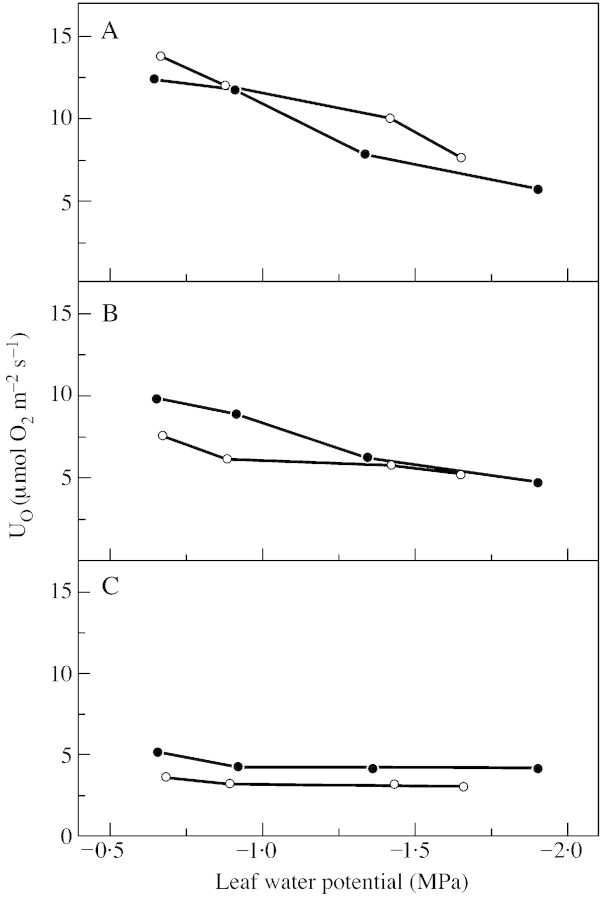
An important alternative acceptor for excess photosynthetic electrons is oxygen. In our experiments, gross oxygen uptake rose with increasing light intensity from 3·8 to 13·8 µmol O2 m–2 s–1 in the controls and from 3·7 to 5·1 µmol O2 m–2 s–1 in severely stressed plants (Fig. 5). Differences in UO between the wild type and the hp‐1 mutant are not significant. The increase in UO with increasing light intensity may be caused by light activation of Rubisco and by elevated rates of ribulose‐bisphosphate oxygenase and glycolate oxidase (Lawlor, 1995; Badger et al., 2000). Oxygenase activity would also be stimulated by a lower intercellular CO2 concentration. In tomato leaves, the intercellular CO2 concentration (Ci) declines with rising light intensities (Haupt‐Herting and Fock, 2000). Alternatively, photosynthetic electrons may be diverted directly to oxygen in the Mehler reaction.
Fig. 5. Gross oxygen uptake (UO) of attached leaves of wild‐type tomato (closed circles) and the hp‐1 mutant (open circles) during steady state photosynthesis at three different light intensities [850 (A), 400 (B) and 90 (C) µmol photons m–2 s–1] in relation to leaf water potential. Measurements were made in a closed gas exchange system using a mass spectrometric 16O2/18O2 isotope technique. For further details see Fig. 4.
In the two tomato genotypes tested, UO declined with increasing water stress (Fig. 5). At high light intensity UO was reduced from 13·8 µmol O2 m–2 s–1 in the well‐watered hp‐1 mutant to 7·5 µmol O2 m–2 s–1 in the stressed plants, and from 12·3 to 5·6 µmol O2 m–2 s–1 in the wild type. Although EO and UO declined with increasing water stress (Figs 4 and 5), the ratio of UO/EO rose. This result, which is in agreement with reports from several laboratories [for a review, see Haupt‐Herting and Fock (2000)], means that a greater proportion of photosynthetic electrons flows to oxygen rather than to CO2 in stressed tomato plants as compared with the controls.
Gross CO2 uptake, net CO2 uptake and gross CO2 evolution in the light
The rates of gross CO2 uptake, net CO2 uptake and gross CO2 evolution were determined at photosynthetic steady state on well‐watered and stressed leaves of the two tomato genotypes by feeding leaves with 13CO2. While data on wild‐type tomatoes have been published elsewhere (Haupt‐Herting et al., 2001), results for the hp‐1 mutant are presented for the first time and discussed below.
With increasing light intensity, TPS in well‐watered controls rose from 5·3 µmol CO2 m–2 s–1 at low light to 14·7 µmol CO2 m–2 s–1 at light saturation, while PN changed from 4·0 to 11·9 µmol CO2 m–2 s–1 (Fig. 6). In saturating light, PN of mutant controls was 32 % higher than that of wild‐type plants. Enhanced CO2 uptake in the mutant could be caused by higher activities of Rubisco (Haupt‐Herting, 2000) and increased electron transport rates (Fig. 4). While differences between the two genotypes were clearly seen in PN, they were less obvious in gross CO2 assimilation: TPS of the mutant was only 15 % higher than TPS of the wild type. This indicates that the ratio of CO2 evolution (e.g. from photorespiration) to CO2 assimilation in the mutant is smaller than that in the wild type. Lowering the leaf water potential from –0·6 MPa in the controls to –1·8 MPa in severely stressed plants led to a significant decrease in leaf conductance (not shown) and internal CO2 (not shown) as well as in TPS and PN. At saturating light and during severe stress, TPS and PN were reduced by approx. 70 and 80 %, respectively; TPS and PN of severely stressed leaves were only slightly stimulated by high light intensity. Consequently, CO2 fixation under water stress is not limited by light but may be impaired by CO2 deficiency because of stomatal closure and/or by inhibition of ATP synthase and photosystem II efficiency or Rubisco activity (Lawlor, 1995; Haupt‐Herting, 2000).
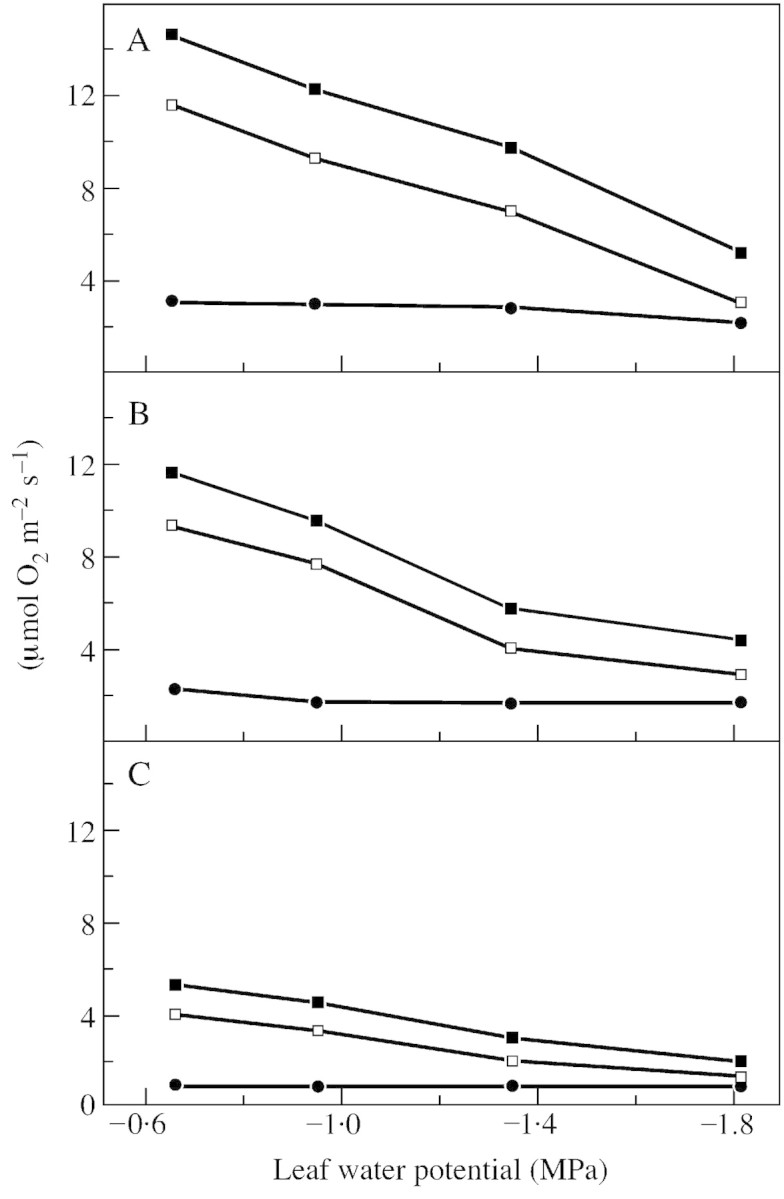
Fig. 6. Rates of steady state net CO2 uptake (PN, open squares), gross CO2 uptake (TPS, closed squares) and gross CO2 evolution (EC, circles) of attached leaves of tomato hp‐1 mutant during steady state photosynthesis at three different light intensities [850 (A), 400 (B) and 90 (C) µmol photons m–2 s–1] in relation to leaf water potential. Measurements were made in an open gas exchange system using a 12CO2/13CO2 isotope technique. Leaves (23 cm2) were supplied with air (gas flow 50 l h–1) containing 210 ml l–1 O2 and 350 µl l–1 12CO2 or 13CO2, respectively, at 70 % relative humidity and 23 °C. Points are means of six replicates; s.e. ≤ 10 %.
CO2 evolution in the light, which is the sum of CO2 evolved by photorespiration and CO2 released by mitochondrial respiration in the light, was enhanced by rising light intensities from 1·3 µmol CO2 m–2 s–1 at low light to 3·4 µmol CO2 m–2 s–1 at saturating light in well‐watered controls (–0·6 MPa) (Fig. 6). Under conditions of severe stress (–1·8 MPa) and light saturation, EC was reduced from 3·4 to 2·0 µmol CO2 m–2 s–1.
Mitochondrial respiration in the light, photorespiration and reassimilation of (photo)respiratory CO2
Gross CO2 evolution in the light (Fig. 6) can be separated into photorespiration and mitochondrial respiration in the light. As PR was inhibited at 3000 µl l–1 CO2, RC was measured as 12CO2 released at 3000 µl l–1 ambient 13CO2 around an attached leaf (Fig. 7) (Haupt‐Herting et al., 2001).
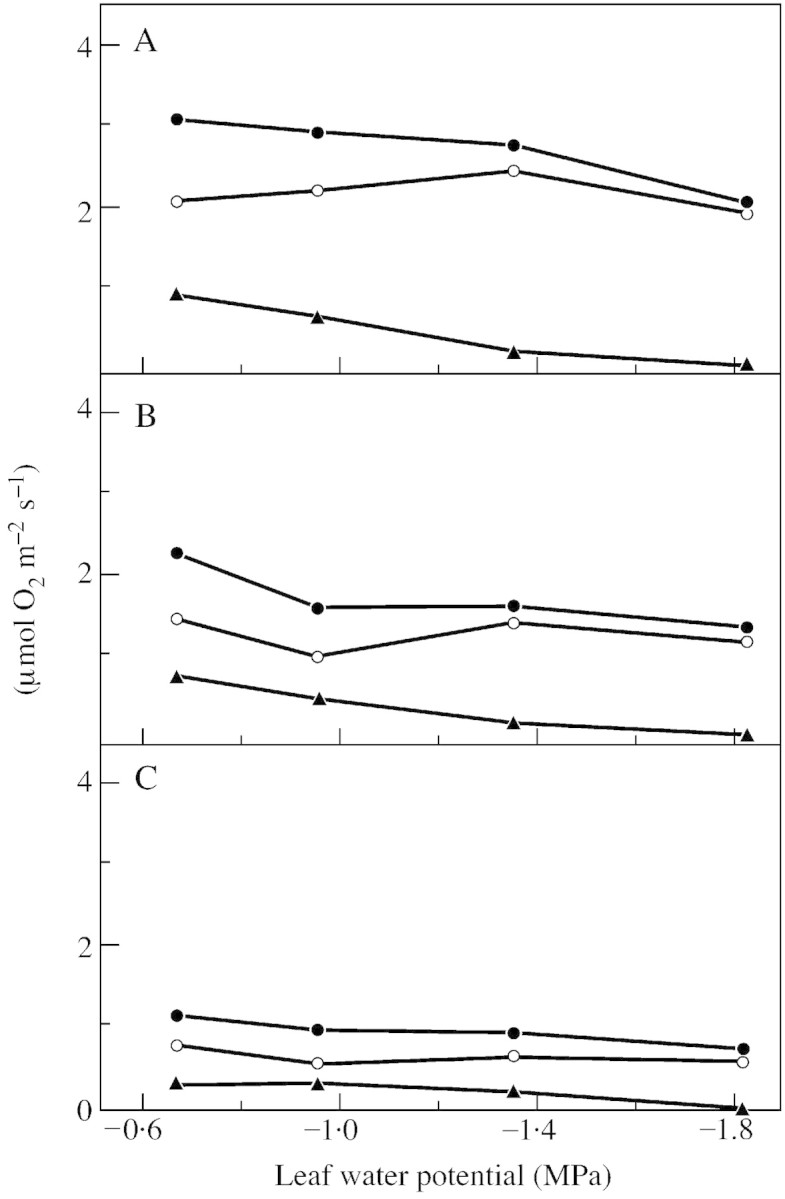
Fig. 7. Rates of steady state gross CO2 evolution (EC, closed circles), photorespiration (PR, open circles) and mitochondrial respiration in the light (RC, triangles) of attached leaves of tomato hp‐1 mutant during steady state photosynthesis at three different light intensities [850 (A), 400 (B) and 90 (C) µmol photons m–2 s–1] in relation to leaf water potential. Measurements were made in an open gas exchange system using a 12CO2 /13CO2 isotope technique. Leaves (23 cm2) were supplied with air (gas flow 50 l h–1) containing 210 ml l–1 O2 at 70 % relative humidity and 23 °C. The CO2 concentration was 350 µl l–1 12CO2 or 13CO2, respectively, for determination of EC, and 3000 µl l–1 12CO2 or 13CO2, respectively, for measurement of RC. PR is calculated from EC and UR. Points are means of six replicates; s.e. ≤ 10 %.
Assuming that RC is not affected by CO2 between 350 and 3500 µl l–1 CO2, measured rates of mitochondrial respiration in the light at 3000 µl l–1 CO2, estimated RC, and estimated PR at 350 µl l–1 CO2 are shown in Fig. 7. RC was correlated with light intensity (0·3 µmol CO2 m–2 s–1 at low and 0·9 µmol CO2 m–1 s–1 at saturating light in the controls) and fell within the range of dark respiratory rates (0·8 µmol CO2 m–2 s–1). Mitochondrial respiration in the light (Fig. 7) as well as in the dark (data not shown) was affected by water deficit; at saturating light RC responded to leaf water potential by decreasing from 0·9 µmol CO2 m–2 s–1 in the controls to 0·1 µmol CO2 m–2 s–1 under severe stress (Fig. 7A). The question of whether RC at 3000 µl l–1 CO2 is similar to RC at 350 µl l–1 CO2 has been discussed thoroughly elsewhere (Haupt‐Herting and Fock, 2001). From this investigation it appears that RC at 350 µl l–1 CO2 is much smaller than PR (Fig. 7).
The rate of photorespiration represents the major part of gross CO2 evolution in the light. PR was affected by light intensity (0·8 µmol CO2 m–2 s–1 under low light and 2·1 µmol CO2 m–2 s–1 under light saturation in well‐watered controls) but not by water deficit (2·1 µmol CO2 m–2 s–1 at –0·6 MPa and 2·0 µmol CO2 m–2 s–1 at –1·8 MPa leaf water potential and light saturation). In saturating light PR was slightly lower in the hp1 mutant (2.1 µmol CO2 m–2 s–1) than in the wild type (2.8 µmol CO2 m–2 s–1) and the ratio of PR to TPS was markedly smaller in the mutant (Fig. 8) than in the wild type (Haupt‐Herting et al., 2001). Whether this is caused by differences in CO2 and O2 concentrations around Rubisco or altered Rubisco characteristics is unclear and should be investigated further.
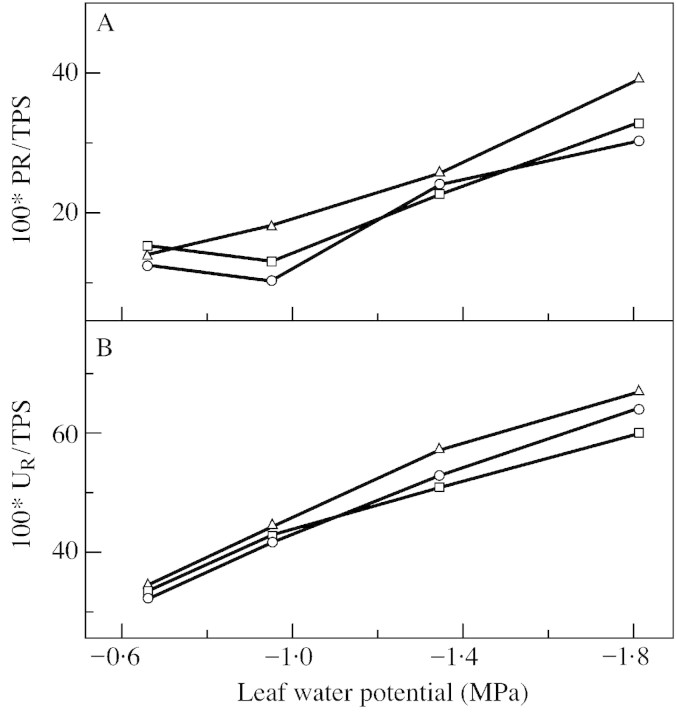
Fig. 8. Ratio of PR/TPS (A) and UR/TPS (B) of attached leaves of tomato hp‐1 mutant during steady state photosynthesis in relation to leaf water potential at 90 (squares), 400 (circles) and 850 (triangles) µmol photons m–2 s–1. Measurements were made in an open gas exchange system using a 12CO2/13CO2 isotope technique. Values are from Figs 6 and 7.
It is interesting that PR does not increase with water deficit as it does when the ambient CO2 concentration is decreased (Fig. 3). This suggests that the inhibition of photosynthesis observed during water deficit can only partly be explained by stomatal limitations. Both non‐stomatal inhibition of PN and the missing increase of PR could be caused by inhibition of Rubisco activity (Lawlor, 1995; Haupt‐Herting, 2000) or a deficiency of ribulose‐1,5‐bisphosphate (Gimenez et al., 1992; Gunasekera and Berkowitz, 1993; Tezara et al., 1999), and, therefore, reduced flux through the glycolate pathway. As PR is less reduced by water deficit than TPS, the ratio of PR to TPS rises with decreasing leaf water potential (Fig. 8A). This was observed under all light intensities studied and indicates that the flux of carbon through the glycolate pathway is stimulated under water deficit relative to the flux of carbon in the Calvin cycle.
The CO2 released by the glycolate pathway and by mitochondrial respiration in the light (Fig. 2) is mixed with CO2 from the atmosphere in the intercellular space. Before leaving the leaf, EC is partly reassimilated (Fig. 2). Reassimilation of (photo)respiratory 12CO2 in relation to gross CO2 assimilation (TPS = U13C + UR) is slightly increased by light intensity and strongly enhanced by water deficit (Fig. 8B). Reassimilation of (photo)respiratory CO2 consumes additional ATP and reducing equivalents. Therefore, increased rates of reassimilation under water stress can be interpreted as contributing to dissipation of excess electrons (Fock et al., 1992). In addition, reassimilation maintains carbon flux and enzymatic substrate turnover, which enables the plant to recover rapidly after rewatering (Stuhlfauth et al., 1990).
Heterogeneity of leaf photosynthesis would influence the calculations of reassimilation, but in tomato leaves no patchiness occurs under water stress (Haupt‐Herting, 2000).
Oxygen consumption in the Mehler reaction
The rate of net oxygen consumption in the Mehler reaction can be calculated by subtracting the rates of oxygen uptake in photorespiration (rate of photorespiratory CO2 evolution in Fig. 7 multiplied by three) and mitochondrial respiration in the light (RC value in Fig. 7, assuming that the rate of CO2 evolution equals the rate of O2 uptake; for discussion of possible deviations from this assumption, see Haupt‐Herting et al., 2001) from gross O2 uptake (Fig. 5), according to Biehler and Fock (1996). These rates must be corrected for oxygen formation by superoxide dismutase in the Halliwell–Asada cycle (Asada, 1999) to obtain the rate of photoreduction of O2 (MR). In our experiments, the rate of photoreduction of O2 rises with increasing light intensity from 1·4 µmol O2 m–2 s–1 at low light to 7·3 µmol O2 m–2 s–1 at high light in wild‐type control plants (data not shown). Differences between the wild type and the hp‐1 mutant are significant only in control plants under high light (13·0 µmol O2 m–2 s–1 for hp‐1 mutant at 850 µmol photons m–2 s–1). These faster rates of the Mehler reaction accompany a nearly doubled activity of O2 scavenging enzymes such as superoxide dismutase, monodehydroascorbate reductase and dehydroascorbate reductase in the mutant compared with the wild type (Haupt‐Herting, 2000).
With increasing water deficit, MR declines in both plant types, especially under saturating light intensities (1·8 µmol O2 m–2 s–1 at severe stress). The rate of photoreduction might depend mainly on the electron transport rate so that MR follows the course of photosystem II activity represented by EO (Fig. 4) in relation to light intensity and water deficit.
Balance between formation and consumption/dissipation of photosynthetic electrons
To analyse the contribution of photosynthetic electrons to the processes that consume/dissipate reducing power, electron formation by PSII on the one hand and electron consumption/dissipation by the Calvin cycle, the glycolate pathway and the Mehler reaction on the other are considered. The rate of photosynthetically generated electrons is derived from Fig. 4 (electrons formed = EO × 4). At saturating light approx. 28 × 4 = 112 µmol electrons m–2 s–1 are transported through the photosystems in control leaves of the hp‐1 mutant (= 100 % in Fig. 9C). In these calculations refixation of photosynthetic oxygen (Biehler and Fock, 1996), which may increase total flux of electrons to some extent, has been neglected.
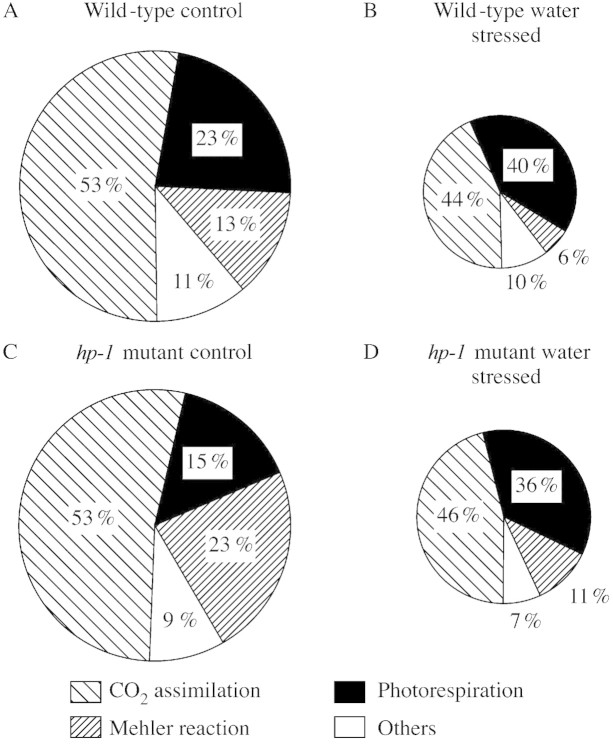
Fig. 9. Photosynthetic electrons (%) consumed/dissipated by CO2 assimilation (TPS), photorespiration (PR), the Mehler reaction and other reactions at 850 µmol photons m–2 s–1 in controls (–0·6 MPa) and water‐stressed (–1·8 MPa) wild type tomato (A, B) and the hp‐1 mutant (C, D). The area of the circles represents 100 % of photosynthetic electrons formed; these are 97 (A) and 32 (B) µmol e– m–1 s–1 in wild‐type leaves, and 112 (C) and 45 (D) µmol e– m–1 s–1 in leaves of the hp‐1 mutant (see Fig. 4). The fractions of electrons (%) that are consumed/dissipated by different reactions are derived from Fig. 6 and from Haupt‐Herting et al. (2001) for CO2 assimilation (TPS), and from Figs 5 and 7 for photorespiration (PR) and the Mehler reaction (MR). Electron consumption that cannot be allocated to specific reactions is termed ‘others’.
We then discuss the substrates and pathways that consume/dissipate photosynthetic electrons. The main electron consumer in photosynthesis is CO2 (in TPS). The stochiometry of electron consumption to CO2 assimilation is still controversial in the current literature; we use a stochiometry of four electrons consumed per CO2 fixed as an approximation. Higher ratios of electron consumption to gross CO2 uptake, as found by Flexas et al. (1999), would result in a higher percentage of electrons used up in CO2 fixation and a smaller percentage left for so‐called ‘other’ reactions (see below). The amounts of electrons consumed in photorespiration or in the Mehler reaction are calculated from O2 measurements and are not influenced by the electron‐per‐CO2 ratio used. At light saturation, 14·7 µmol CO2 m–2 s–1 were fixed in the controls of the hp‐1 mutant (Fig. 6, TPS); this is equivalent to 14·7 × 4 = 58·8 µmol electrons m–2 s–1 or 53 % of photosynthetic electrons being consumed by CO2 assimilation in the Calvin cycle (Fig. 9C). Photorespiration equalled 2·1 µmol CO2 m–2 s–1 in the controls. Consequently, 2·1 × 8 = 16·8 µmol electrons m–2 s–1 or 15 % of photosynthetic electrons are dissipated in the photorespiratory pathway (including ammonium reassimilation).
In the Mehler reaction two O2 molecules are reduced by two photosynthetic electrons to form two superoxide radical anions, which are converted into O2 + H2O2 by superoxide dismutase. Scavenging of H2O2 in the Halliwell–Asada cycle leads to the formation of two molecules of monodehydroascorbate that are reduced to ascorbate by monodehydroascorbate reductase under consumption of two electrons (Asada, 1999). Therefore, a stochiometry of two electrons per O2 reduced can be assumed. In the case that monodehydroascorbate reductase uses NADH as an electron donor instead of NADPH, the consumption of photosynthetic electrons would be smaller. The rate of electron consumption resulting from photoreduction of O2 is calculated to be 13·0 × 2 = 26 µmol electrons m–2 s–1 or 23 % of photosynthetic electrons. The remaining 9 % of the photosynthetic electrons which cannot be allocated to CO2 assimilation, photorespiration or the Mehler reaction are summarized as ‘others’ (Fig. 9C).
Under conditions of severe stress and light saturation, the distribution of photosynthetic electrons is as follows: in leaves of the hp‐1 mutant 11·2 × 4 = 44·8 µmol electrons m–2 s–1 are generated by photosystem II (= 100 % in Fig. 9D). Of these, 46 % support CO2 assimilation, 36 % are used in photorespiration and 11 % are dissipated by the Mehler reaction (Fig. 9D).
The allocation of photosynthetic electrons to primary metabolism in leaves of wild‐type tomato is shown in Fig. 9A and B. The values for this presentation are derived from Figs 4 and 5 and from Haupt‐Herting et al. (2001).
It follows from Fig. 9 that more than half of the photosynthetic electrons are consumed by CO2 assimilation (TPS; including reassimilation) in control leaves of the wild type as well as the hp‐1 mutant. A minor proportion of the photosynthetic electrons is used in photorespiration. A small fraction of electrons is consumed in other reactions and the rest are transported to O2 in the Mehler reaction. Electron consumption in ‘other’ reactions might include nitrate and sulfate assimilation, synthesis of fatty acids and reduction of glutathione and ascorbate.
Under conditions of severe stress the flux of photosynthetic electrons is strongly reduced in both genotypes (8·1 × 4 = 32·4 µmol electrons m–2 s–1 in the wild type and 11·2 × 4 = 44·8 µmol electrons m–2 s–1 in the hp‐1 mutant). Because of water stress limitations, the proportion of electrons that is required for CO2 assimilation declines with increasing water deficit. This fraction would be even smaller if reassimilation of (photo)respiratory CO2 was not enhanced in stressed plants. Consequently, the flux of electrons to the photorespiratory pathway (40 % in stressed wild‐type leaves and 36 % in stressed leaves of the hp‐1 mutant; Fig. 9B and D) is increased in relation to TPS. The proportion of electrons dissipated in the Mehler reaction declines under stress in both plant types while the fraction used up in other reactions remains unchanged.
The activity of the Mehler reaction in tomato leaves is higher than expected from earlier publications (Badger et al., 2000). Experiments involving transgenic tobacco with reduced Rubisco capacity show no extra electron transport to alternative acceptors such as the Mehler reaction (Ruuska et al., 2000) and various studies on electron transport and O2 uptake under different stresses and CO2 conditions indicate that the Mehler reaction is only a minor component of O2 uptake compared with photorespiration (Badger et al., 2000). On the other hand, the percentages of electrons consumed in the Mehler reaction in tomato leaves shown here are in the same order of magnitude as those published for water‐stressed Triticum aestivum by Biehler and Fock (1996). In our study, MR values are calculated from given O2 consumption by mitochondrial respiration in the light (measured as CO2 evolution). If respiratory O2 consumption does not equal CO2 release, e.g. because of significant malate‐valve activity, MR could be slightly overestimated. Another explanation for the unexpectedly high rates of the Mehler reaction could lie in the growth conditions that were similar for Triticum (Biehler and Fock, 1996) and tomato but which differed from those of tobacco (higher light intensities, fluctuations of temperature and relative humidity) in Ruuska et al. (2000). The values for non‐photochemical quenching in severely stressed tomato plants presented in Haupt‐Herting and Fock (2000) indicate a low capacity for thermal dissipation. It is possible that our plants have to dissipate more energy through PR and MR than other plants, having developed a higher capacity for thermal dissipation because of more severe growth conditions.
However, our experiments show that in water‐stressed tomato leaves the photorespiratory pathway plays the major role in the use of photosynthetic electrons that are not consumed by CO2 assimilation. In the mutant, in particular, which, under control conditions dissipates only a minor proportion of electrons in photorespiration compared with the Mehler reaction, photorespiration becomes more important than the Mehler reaction during water deficit. This is in accordance with earlier postulations that photorespiration is essential and more effective than the Mehler reaction in protecting plants against photodamage under excessive light intensities or water deficit (Wu et al., 1991; Heber et al., 1996; Badger et al., 2000). On the other hand, our results partly contradict the findings of Biehler and Fock (1996) who reported that oxygen in the Mehler reaction was an important sink for reducing power in stressed wheat leaves when photosynthetic electrons were in excess of demand.
CONCLUSIONS
It is concluded that photosystem II, the Calvin cycle and mitochondrial respiration are down‐regulated under water stress in both wild‐type tomato and the hp1‐mutant. In stressed leaves, photodamage may be avoided by dissipating excess photosynthetic electrons, especially in the photosynthetic oxidation cycle rather than in the Mehler reaction.
The reasons for differences in the rates of photorespiration and the Mehler reaction between control plants of the wild type and hp‐1 mutant, especially in terms of Rubisco characteristics and O2 scavenging enzymes, should be investigated further.
ACKNOWLEDGEMENT
We thank Dr D. W. Lawlor (IACR‐Rothamsted, Harpenden, UK) for valuable suggestions.
Supplementary Material
Received: 1 June 2001; Returned for revision: 10 September 2001; Accepted: 17 October 2001.
References
- AdamseP, Peters JL, Jaspers PAPM, van Tuinen A, Koorneef M, Kendrick RE.1989. Photocontrol of anthocyanin synthesis in tomato seedlings: a genetic approach. Photochemistry and Photobiology 50: 107–111. [Google Scholar]
- AsadaK.1999. The water‐water cycle in chloroplasts: scavenging of active oxygen and dissipation of excess photons. Annual Review of Plant Physiology and Plant Molecular Biology 50: 601–639. [DOI] [PubMed] [Google Scholar]
- BadgerMR, von Caemmerer S, Ruuska S, Nakano H.2000. Electron flow to oxygen in higher plants and algae: rates and control of direct photoreduction (Mehler reaction) and rubisco oxygenase. Philosophical Transactions of the Royal Society of London B 355: 1433–1446. [DOI] [PMC free article] [PubMed] [Google Scholar]
- BiehlerK, Fock H.1996. Evidence for the contribution of the Mehler peroxidase reaction in dissipating excess electrons in drought‐stressed wheat. Plant Physiology 112: 265–272. [DOI] [PMC free article] [PubMed] [Google Scholar]
- BiehlerK, Haupt S, Beckmann J, Fock H, Becker TW.1997. Simultaneous CO2‐ and 16O2/18O2‐gas exchange and fluorescence measurements indicate differences in light energy dissipation between the wild‐type and the phytochrome‐deficient aurea mutant of tomato during water stress. Journal of Experimental Botany 48: 1439–1449. [Google Scholar]
- CanvinDT, Berry JA, Badger MR, Fock H, Osmond CB.1980. Oxygen exchange in leaves in the light. Plant Physiology 66: 302–307. [DOI] [PMC free article] [PubMed] [Google Scholar]
- FlexasJ, Badger M, Chow WS, Medrano H, Osmond CB.1999. Analysis of the relative increase in photosynthetic O2 uptake when photosynthesis in grapevine leaves is inhibited following low night temperature and/or water stress. Plant Physiology 121: 675–684. [DOI] [PMC free article] [PubMed] [Google Scholar]
- FockHP, Biehler K, Stuhlfauth T.1992. Use and degradation of light energy in water stressed Digitalis lanata Photosynthetica 27: 571–577. [Google Scholar]
- GerbaudA, André M.1980. Effect of CO2, O2, and light on photosynthesis and photorespiration in wheat. Plant Physiology 66: 1032–1036. [DOI] [PMC free article] [PubMed] [Google Scholar]
- GerbaudA, André M.1987. An evaluation of the recycling in measurements of photorespiration. Plant Physiology 83: 933–937. [DOI] [PMC free article] [PubMed] [Google Scholar]
- GiménezC, Mitchell VJ, Lawlor DW.1992. Regulation of photosynthetic rate of two sunflower hybrids under water stress. Plant Physiology 98: 516–524. [DOI] [PMC free article] [PubMed] [Google Scholar]
- GunasekeraD, Berkowitz GA.1993. Use of transgenic plants with ribulose‐1,5‐bisphosphate carboxylase/oxygenase antisense DNA to evaluate the rate limitation of photosynthesis under water stress. Plant Physiology 103: 629–635. [DOI] [PMC free article] [PubMed] [Google Scholar]
- Haupt‐HertingS.2000. Nutzung und Entwertung von Lichtenergie in höheren Pflanzen: Die Auswirkungen von Trockenstreß auf den Primärstoffwechsel von Lycopersicon esculentum und einer high‐pigment Mutante. PhD thesis, University of Kaiserlautern, Kaiserslautern, Germany. [Google Scholar]
- Haupt‐HertingS, Fock HP.2000. Exchange of oxygen and its role in energy dissipation during drought stress in tomato plants. Physiologia Plantarum 110: 489–495. [Google Scholar]
- Haupt‐HertingS, Klug K, Fock HP.2001. A new approach to measure gross CO2 fluxes in leaves: gross CO2 assimilation, photorespiration and mitochondrial respiration in the light in tomato under drought stress. Plant Physiology 126: 388–396. [DOI] [PMC free article] [PubMed] [Google Scholar]
- HeberU, Bligny R, Streb P, Douce R.1996. Photorespiration is essential for the protection of the photosynthetic apparatus of C3 plants against photoinactivation under sunlight. Botanica Acta 109: 307–315. [Google Scholar]
- KerckhoffsLHJ, de Groot NAMA, van Tuinen A, Schreuder MEL, Nagatani A, Koorneef M, Kendrick RE.1997. Physiological characterization of exaggerated photoresponse mutants of tomato. Journal of Plant Physiology 150: 578–587. [Google Scholar]
- LawlorDW.1995. Effects of water deficit on photosynthesis. In: Smirnoff N, ed. Environment and plant metabolism Oxford: Bios Scientific Publishers Ltd, 129–160. [Google Scholar]
- NieuwhofM, van de Dijk SJ.1988. Differences between genotypes of tomato (Lycopersicon esculentum Mill.) in net photosynthesis, light absorption by leaves, chlorophyll content and specific leaf fresh weight under low‐energy conditions. Netherlands Journal of Agricultural Science 36: 396–399. [Google Scholar]
- PetersJL, Schreuder MEL, Verduin SJW, Kendrick RE.1992. Physiological characterization of a high‐pigment mutant of tomato. Photochemistry and Photobiology 56: 75–82. [Google Scholar]
- RuuskaSA, Badger MR, Andrews TJ, von Caemmerer S.2000. Photosynthetic electron sinks in transgenic tobacco with reduced amounts of rubisco: little evidence for significant Mehler reaction. Journal of Experimental Botany 51: 357–368. [DOI] [PubMed] [Google Scholar]
- ScholanderPF, Hammel HT, Bradstreet ED, Hemmingsen EA.1965. Sap pressure in vascular plants. Science 148: 339–346. [DOI] [PubMed] [Google Scholar]
- StuhlfauthT, Scheuermann R, Fock HP.1990. Light energy dissipation under water stress conditions. Contribution of reassimilation and evidence for additional processes. Plant Physiology 92: 1053–1061. [DOI] [PMC free article] [PubMed] [Google Scholar]
- TezaraW, Mitchell VJ, Driscoll SD, Lawlor DW.1999. Water stress inhibits plant photosynthesis by decreasing coupling factor and ATP. Nature 401: 914–917. [Google Scholar]
- ThomasDA, André M.1982. The response of oxygen and carbon dioxide exchanges and root activity to short term water stress in soybean. Journal of Experimental Botany 33: 393–405. [Google Scholar]
- TourneuxC, Peltier G.1995. Effect of water deficit on photosynthetic oxygen exchange measured using 18O2 and mass spectrometry in Solanum tuberosum l. leaf discs. Planta 195: 570–577. [Google Scholar]
- WuJ, Neimanis S, Heber U.1991. Photorespiration is more effective than the Mehler reaction in protecting the photosynthetic apparatus against photoinhibition. Botanica Acta 104: 283–291. [Google Scholar]
Associated Data
This section collects any data citations, data availability statements, or supplementary materials included in this article.


