Abstract
Land plants encountering low water potentials (low Ψw) close their stomata, restricting CO2 entry and potentially photosynthesis. To determine the impact of stomatal closure, photosynthetic O2 evolution was investigated in leaf discs from sunflower (Helianthus annuus L.) plants after removing the lower epidermis at low Ψw. Wounding was minimal as evidenced by O2 evolution nearly as rapid as that in intact discs. O2 evolution was maximal in 1 % CO2 in the peeled discs and was markedly inhibited when Ψw was below –1·1 MPa. CO2 entered readily at all Ψw, as demonstrated by varying the CO2 concentration. Results were the same whether the epidermis was removed before or after low Ψw was imposed. Due to the lack of an epidermis and ready movement of CO2 through the mesophyll, the loss in O2 evolving activity was attributed entirely to photosynthetic metabolism. Intact leaf discs showed a similar loss in activity when measured at a CO2 concentration of 5 %, which supported maximum O2 evolution at low Ψw. In 1 % CO2, however, O2 evolution at low Ψw was below the maximum, presumably because stomatal closure restricted CO2 uptake. The inhibition was larger than in peeled discs at Ψw between –1 and –1·5 MPa but became the same as in peeled discs at lower Ψw. Therefore, as photosynthesis began to be inhibited by metabolism at low Ψw, stomatal closure added to the inhibition. As Ψw became more negative, the inhibition became entirely metabolic.
Key words: Photosynthesis, water potential, epidermis, oxygen evolution, stomata, dehydration, carbon dioxide, Helianthus annuus L., sunflower
INTRODUCTION
When plants encounter water deficits their stomata close, thus reducing water loss from the leaves. This limits CO2 entry and could potentially limit photosynthetic carbon reduction. In some (Robinson et al., 1988; Cornic et al., 1989; Frederick et al., 1990; Quick et al., 1992), but not all studies (Ben et al., 1987; Graan and Boyer, 1990; Wise et al., 1992; Saccardy et al., 1996; Kanechi et al., 1998; Escalano et al., 1999; Tezara et al., 1999), raising the CO2 concentration to overcome this diffusive barrier resulted in a complete recovery of photosynthesis. Even in a single species such as sunflower, some reports suggest a stomatal limitation to photosynthesis (Ben et al., 1987; Quick et al., 1992), while others do not (Boyer, 1971a; Kanechi et al., 1998; Tezara et al., 1999). There is thus general agreement that an inhibition is present but the reasons for it are controversial.
Studies of desiccated algae show that photosynthesis can be inhibited even though no stomata are present (Davison and Pearson, 1996; Kawamitsu et al., 2000). Therefore, direct metabolic limitations clearly occur, and much of the controversy rests on whether stomatal closure in leaves is large enough and early enough to restrict CO2 uptake, and thus photosynthesis, before metabolism is inevitably inhibited (Boyer, 1976, 1990; Mansfield et al., 1990; Chaves, 1991).
In an effort to resolve this issue, Vassey et al. (1991) reasoned that low CO2 caused by stomatal closure might trigger metabolic inhibition. When CO2 was kept high during dehydration, they found high activity of the enzyme sucrose phosphate synthase, which was otherwise inhibited in dehydrated Phaseolus leaves. Vassey et al. (1991) therefore concluded that stomatal closure could initiate metabolic inhibition, and that closure was the primary cause of reduced photosynthesis.
These concepts can be tested directly by removing the epidermis. If stomatal closure results in insufficient CO2 for photosynthesis, removing the epidermis will restore CO2 levels and will prevent the inhibition. If CO2 is low initially and triggers metabolic inhibition later, removing the epidermis beforehand will prevent inhibition. In both cases, however, if photosynthesis is still inhibited, it must be limited by factors other than stomatal closure.
Removal of an epidermis caused increased CO2 fixation in sweet potato (Kubota et al., 1992) and mungbean leaves over a wide range of CO2 supply and temperature (Kubota et al., 1996; Tokuda et al., 1999). In the CAM plant Bryophyllum daigremontianum, removing the epidermis had no effect on CO2 fixation when the stomata were open in the dark, but increased fixation when the stomata were tightly closed during the day (Nishida, 1977). The same technique was used to study the effect of abscisic acid (ABA) on photosynthesis of sunflower and broad bean (Terashima et al., 1988). High leaf ABA concentrations closed the stomata, reducing photosynthesis. When the epidermis was removed, photosynthesis recovered completely indicating that stomatal closure accounted for all the photosynthetic inhibition. However, none of these studies have involved water deficit. The only studies involving water deficit of which we are aware (Dietz and Heber, 1983; Schwab et al., 1989) showed that photosynthesis in Primula palinuri and the ‘resurrection’ plant Ramonda mykoni recovered only partially when the epidermis was removed from the dehydrated leaves. Here, we applied the same technique to investigate the role of stomata in the photosynthetic activity of dehydrated sunflower plants.
MATERIALS AND METHODS
Plant materials and growth conditions
Sunflower (Helianthus annuus L. hybrid IS897 from Interstate Seed Company, Box 338, Fargo, ND, USA) plants were grown singly from seed in 19 cm diameter pots filled with a 2 : 1 soil : peat moss mixture with a pH of 6·5. Nutrient solution was provided twice a week and consisted of 6 mol m–3 Ca(NO3)2, 4 mol m–3 KNO3, 2 mol m–3 KH2PO4, 2 mol m–3 MgSO4, 25 mmol m–3 H3BO3, 10 mmol m–3 MnSO4, 2 mmol m–3 ZnSO4, 0·5 mmol m–3 CuSO4, 0·5 mmol m–3 H2MoO4 and 100 mmol m–3 FeNa‐ethylenediamine‐tetraacetic acid. Water was supplied as needed. For plants grown in a glasshouse under natural daylight, average maximal day/night temperatures and relative humidity were 35/15 °C and 30/85 %, respectively. A growth chamber (Environmental Growth Chambers, OH, USA) was also used to grow sunflower at a day/night temperature of 30/20 °C and relative humidity of 60/90 % with a 12 h photoperiod of 700–900 µmol m–2 s–1 of photosynthetically active radiation. In all but one experiment, dehydration was imposed by withholding nutrient solution from the soil for several days. Fully expanded, mature leaves from 5–6‐week‐old plants were sampled for measurements of photosynthesis and water status.
Photosynthesis
The rate of photosynthesis was measured in air as O2 evolution using a gas‐phase Walker‐type oxygen electrode system equipped with a Björkman lamp as a light source [Delieu and Walker (1981), sold as Model LD‐2 from Hansatech Limited, Pentney, UK]. A leaf disc with an area of 4·52 cm2 was placed in the chamber, and the volume of the chamber was calibrated as described by Delieu and Walker (1981). The volume of the chamber was small and, in order to avoid depleting the CO2 during the measurement, we sealed the tissue in the chamber for a short time only. The method involved exposing the tissue to light in a water‐saturated gas mixture flowing through the open electrode chamber for 5 min, then sealing the chamber for 30–60 s to take a measurement, opening the chamber, flushing and repeating the measurement after 5 min. During each 30–60 s measurement, O2 evolution was linear with time and the rate was calculated from the slope of the line. The CO2 partial pressure of the incoming humidified air was controlled by mixing CO2‐free air with air containing either 10 or 60 % CO2. Because leaf temperature rose upon illumination, the temperature of water circulating around the leaf chamber was maintained at 22·1 °C to keep the leaf temperature at 25 ± 0·2 °C under illumination, measured with a fine thermocouple inserted into the leaf disc.
Leaf water status
Immediately after measuring O2 evolution, the leaf water potential (Ψw) was determined on the same disc by isopiestic thermocouple psychrometry in a vapour chamber coated with melted and re‐solidified petroleum jelly (Boyer and Knipling, 1965). The peeled surface of leaf discs was placed face‐down in the psychrometer so that the thermocouple measured vapour coming through the intact epidermis. Measurements were corrected for heat of respiration. When experiments were performed to determine the change of Ψw during an O2 electrode measurement, another disc from the same leaf was used to measure the initial Ψw.
Leaf peeling
A 9·6 cm2 disc was removed from the leaf and fine forceps were used to carefully remove the epidermis under a dissecting microscope inside a sealed glove box containing an atmosphere saturated with water vapour. After peeling, a smaller disc (4·52 cm2) was removed and used to measure O2 evolution and Ψw. In most of the experiments, plants were dehydrated to varying degrees by withholding water from the soil, and afterwards the abaxial epidermis was peeled from the disc used for the measurements. In one experiment, the order was reversed and the disc was peeled before dehydration was imposed.
Microscopy
Leaf tissues of hydrated plants were fixed in CRAF (chromic acid, acetic acid and formalin) solution according to Jensen (1962). The tissues were embedded, sliced and stained with safranin, crystal violet, fast green and gold orange (Triarch Inc., Ripon, WI, USA).
Statistical analysis
All experiments were replicated as indicated. In those experiments where a Ψw was established and monitored for various times or at varying CO2 concentrations, the Ψw differed somewhat between replicates, and single representative experiments are reported. In the other experiments involving single measurements of O2 evolution and Ψw (in the same disc), many measurements were made and all of them are reported to show the total range of variation.
RESULTS
Leaf cross‐sections showed that peeling completely removed the abaxial epidermis and resulted in the collapse of only a few spongy mesophyll cells (Fig. 1B). Evidence of a collapsed cell could be seen, on average, about every 100 µm on the abaxial surface of the mesophyll. Otherwise, in comparison with the intact disc (Fig. 1A), there was no damage and the remaining parts of the peeled disc were unchanged. Because so few cells were broken, intact and peeled sections had nearly the same thickness.
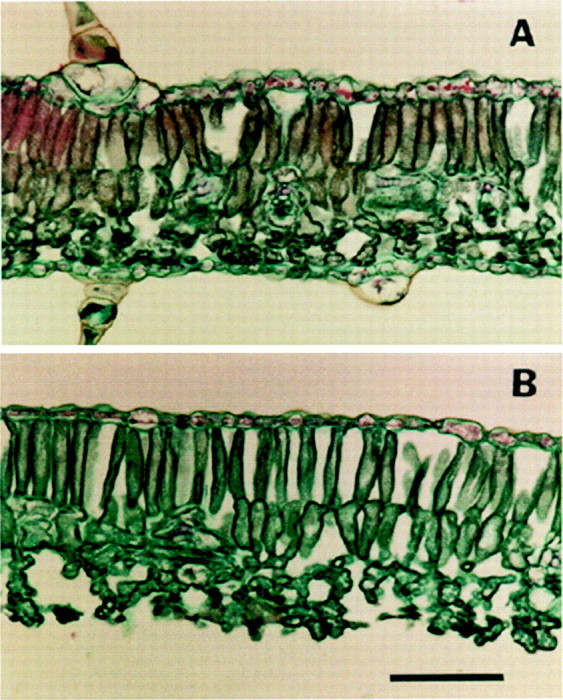
Fig. 1. Cross‐section of sunflower leaves: intact leaf (A) and peeled leaf after removal of the abaxial epidermis (B). Bar = 100 µm.
Effect of peeling on measurements of leaf Ψw and O2 evolution
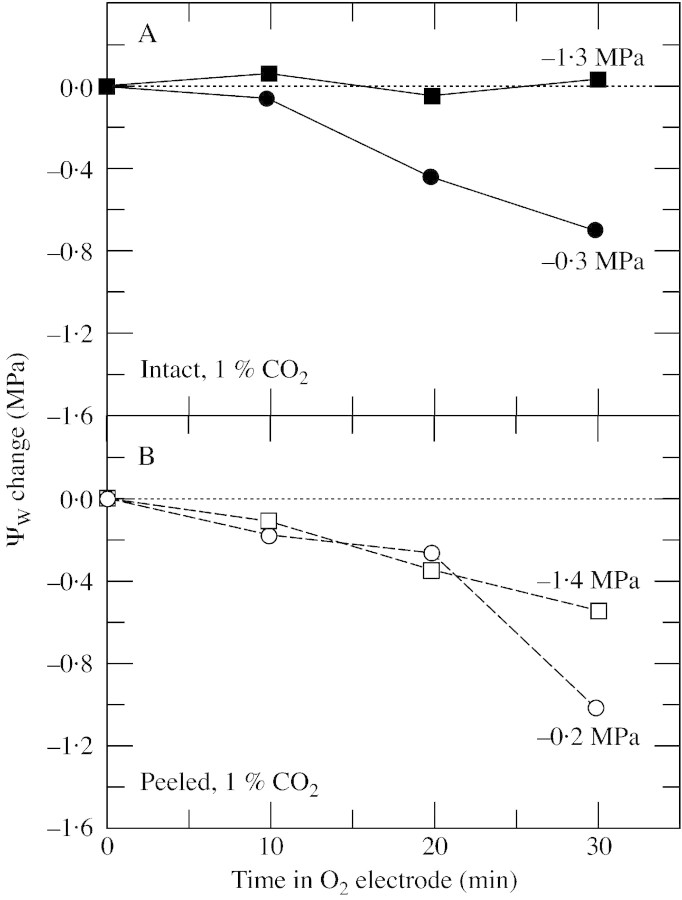
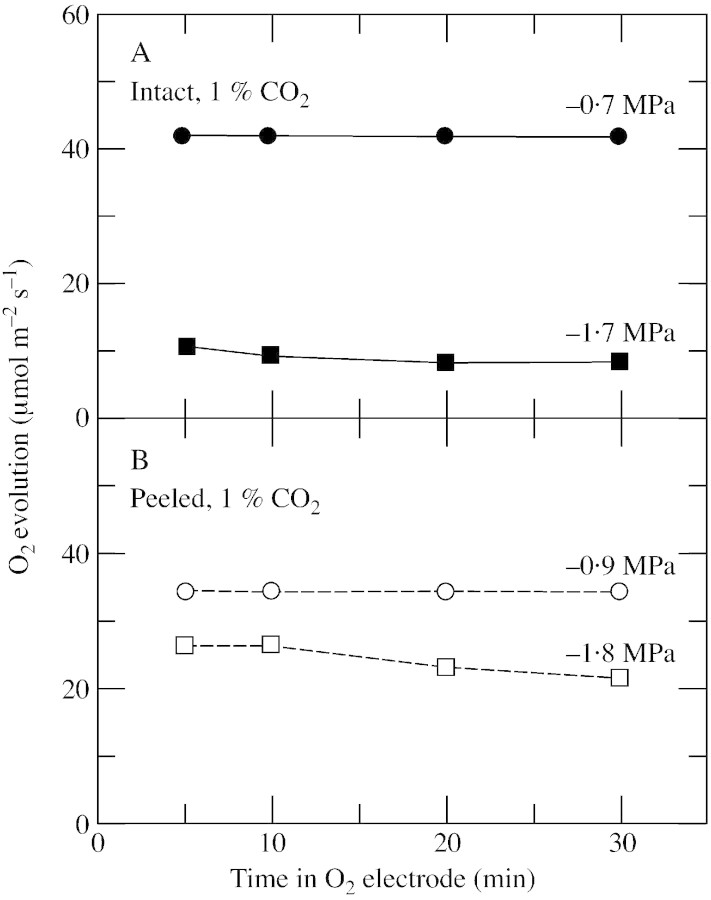
When the lower epidermis was removed from discs, water was lost more rapidly than from intact discs, and it was necessary to determine the effect this had on the measurements. During peeling, the Ψw of the discs decreased by less than 0·2 MPa. When subsequently exposed to the inside of the electrode chamber (high irradiance with water‐saturated gas flowing), the decrease in Ψw accelerated. For the first 10 min, the acceleration was modest and Ψw decreased by 0·2 MPa or less in all discs (Fig. 2). O2 evolution was stable during this period for all treatments (Fig. 3). In the next 20 min, Ψw decreased by 0·6 MPa in the intact hydrated discs (initial Ψw = –0·3 MPa; Fig. 2A), or by 0·5–1·0 MPa in the peeled discs (initial Ψw –0·2 and –1·4 MPa; Fig. 2B). Only in intact discs with a low initial Ψw was dehydration negligible for the entire 30 min, probably because the stomata were somewhat closed (–1·3 MPa; Fig. 2A). O2 evolution was essentially stable for the first 10 min in the O2 electrode (Fig. 3A and B) and tended to decrease slightly in the peeled discs during the following 20 min, probably because the discs were dehydrating (Fig. 3B). However, the stability of both Ψw and O2 evolution in the first 10 min in the electrode allowed measurements to be made during that time, and in all remaining experiments O2 evolution was measured at 10 min, with Ψw being measured immediately afterwards in the same discs.
Fig. 2. Change in Ψw at various times after leaf discs were placed in the O2 electrode. A, Intact disc. B, Peeled disc lacking the abaxial epidermis. For each point, two discs were obtained from the same leaf. One was used to measure photosynthetic O2 evolution followed immediately by Ψw. The other disc was used to measure Ψw at time zero. The difference between the initial and final Ψw is shown on the ordinate. The figure shown alongside each curve is the average of all the values of initial Ψw measured for that treatment. This is a single representative experiment from two replicate experiments. O2 evolution was 47–52 µmol m–2 s–1 (intact) and 42–49 µmol m–2 s–1 (peeled) in discs from plants with high Ψw, and 9–16 µmol m–2 s–1 (intact) and 34–43 µmol m–2 s–1 (peeled) in discs from plants with low Ψw. O2 evolution was measured at an irradiance of 1200 µmol m–2 s–1 at 25 °C in saturated air containing 21 % O2 and 1 % CO2.
Fig. 3. O2 evolution at different times in the O2 electrode in individual leaf discs of sunflower. A, Intact discs. B, Peeled discs lacking the abaxial epidermis. Four discs were sampled from one leaf on plants with either a high or low Ψw. Two were used for measuring O2 evolution or Ψw. The other two were used for the same measurements after peeling the epidermis. The initial Ψw is shown alongside each curve. This experiment was done twice with six different CO2 concentrations ranging from 0·4 to 20 % in each experiment. All concentrations gave similar results and a representative experiment is shown only for 1 % CO2. O2 evolution was measured at an irradiance of 1200 µmol m–2 s–1 at 25 °C in saturated air containing 21 % O2.
Maximum capacity for O2 evolution
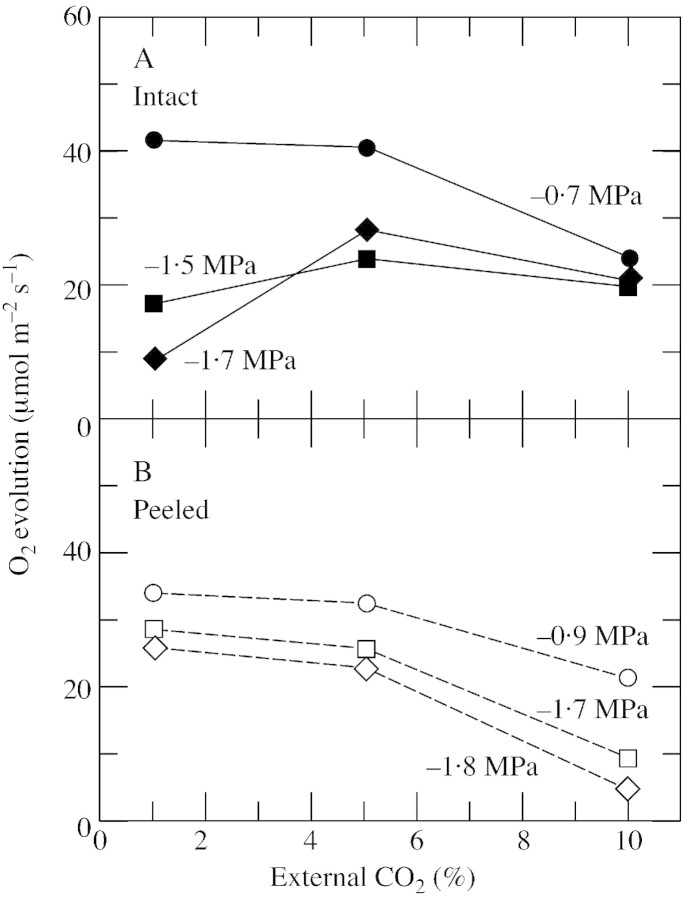
The maximum capacity for O2 evolution occurred at 1 % CO2 when intact discs had high Ψw (Fig. 4A). At 5 % CO2, the rates were slightly lower and at 10 % CO2 they were distinctly lower, indicating that sufficient CO2 had entered the discs to satisfy requirements for fixation, and fixation activity was inhibited by excess CO2. At low Ψw, the maximum capacity shifted to 5 % CO2 probably because the stomata were closed and created more of a barrier to CO2 entry; 10 % CO2 was still inhibitory (Fig. 4A). On the other hand, peeled discs with the peeled surface downward and exposed to the gas volume in the electrode system had no stomatal barrier to CO2 entry on the lower surface. The maximum capacity for O2 evolution occurred at 1 % CO2 regardless of Ψw (Fig. 4B). O2 evolution was slightly lower at 5 % CO2 and much lower at 10 % CO2. These results indicate that the stomatal barrier to CO2 diffusion can be overcome either by raising the external CO2 supply to 5 % in intact discs or by removing the lower epidermis from the disc.
Fig. 4. O2 evolution at different CO2 concentrations around sunflower leaf discs in the O2 electrode. A, Intact disc. B, Peeled disc lacking the abaxial epidermis. For exposure to various CO2 concentrations, four discs were removed from the same leaf of a plant with a high or low Ψw. Three were used for O2 evolution, one for each CO2 concentration and one was used to determine Ψw at the sampling time, shown alongside each curve. This is a representative experiment from two repetitions with similar results. O2 evolution was measured after 10 min at an irradiance of 1200 µmol m–2 s–1 at 25 °C in saturated air containing 21 % O2.
Limitations to O2 evolution at low Ψw
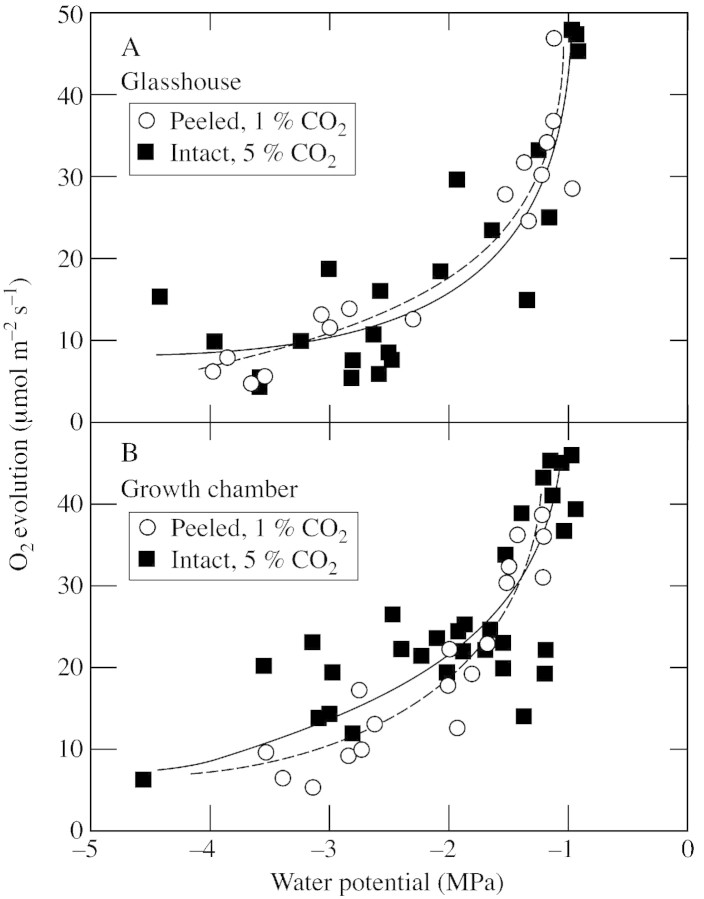
When CO2 concentrations were kept at 1 % in peeled discs and 5 % in intact discs to measure the maximum capacity for O2 evolution and minimize stomatal effects in both types of disc, the highest rates of O2 evolution were observed at Ψw of –0·9 to –1 MPa and were 45–47 µmol m–2 s–1 (Fig. 5). The rates were nearly as high in peeled discs as in intact ones, showing that wounding was minimal. As Ψw decreased, O2 evolving activity decreased dramatically at first and more gradually as the plant became drier. The decrease was similar regardless of whether the plants were grown in a glasshouse or in a growth chamber, or whether the discs were intact or peeled. At Ψw of –3 MPa, O2 evolution was approx. 20 % of that at high Ψw (Fig. 5).
Fig. 5. Maximum O2 evolution at various Ψw in sunflower leaf discs. A, Plants grown in a glasshouse (circles, peeled; squares, intact). B, Plants grown in a growth chamber (circles, peeled; squares, intact). Leaf discs were sampled from the fully expanded leaves after dehydration of the plants by withholding water from the soil for several days. Two discs were taken from the same leaf at the same time, one of which was left intact, the other peeled. O2 evolution was measured after 10 min with CO2 supplied at 1 % (peeled) or 5 % (intact) to obtain the maximum rate (see Fig. 4). The same disc was immediately used to determine Ψw. The individual measurements were pooled from two (A) or three (B) repeated experiments, each involving a different plant and two adjacent leaves. Other conditions for O2 evolution measurement were an irradiance of 1200 µmol m–2 s–1 at 25 °C in saturated air containing 21 % O2.
Does stomatal closure trigger losses in maximum photosynthetic activity?
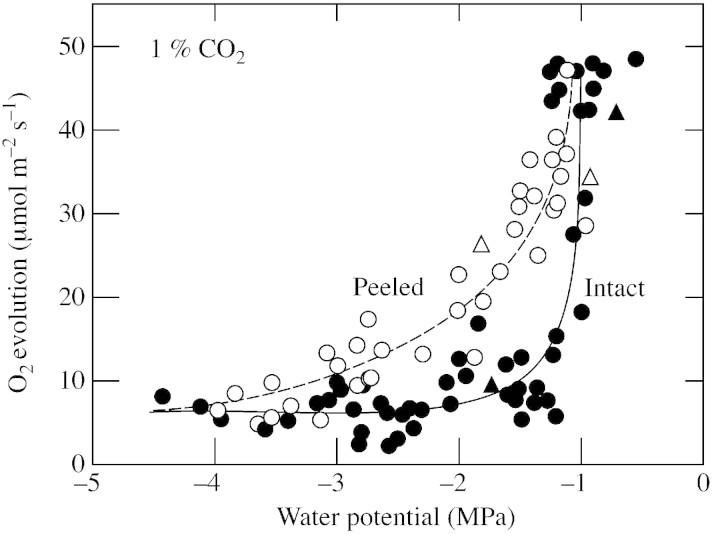
To evaluate the effect of the stomatal barrier more closely, a similar experiment was conducted on peeled and unpeeled discs at 1 % CO2. At this concentration, the peeled discs expressed the maximum capacity for O2 evolution but the intact discs expressed less than the maximum when Ψw was low (Fig. 4A), presumably because CO2 entry was restricted by stomatal closure. As a consequence, the intact discs lost more activity than the peeled discs as Ψw became lower (Fig. 6).
Fig. 6. As for Fig. 5 but O2 evolution was measured only at 1 % CO2. Sunflower leaf discs were intact (closed circles) or peeled and lacking the abaxial epidermis (open circles). Also shown are data from Fig. 3 (intact, closed triangles; peeled, open triangles). The individual measurements were pooled from five repeated experiments with plants grown and dehydrated in a glasshouse or growth chamber before the discs were sampled and peeled. Other conditions for O2 evolution were as described in Fig. 5.
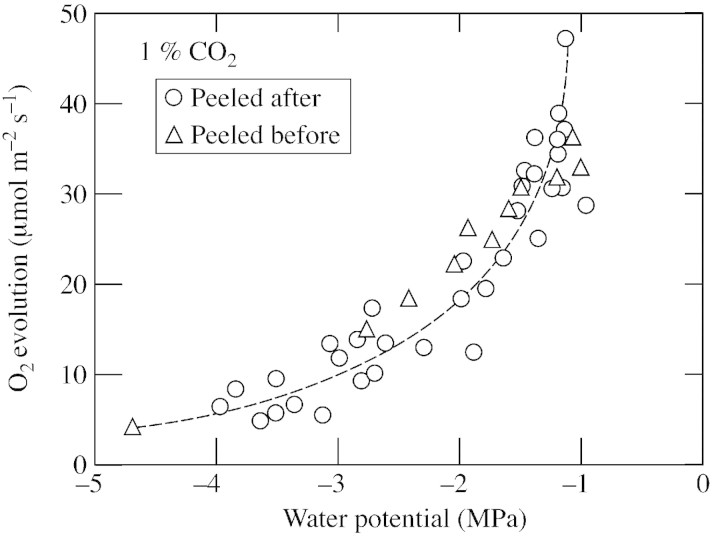
In each of these experiments, discs were obtained from dehydrated plants and the epidermis was removed after the stomata had closed. It is possible that stomatal closure diminished internal concentrations of CO2 and triggered losses in O2 evolving activity, as demonstrated by Vassey et al. (1991) in Phaseolus. To test this possibility, the epidermis was removed before discs were subjected to a low Ψw by dehydrating them inside the O2 electrode chamber. Growth chamber conditions were simulated by flowing air containing 0·035 % CO2 and with a relative humidity of 60 % through the electrode chamber at 25 °C under an irradiance of 800 µmol m–2 s–1. At various times, O2 evolution was measured at 1 % CO2 and the disc was removed to determine Ψw. As dehydration progressed, O2 evolution decreased in both peeled and intact discs, but the decrease was much faster in peeled discs (Fig. 7A). At the same Ψw, discs peeled before dehydration lost slightly less activity than intact ones (Fig. 7B), a result similar to that of the earlier experiments when discs were peeled after dehydration (Fig. 6). When O2 evolution was compared in discs peeled before or after dehydration, results were identical (Fig. 8).
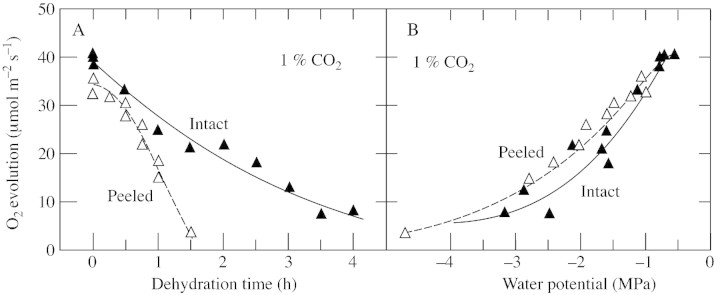
Fig. 7. O2 evolution in sunflower leaf discs sampled at high Ψw and dehydrated afterwards in the O2 electrode. A, O2 evolution at various times in 1 % CO2 (intact, closed triangles; peeled before dehydration, open triangles). B, O2 evolution at various leaf Ψw in 1 % CO2 (intact, closed triangles; peeled before dehydration, open triangles). Each data point for O2 evolution is from a separate disc, and Ψw was measured in the same disc immediately afterwards. Individual data were pooled from three repeated experiments, and the discs were sampled from two adjacent leaves from each plant. During dehydration in the electrode, irradiance was 800 µmol m–2 s–1 in air with 0·035 % CO2 at 25 °C and relative humidity of 60 %. During the O2 evolution measurements, conditions were as described in Fig. 5.
Fig. 8. O2 evolution at 1 % CO2 in peeled leaf discs sampled before or after dehydration of the tissue. Circles, Leaf discs obtained and peeled after the plants had developed various Ψw. Triangles, leaf discs obtained from plants with a high Ψw and peeled before subjecting the discs to various Ψw in the O2 electrode. Ψw was measured in the same discs immediately after each O2 evolution measurement. Individual data were pooled from three repeated experiments, and the discs were sampled from two adjacent leaves from each plant. Conditions during dehydration in the electrode were as described in Fig. 7 and during measurements in the electrode were as described in Fig. 5.
DISCUSSION
Maximum capacity for O2 evolution
There were marked losses in the maximum capacity for photosynthesis when sunflower plants were dehydrating and peeled leaf discs were used for the assay. During the measurements, the discs were pressed against the upper window of the O2 electrode chamber, causing most of the CO2 to enter through the lower surface. Because the discs had no lower epidermis, CO2 entered virtually unhindered by the stomata. Moreover, CO2 readily reached the cells because the maximum capacity for photosynthesis always occurred at 1 % CO2 regardless of Ψw. This showed that CO2 entered as readily at low Ψw as at high Ψw, and the shrinkage of the mesophyll reported by Fellows and Boyer (1978) at low Ψw did not hinder CO2 diffusion significantly. Therefore, when CO2 supply was adequate, the losses in peeled discs could be attributed only to decreased photosynthetic metabolism.
It is significant that the losses did not depend on whether the epidermis was removed before or after dehydration. Removing the epidermis before dehydration allowed CO2 to remain at the ambient level as low Ψw developed. Removing it after dehydration exposed the mesophyll to possibly depleted CO2 as the stomata closed. When Vassey et al. (1991) supplied 1 % CO2 during dehydration, reductions in sucrose phosphate synthase activity were prevented. They concluded that low CO2 triggered metabolic losses because of stomatal closure. In the present experiments, 1 % CO2 was not supplied during dehydration but removing the epidermis served the same purpose. Without the epidermis, no CO2 depletion was possible. The results indicate that CO2 depletion could not account for the losses in photosynthetic metabolism in sunflower, and thus dehydration itself acts directly on photosynthetic metabolism. Perhaps the control of photosynthesis differs in sunflower compared with P. vulgaris at low Ψw.
The inability of photosynthesis to recover when the epidermis is removed is in contrast to sunflower leaves fed ABA where removing the epidermis completely recovered photosynthesis (Terashima et al., 1988). ABA resulted in stomatal closure, but the complete recovery showed that photosynthetic metabolism was unaffected. In another experiment, Lauer and Boyer (1992) measured the internal CO2 concentration (Ci) and found that Ci decreased when leaves were fed ABA. The decline in Ci with ABA occurred because the stomata closed without altering the demand for CO2 by photosynthesis (Terashima et al., 1988), and CO2 was depleted inside the leaf. However, at low Ψw, Lauer and Boyer (1992) found increasing Ci. This opposite effect could not be attributed simply to stomatal closure. These results indicate that although stomata close at low Ψw, large non‐stomatal changes also occur and decrease demand for CO2.
Limitations to O2 evolution at low Ψw
While removing the epidermis allowed direct metabolic influences to be observed, leaving the discs intact gave similar results provided the intact discs were exposed to 5 % CO2. This concentration saturated photosynthesis at low Ψw and should have allowed the maximum activity to be observed in the same fashion as in peeled discs. Because the losses were indistinguishable from those in the peeled discs, they were thus entirely metabolic. Other reports with leaves showed similar inhibition when exposed to high CO2 at low Ψw (Boyer, 1971a; Ben et al., 1987; Bunce, 1988; Di Marco et al., 1988; Graan and Boyer, 1990; Wise et al., 1991, 1992; Quick et al., 1992; Kanechi et al., 1998; Escalano et al., 1999; Tezara et al., 1999). Although the degree of metabolic inhibition probably varies with species, water deficit, sampling time and measuring method, our results showed that photosynthetic metabolism was inhibited similarly whether the plants were grown in a growth chamber or glasshouse, or whether plants were dehydrated for several days or discs were dehydrated for a few hours in the laboratory. In contrast, sunflower plants allowed to acclimate for 2 weeks to moderately low Ψw showed less metabolic inhibition than non‐acclimated plants, suggesting that conditions in the cytoplasm affect the metabolic response (Matthews and Boyer, 1984).
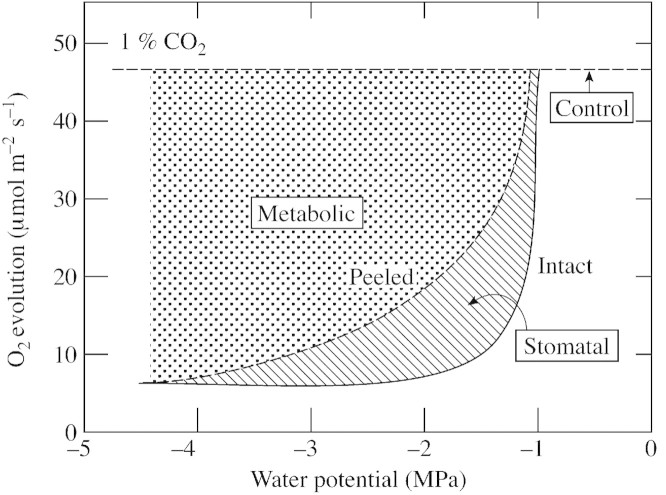
However, at 1 % CO2, larger losses in O2 evolving activity initially occurred in the intact discs than in the peeled ones. Stomata begin to close at Ψw around –1 MPa in sunflower (Boyer and Bowen, 1970; Matthews and Boyer, 1984; Sharp and Boyer, 1986). As a consequence, comparing photosynthesis in peeled discs with that in intact discs at 1 % CO2 allowed the inhibition to be separated into a metabolic component (peeled discs) and an epidermal component that reflected the stomatal contribution (difference between peeled and intact discs). Figure 9 illustrates these components and indicates that the stomatal component was significant at Ψw between –1 and –1·5 MPa but the metabolic one dominated below about –1·5 MPa. This finding agrees with other reports of stomatal inhibition during mild dehydration (Kaiser, 1987; Robinson et al. 1988; Cornic et al., 1989; Schwab et al., 1989; Sharkey and Seemann, 1989; Frederick et al., 1990; Chaves, 1991; Quick et al., 1992; Wise et al., 1992).
Fig. 9. Metabolic and stomatal components of inhibited O2 evolution in sunflower leaf discs having low Ψw. Dashed line (control) indicates full recovery expected when epidermis is removed if no metabolic inhibition occurs. Dotted area represents the metabolic component and hatched area the stomatal component of inhibition. Adapted from Fig. 6.
The response is complicated by the O2 electrode properties, which are advantageous for rapid measurements but involve large boundary layers because the air is unstirred and the tissue is pressed against the upper window of the chamber. As a result, CO2 diffusion is restricted, and concentrations often need to be higher than in experiments measuring CO2 exchange of leaves in stirred air. For example, sunflower leaves at high Ψw saturate at CO2 concentrations around 0·1 % in stirred air (Matthews and Boyer, 1984; Sharp and Boyer, 1986) or about one‐tenth of the concentration for discs in the electrode system. On the other hand, when Ψw is low, sunflower leaves saturate at about 3 % CO2 in stirred air (Graan and Boyer, 1990), which is similar to the concentration for discs in the O2 electrode (5 % at low Ψw in the present experiments). Thus, while the maximum capacity is easily measured in the intact discs, the role of the stomata is only approximated in the O2 electrode system and may be better assessed in intact leaves.
In leaves, tests often rely on the calculated Ci, and some authors have reported decreased Ci (Quick et al., 1992; Gunasekera and Berkowitz, 1993), others no change (Di Marco et al., 1988; Cornic et al., 1989; Wise et al., 1991; Gunasekera and Berkowitz, 1993) and still others found increases at low Ψw (Frederick et al., 1990; Wise et al., 1990). Cornic et al. (1983) described non‐stomatal limitations in Sinapis at low Ψw using an analysis of calculated Ci. Calculations of Ci are based on transpiration and have been questioned because stomatal closure may not affect transpiration uniformly across the leaf (Terashima et al., 1988, but see Wise et al., 1991, 1992), and the epidermis may discriminate between water vapour and CO2 (Boyer et al., 1997). When Lauer and Boyer (1992) avoided these problems by directly measuring Ci in several species, they reported a slight decrease in intact sunflower leaves followed by an increase, as Ψw became lower. Stomatal closure may have contributed to the slight decrease but could not be responsible for the increase. Clearly, the increase was caused by metabolic inhibition that reduced the demand for CO2 more than the stomata reduced the diffusion of CO2. Because the metabolic component became dominant at Ψw below –1·5 MPa in the present experiments, the electrode system gave results that were in general agreement with those of Lauer and Boyer (1992) in intact leaves. Thus, it appears that sunflower photosynthesis may have been somewhat influenced by stomata initially but the effect decreased as the metabolic component became dominant at lower Ψw.
Causes of metabolic inhibition
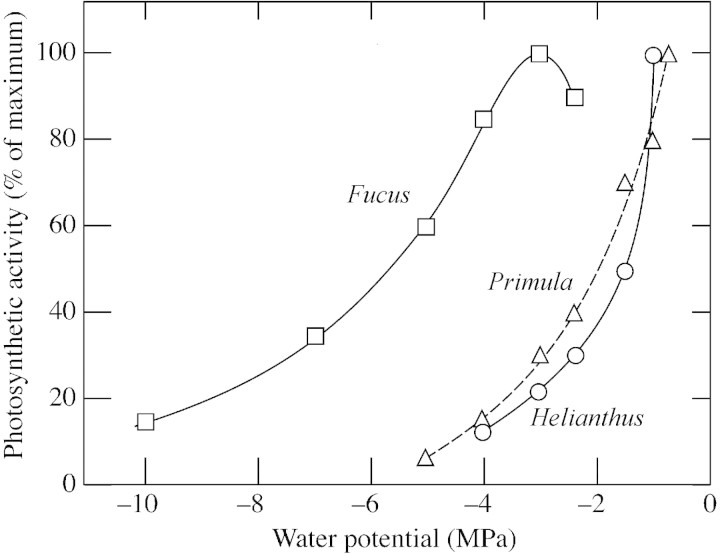
The early inhibition of photosynthetic metabolism is curious in view of the comparatively stable photosynthesis at low Ψw in species such as Fucus vesiculosus that lack stomata (Fig. 10). The early inhibition may be general for land plants because it was also apparent in Primula palinuri (Fig. 10). Two factors are likely to contribute to it. First, in sunflower, cells shrink when water is lost, and the shrinkage causes distortions and wrinkling of the cell wall (Fellows and Boyer, 1978). Cytoplasm caught in the folds and distorted by the wall shows breaks in the plasmalemma and/or tonoplast, visible in the electron microscope, and cell lysis follows quickly. At Ψw of –1·5 MPa, about 10 % of the cells are lysed and account for about 20 % of the loss in leaf CO2‐fixing activity (Fellows and Boyer, 1978). Upon rewatering, the lysed cells do not contribute to photosynthetic recovery and rates return to less than 100 % in the leaves. With more severe desiccation to the air‐dry state (–12 MPa), all cells are lysed and photosynthetic recovery is zero (Fellows and Boyer, 1978).
Fig. 10. Comparison of metabolic limitation in three species having low Ψw. The limitations are entirely metabolic because in Fucus vesiculosus no stomata are present and photosynthesis occurs in the tissue surface (from Kawamitsu et al., 2000), while in the leaves of Primula palinuri and Helianthus annuus the epidermis is peeled away and the stomata have been removed [from Dietz and Heber (1983) and this paper].
The second and usually the largest factor is a direct loss of activity in the photosynthesis partial reactions that is reversible upon rehydration. In experiments in which half a sunflower leaf was dehydrated while the other half was supplied with water, isolated chloroplasts were closely compared and showed decreased electron transport (Boyer and Bowen, 1970; Mohanty and Boyer, 1976; Matthews and Boyer, 1984) and a marked inhibition of cyclic and non‐cyclic photophosphorylation (Keck and Boyer, 1974). When measured in vivo, there were similar losses in photophosphorylation indicated by membrane energization in sunflower grown in the laboratory (Ortiz‐Lopez et al., 1987) but not in the field (Ortiz‐Lopez et al., 1991), probably because of the different growth conditions or illumination in the two environments. Losses in membrane energization were also reported for Craterostigma plantagineum and spinach (Schwab et al., 1989). In sunflower, Tezara et al. (1999) found substantial decreases in ATP synthesis attributable to less ATP synthase (Coupling Factor), and the ability of the chloroplasts to regenerate ribulose‐1,5‐bisphosphate (RuBP) was lower as a result. Two sunflower hybrids differing in photosynthetic activities at Ψw of –1 MPa had differing RuBP contents but not ribulose‐1,5‐bisphosphate carboxylase/oxygenase (Rubisco) content or activity (Giménez et al., 1992), and similar observations were reported in tobacco with antisense Rubisco DNA (Gunasekera and Berkowitz, 1993). At low Ψw, sunflower leaves also had low quantum yields (Mohanty and Boyer, 1976; Matthews and Boyer, 1984; Sharp and Boyer, 1986) not caused by photoinhibition (Sharp and Boyer, 1986). All of these measurements support the view that losses in the activity of the membrane‐associated reactions inhibit CO2 fixation and account for much of the metabolic inhibition in sunflower. Similar changes are likely to occur in other species but at different Ψw, so the closest analysis seems possible within a single species.
Inhibition of photosynthesis was reversed when sunflower leaf tissue was rewatered (except for effects of lysis) (Boyer, 1971b; Potter and Boyer, 1973), but not when the chloroplasts were isolated into hydrating media (Potter and Boyer, 1973). In other words, repair or re‐configuration of the partial reactions required the intact cell. The loss did not result from low turgor (Boyer and Potter, 1973) and instead was proportional to the increased solute concentration that occurs when water departs and solute is left behind (Potter and Boyer, 1973). As a result, the loss was approximately proportional to the relative water content of the tissue.
Additional insight into the molecular changes resulting from solute were reported in spinach where large losses in photophosphorylation occurred at low Ψw (Younis et al., 1979), which were also seen in vivo (Schwab et al., 1989). The conformation of the spinach coupling protein was altered and it was unable to bind substrate ADP (Younis et al., 1979) instead of being present in smaller amounts, as in sunflower (Tezara et al., 1999). The conformation and activity losses could be reproduced by exposing the protein to Mg2+ concentrations at least two‐fold higher than normal, or about the concentration expected when 50 % or more of the leaf water is lost (Younis et al., 1983). The Mg2+ bound to the coupling protein and the low activity and new conformation were not reversed when the protein was returned to media containing normal Mg2+ concentrations, i.e. the non‐reversibility was similar to that in chloroplasts isolated from leaf tissue at low Ψw. To explore whether Mg2+ was important in sunflower, Rao et al. (1987) grew plants with varying Mg2+ concentrations in the leaves and found slightly less photosynthetic inhibition at low Ψw when the leaves had low Mg2+ than when they had high Mg2+ contents, confirming the importance of specific solutes in the metabolic response.
Similar chloroplast effects have been reported for other species (Mayoral et al., 1981; Berkowitz and Whalen, 1985; Kaiser et al., 1986; Ben et al., 1987) and have sometimes been attributed to increased solute concentrations (Berkowitz and Whalen, 1985; Kaiser et al., 1986) although dehydration sometimes had to be severe (Sharkey and Seemann, 1989; Scheuermann et al., 1991; Martin and Ruiz‐Torres, 1992; Gunasekera and Berkowitz, 1993). Thus, if concentrating effects of water loss account for some of the losses in photosynthetic metabolism, the effects should be immediate with no difference between leaf discs peeled before or after imposition of low Ψw. In the present experiments, such immediacy was observed, and the time of peeling made no difference.
In other studies, variations on this form of metabolic inhibition have been observed. Sucrose content sometimes increased and was associated with a block in starch synthesis (Vassey and Sharkey, 1989; Chaves, 1991; Quick et al., 1992; Kanechi et al., 1998). The activity of certain enzymes, such as sucrose phosphate synthase, was reduced (Vassey and Sharkey, 1989; Vassey et al., 1991), while that of fructose‐1,6‐bisphosphatase and Rubisco changed only moderately (Vassey and Sharkey, 1989). Sharkey and Seemann (1989) found that most of the metabolites 3‐phosphoglycerate, triose‐phosphate, fructose‐6‐phosphate and RuBP decreased only during severe dehydration.
Cornic and coworkers (Cornic et al., 1989; Cornic and Briantais, 1991) measured fluorescence and CO2 assimilation in Phaseolus vulgaris and ascribed losses during water deficits entirely to internal CO2 depletion by stomatal closure. It is clear that P. vulgaris could be more affected by water deficit‐induced stomatal closure than sunflower, but the P. vulgaris work depends on the stability of the relationship between fluorescence, electron flow and Ci at low Ψw. It is well known that considerable chlorophyll fluorescence is absorbed by other chloroplasts, and the signal probably represents mostly surface chlorophyll rather than the entire chloroplast population. Moreover, because electron transport and photophosphorylation can change in chloroplasts from dehydrated plants (described above), it seems risky to assume a stable relationship between fluorescence, electron flow and Ci. In the present work, these assumptions were avoided by removing the epidermis and thus clearly removing stomatal control. Despite the lack of stomata, a marked photosynthetic inhibition remained. A similar experiment in P. vulgaris could be illuminating.
CONCLUSIONS
Leaf discs with and without an epidermis provide a straightforward way of identifying the contributions of stomata and metabolism to the rate of photosynthesis. Stomata were closing while metabolism was being inhibited, and the relative severity of each determined which factor was most rate‐limiting. Large, direct metabolic losses were clearly seen and stomata contributed only in the early phases of dehydration. However, because discs were used at very high CO2 concentrations, it was not possible to determine exactly how the limitation would be expressed in intact plants operating in ambient air. If the epidermis could be similarly removed in intact plants, it might be possible to extend this method to a more precise determination of rate‐limitation than is currently possible.
ACKNOWLEDGEMENTS
This work is dedicated to Dr David Lawlor on the occasion of his retirement and was presented at the symposium in his honour sponsored by the Society for Experimental Biology. We thank Interstate Payco Seed Company for generously donating sunflower seeds, and Dr Choyu Shinjo and the Japan Ministry of Education for financial support of Y.K. in J.S.B.’s laboratory. This work was supported by USDA Grant 93‐37306‐9578 from the NRI‐CGP to J.S.B.
Supplementary Material
Received: 5 April 2001; Returned for revision: 17 October 2001; Accepted: 9 January 2001.
References
- BenGY, Osmond B, Sharkey TD.1987. Comparisons of photosynthetic responses of Xanthium strumarium and Helianthus annuus to chronic and acute water stress in sun and shade. Plant Physiology 84: 476–482. [DOI] [PMC free article] [PubMed] [Google Scholar]
- BerkowitzGA, Whalen C.1985. Leaf K+ interaction with water stress inhibition of nonstomatal‐controlled photosynthesis. Plant Physiology 79: 189–193. [DOI] [PMC free article] [PubMed] [Google Scholar]
- BoyerJS.1971a Nonstomatal inhibition of photosynthesis in sunflower at low leaf water potentials and high light intensities. Plant Physiology 48: 532–536. [DOI] [PMC free article] [PubMed] [Google Scholar]
- BoyerJS.1971b Recovery of photosynthesis in sunflower after a period of low leaf water potential. Plant Physiology 47: 816–820. [DOI] [PMC free article] [PubMed] [Google Scholar]
- BoyerJS.1976. Water deficits and photosynthesis. In: Kozlowski TT, ed. Water deficits and plant growth, Vol. 4 New York: Academic Press, 153–190. [Google Scholar]
- BoyerJS.1990. Photosynthesis in dehydrating plants. Botanical Magazine of Tokyo, Special Issue 2: 73–85. [Google Scholar]
- BoyerJS, Bowen BL.1970. Inhibition of oxygen evolution in chloroplasts isolated from leaves with low water potentials. Plant Physiology 45: 612–615. [DOI] [PMC free article] [PubMed] [Google Scholar]
- BoyerJS, Knipling EB.1965. Isopiestic technique for measuring water potentials in leaves with a thermocouple psychrometer. Proceedings of the National Academy of Sciences of the USA 54: 1044–1051. [PMC free article] [PubMed] [Google Scholar]
- BoyerJS, Potter JR.1973. Chloroplast response to low leaf water potentials. I. Role of turgor. Plant Physiology 51: 989–992. [DOI] [PMC free article] [PubMed] [Google Scholar]
- BoyerJS, Wong SC, Farquhar GD.1997. CO2 and water vapor exchange across leaf cuticle (epidermis) at various water potentials. Plant Physiology 114: 185–191. [DOI] [PMC free article] [PubMed] [Google Scholar]
- BunceJA.1988. Nonstomatal inhibition of photosynthesis by water stress. Reduction in photosynthesis at high transpiration rate without stomatal closure in field‐grown tomato. Photosynthesis Research 18: 357–362. [DOI] [PubMed] [Google Scholar]
- ChavesMM.1991. Effects of water deficits on carbon assimilation. Journal of Experimental Botany 42: 1–16. [Google Scholar]
- CornicG, Briantais J‐M.1991. Partitioning of photosynthetic electron flow between CO2 and O2 reduction in a C3 leaf (Phaseolus vulgaris L.) at different CO2 concentrations and during drought stress. Planta 183: 178–184. [DOI] [PubMed] [Google Scholar]
- CornicG, Prioul J‐L, Louason G.1983. Stomatal and non‐stomatal contribution in the decline in leaf net CO2 uptake during rapid water stress. Physiologia Plantarum 58: 295–301. [Google Scholar]
- CornicG, Le Gouallec JL, Briantais JM, Hodges M.1989. Effect of dehydration and high light on photosynthesis of two C3 plants (Phaseolus vulgaris L. and Elatostema repens (Lour.) Hall f.). Planta 177: 84–90. [DOI] [PubMed] [Google Scholar]
- DavisonIR, Pearson GA.1996. Stress tolerance in intertidal seaweeds. Journal of Phycology 32: 197–211. [Google Scholar]
- DelieuT, Walker DA.1981. Polarographic measurement of photosynthetic O2 evolution by leaf discs. New Phytologist 89: 165–175. [Google Scholar]
- DietzK‐J, Heber U.1983. Carbon dioxide gas exchange and the energy status of leaves of Primula palinuri under water stress. Planta 158: 349–356. [DOI] [PubMed] [Google Scholar]
- DiMarcoG, Massacci A, Gabrielli R.1988. Drought effects on photosynthesis and fluorescence in hard wheat cultivars grown in the field. Physiologia Plantarum 74: 385–390. [Google Scholar]
- EscalanoJM, Flexas J, Medrano H.1999. Stomatal and non‐stomatal limitation of photosynthesis under water stress in field‐grown grapevines. Australian Journal of Plant Physiology 26: 421–433. [Google Scholar]
- FellowsRJ, Boyer JS.1978. Altered ultrastructure of cells of sunflower leaves having low water potentials. Protoplasma 93: 381–395. [Google Scholar]
- FrederickJR, Alm DM, Hesketh JD, Below FE.1990. Overcoming drought‐induced decreases in soybean leaf photosynthesis by measuring with CO2‐enriched air. Photosynthesis Research 25: 49–57. [DOI] [PubMed] [Google Scholar]
- GiménezC, Mitchell VJ, Lawlor DW.1992. Regulation of photosynthetic rate of two sunflower hybrids under water stress. Plant Physiology 98: 516–524. [DOI] [PMC free article] [PubMed] [Google Scholar]
- GraanT, Boyer JS.1990. Very high CO2 partially restores photosynthesis in sunflower at low water potentials. Planta 181: 378–384. [DOI] [PubMed] [Google Scholar]
- GunasekeraD, Berkowitz GA.1993. Use of transgenic plants with ribulose‐1,5‐bisphosphate carboxylase/oxygenase antisense DNA to evaluate the rate limitation of photosynthesis under water stress. Plant Physiology 103: 629–635. [DOI] [PMC free article] [PubMed] [Google Scholar]
- JensenWA.1962. Botanical histochemistry. San Francisco: Freeman and Co. [Google Scholar]
- KaiserWM.1987. Effects of water deficit on photosynthetic capacity. Physiologia Plantarum 71: 142–149. [Google Scholar]
- KaiserWM, Schroppel‐Meier G, Wirth E.1986. Enzyme activities in an artificial stroma medium. An experimental model for studying effects of dehydration on photosynthesis. Planta 167: 292–299. [DOI] [PubMed] [Google Scholar]
- KanechiM, Yamada J, Inagaki N, Maekawa S.1998. Non‐stomatal inhibition of photosynthesis associated with partitioning of the recent assimilates into starch and sucrose in sunflower leaves under water stress. Journal of the Japanese Society of Horticultural Science 67: 190–197. [Google Scholar]
- KawamitsuY, Driscoll T, Boyer JS.2000. Photosynthesis during desiccation in an intertidal alga and a land plant. Plant and Cell Physiology 41: 344–353. [DOI] [PubMed] [Google Scholar]
- KeckRW, Boyer JS.1974. Chloroplast response to low leaf water potentials. III. Differing inhibition of electron transport and photophosphorylation. Plant Physiology 53: 474–479. [DOI] [PMC free article] [PubMed] [Google Scholar]
- KubotaF, Yatomi M, Agata W.1992. CO2 exchange rate in sweet potato (Ipomoea batatas Lam.) leaves with and without lower epidermis. Photosynthetica 26: 257–260. [Google Scholar]
- KubotaF, Nada K, Hirao K, Saitou K.1996. Chlorophyll fluorescence quenching and CO2 exchange rate of mungbean (Vigna radiata (L.) Wilczek) leaves without epidermis. Japanese Journal of Crop Science 65: 722–723. [Google Scholar]
- LauerMJ, Boyer JS.1992. Internal CO2 measured directly in leaves: abscisic acid and low leaf water potential cause opposing effects. Plant Physiology 98: 1310–1316. [DOI] [PMC free article] [PubMed] [Google Scholar]
- MansfieldTA, Hetherington AM, Atkinson CJ.1990. Some current aspects of stomatal physiology. Annual Review of Plant Physiology and Plant Molecular Biology 41: 55–75. [Google Scholar]
- MartinB, Ruiz‐Torres NA.1992. Effects of water‐deficit stress on photosynthesis, its components and component limitations, and on water use efficiency in wheat (Triticum aestivum L.). Plant Physiology 100: 733–739. [DOI] [PMC free article] [PubMed] [Google Scholar]
- MatthewsMA, Boyer JS.1984. Acclimation of photosynthesis to low leaf water potentials. Plant Physiology 74: 161–166. [DOI] [PMC free article] [PubMed] [Google Scholar]
- MayoralML, Atsmon D, Shimshi D, Gromet‐Elhanan Z.1981. Effect of water stress on enzyme activities in wheat and related wild species: carboxylase activity, electron transport, and photophosphorylation in isolated chloroplasts. Australian Journal of Plant Physiology 8: 385–393. [Google Scholar]
- MohantyP, Boyer JS.1976. Chloroplast response to low leaf water potentials. IV. Quantum yield is reduced. Plant Physiology 57: 704–709. [DOI] [PMC free article] [PubMed] [Google Scholar]
- NishidaK.1977. CO2 fixation in leaves of a CAM plant without lower epidermis and the effect of CO2 on their deacidification. Plant and Cell Physiology 18: 927–930. [Google Scholar]
- Ortiz‐LopezA, Ort DR, Boyer JS.1987. In situ measurements of the inhibitory effects of low leaf water potentials on photophosphorylation. Proceedings of the VIIth international congress on photosynthesis. Vol. IV The Netherlands: Martinus Nijhof, 153–156. [Google Scholar]
- Ortiz‐LopezA, Ort DR, Boyer JS.1991. Photophosphorylation in attached leaves of Helianthus annuus at low water potentials. Plant Physiology 96: 1018–1025. [DOI] [PMC free article] [PubMed] [Google Scholar]
- PotterJR, Boyer JS.1973. Chloroplast response to low leaf water potentials. II. Role of osmotic potential. Plant Physiology 51: 993–997. [DOI] [PMC free article] [PubMed] [Google Scholar]
- QuickWP, Chaves MM, Wendler R, David M, Rodrigues ML, Passaharinho JA, Pereira JS, Adcock MD, Leegood RC, Stitt M.1992. The effect of water stress on photosynthetic carbon metabolism in four species grown under field conditions. Plant, Cell and Environment 15: 25–35. [Google Scholar]
- RaoIM, Sharp RE, Boyer JS.1987. Leaf magnesium alters photosynthetic response to low water potentials in sunflower. Plant Physiology 84: 1214–1219. [DOI] [PMC free article] [PubMed] [Google Scholar]
- RobinsonSP, Grant WJR, Loveys BR.1988. Stomatal limitation of photosynthesis in abscisic acid‐treated and in water‐stressed leaves measured at elevated CO2 Australian Journal of Plant Physiology 15: 495–503. [Google Scholar]
- SaccardyK, Cornic G, Brulfert J, Reyss, A.1996. Effect of drought stress on net CO2 uptake by Zea leaves. Planta 199: 589–595. [Google Scholar]
- ScheuermannR, Bichler K, Stuhlfauth T, Fock HP.1991. Simultaneous gas exchange and fluorescence measurements indicate differences in the response of sunflower, bean and maize to water stress. Photosynthesis Research 27: 189–197. [DOI] [PubMed] [Google Scholar]
- SchwabKB, Schreiber U, Heber U.1989. Response of photosynthesis and respiration of resurrection plants to desiccation and rehydration. Planta 177: 217–227. [DOI] [PubMed] [Google Scholar]
- SharkeyTD, Seemann JR.1989. Mild water stress effects on carbon‐reduction‐cycle intermediates, ribulose bisphosphate carboxylase activity, and spatial homogeneity of photosynthesis in intact leaves. Plant Physiology 89: 1060–1065. [DOI] [PMC free article] [PubMed] [Google Scholar]
- SharpRE, Boyer JS.1986. Photosynthesis at low water potentials in sunflower: lack of photoinhibitory effects. Plant Physiology 82: 90–95. [DOI] [PMC free article] [PubMed] [Google Scholar]
- TerashimaI, Wong S, Osmond CB, Farquhar GD.1988. Characterization of non‐uniform photosynthesis induced by abscisic acid in leaves having different mesophyll anatomies. Plant and Cell Physiology 29: 385–394. [Google Scholar]
- TezaraW, Mitchell VJ, Driscoll SD, Lawlor DW.1999. Water stress inhibits plant photosynthesis by decreasing coupling factor and ATP. Nature 401: 914–917. [Google Scholar]
- TokudaS, Kubota F, Hirao K, Saitou K.1999. Effects of leaf epidermis peeling on the CO2 exchange rate and chlorophyll fluorescence quenching, and estimation of photorespiration rate from electron transport in mungbean (Vigna radiata (L.) Wilczek) leaves. Journal of the Faculty of Agriculture, Kyushu University 43: 293–302. [Google Scholar]
- VasseyTL, Sharkey TD.1989. Mild water stress of Phaseolus vulgaris plants leads to reduced starch synthesis and extractable sucrose phosphate synthase activity. Plant Physiology 89: 1066–1070. [DOI] [PMC free article] [PubMed] [Google Scholar]
- VasseyTL, Quick WP, Sharkey TD, Stitt M.1991. Water stress, carbon dioxide, and light effects on sucrose‐phosphate synthase activity in Phaseolus vulgaris Physiologia Plantarum 81: 37–44. [Google Scholar]
- WiseRR, Ortiz‐Lopez A, Ort DR.1992. Spatial distribution of photosynthesis during drought in field‐grown and acclimated and nonacclimated growth chamber‐grown cotton. Plant Physiology 100: 26–32. [DOI] [PMC free article] [PubMed] [Google Scholar]
- WiseRR, Sparrow DH, Ortiz‐Lopez A, Ort DR.1991. Biochemical regulation during the mid‐day decline of photosynthesis in field‐grown sunflower. Plant Science 74: 45–52. [Google Scholar]
- WiseRR, Frederick JR, Alm DM, Kramer DM, Hesketh JD, Crofts AR, Ort DR.1990. Investigation of the limitations to photosynthesis induced by leaf water deficit in field‐grown sunflower (Helianthus annuus L.). Plant, Cell and Environment 13: 923–931. [Google Scholar]
- YounisHM, Boyer JS, Govindjee.1979. Conformation and activity of chloroplast coupling factor exposed to low chemical potential of water in cells. Biochimica et Biophysica Acta 548: 328–340. [DOI] [PubMed] [Google Scholar]
- YounisHM, Weber G, Boyer JS.1983. Activity and conformational changes in chloroplast coupling factor induced by ion binding: formation of a magnesium‐enzyme‐phosphate complex. Biochemistry 22: 2505–2512. [Google Scholar]
Associated Data
This section collects any data citations, data availability statements, or supplementary materials included in this article.


