Abstract
A procedure is described for obtaining allometric regression equations to estimate non‐destructively and in a cost‐effective manner the current year’s above‐ground vegetative and reproductive biomass of Vitis vinifera L. ‘Merlot’ throughout the growing season. Significant relationships were obtained over a 3‐year period (1998–2000) between the dimensions of an individual shoot per vine (i.e. diameter and length) and dry weights of its primary stem, primary leaves and lateral growth. The dry mass of a grape was best estimated from measurements of the basal diameter of the bunch peduncle. Introducing cumulative degree‐days as an additional explanatory variable in the equations allowed them to be used irrespective of year and growth stage. Multi‐year regressions were used to quantify in detail the seasonal evolution of mature grapevine biomass under the climatic conditions of the Bordeaux area, France, and for differing levels of soil nitrogen.
Key words: Non‐destructive biomass estimation, allometry, regression, stem diameter, dry mass, grapevine, Vitis vinifera
INTRODUCTION
During the last decades, crop growth simulation models have become powerful research tools in agriculture in general and in viticulture in particular for understanding the processes involved in plant growth and yield and for investigating and developing agronomic practices and pest management strategies (Gutierrez et al., 1985; Wermelinger and Baumgärtner, 1991; Bindi et al., 1997). This modelling effort requires field‐collected biomass datasets sufficiently complete and comprehensive to serve for calibration and/or validation. Weighing pulled out grapevine in a field is undoubtedly the most accurate method of estimating whole‐plant biomass, but it is an extremely time‐consuming and destructive method, which is limited to small areas and sample sizes and which is generally inappropriate in viticulture studies due to practical and economical considerations. An alternative approach—widely used in studies of perennial woody plants—is to establish allometric equations for relating the biomass of an individual plant to easily obtainable non‐destructive measurements, such as stem diameter and height (Niklas, 1994; Brouat et al., 1998). This method must be capable of providing reliable biomass estimates despite variety, age of the plants, stand and sites, degree of competition and the influence that management strategies such as pruning may have on plant form (Telenius and Verwijst, 1995). Only limited information is available in the literature dealing with the feasibility of this approach in grapevines (Williams et al., 1985; Bindi et al., 2001).
The aim of this study was to develop a cost‐effective procedure for obtaining allometric regression equations that accurately estimate above‐ground vegetative and reproductive biomass of a grapevine through its growing cycle. This procedure involves four steps: (1) choosing a suitable functional form for the allometric equations; (2) testing the stability of the allometric relationships over time; (3) choosing suitable values for any adjustable parameters in the equations; and (4) determining an efficient sampling scheme for the measured variables. The results of this study will be used to develop a mechanistic model of grapevine growth.
MATERIALS AND METHODS
Study site
All data were collected on 10‐year‐old grapevines (Vitis vinifera L. ‘Merlot’) grafted on Fercal rootstocks, at the INRA Couhins experimental site near Bordeaux, France, over a 3‐year period (1998–2000). The vineyard is divided into four plots corresponding to four levels of soil nitrogen availability obtained through contrasting soil management practices: G0, G50, G100 and S representing ungrassed, half‐grassed, fully‐grassed and gravelly soil plots, respectively (Rodriguez‐Lovelle et al., 2000). No fertilization or irrigation was applied. Rows are oriented in a SW to NE direction and vine and row spacings are 1·0 and 1·8 m, respectively. The vines were head‐trained to a double cordon Guyot system, cane‐pruned to four to eight nodes per vine before budbreak and the shoots were maintained in a vertical trellis system by two wires 0·5 m apart and 1·0 m above the soil surface. This created a compact hedgerow 1·50 m high and 0·40 m wide with little foliage below the main wire. Pruning twice a year conserved this geometry.
Data collection
Dimensions and biomass of an individual shoot per vine were simultaneously measured five times through each growing season (1998–2000) on 12–18 vine replicates randomly sampled within the four plots (Table 1). To obtain data for shoots ranging in vigour, shoots of different dimensions were cut off at their base and their length, basal and mid‐length diameters, and the numbers of grapes and primary leaves were measured. Additional data such as shoot breakage, diameter of each grape peduncle, and numbers of lateral shoots and leaves were also recorded. In 1998, primary and lateral leaf areas were measured for each individual leaf using a digital scanner system connected to a PC, and image analysis software (Image Tool v 2·0). In both 1999 and 2000, random foliar disc subsamples were collected to determine mean primary and lateral specific leaf areas (SLA; dm2 fresh area g–1 d. wt) and total leaf area per shoot. Above‐ground vine parts were then sorted into five tissue types (primary and lateral leaves, primary and lateral stems, and grapes), dried in a convection oven at 70 °C to a constant mass and weighed. In 1999, primary stem fresh volume was determined via water displacement (Archimedes’s principle) on shoot subsamples. Cores were immersed in water and simultaneously weighed. Density was determined using volume and oven‐dry weight.
Table 1.
Sampling calendar for the allometric equations determination experiment (expt 1) and the illustrative experiment (expt 2)
| Experiment 1 | Experiment 2 | |||||
| Year | doy | S | n | doy | S | n |
| 1998 | 13 | 282 | 12 | |||
| 156 | 414 | 12 | ||||
| 166 | 483 | 12 | ||||
| 180 | 614 | 12 | ||||
| 271 | 1547 | 12 | ||||
| 1999 | 132 | 244 | 12 | 130 | 224 | 308 |
| 155 | 433 | 15 | 152 | 410 | 285 | |
| 187 | 720 | 15 | 182 | 663 | 285 | |
| 221 | 1133 | 15 | 215 | 1058 | 284 | |
| 249 | 1448 | 15 | 244 | 1391 | 285 | |
| 265 | Grapes harvested | 265 | Grapes harvested | |||
| 2000 | 137 | 254 | 18 | 143 | 280 | 265 |
| 171 | 517 | 18 | 165 | 438 | 254 | |
| 200 | 793 | 18 | 192 | 736 | 264 | |
| 223 | 1047 | 18 | 220 | 1008 | 265 | |
| 252 * | 1370 | 60 | 255 | 1407 | 265 | |
| 259 | 1452 | 18 | ||||
| 269 | Grapes harvested | 269 | Grapes harvested | |||
Both biomass and dimensions were simultaneously determined in Experiment 1, but no destructive measurements were made in Experiment 2. doy, Julian day of the year; S, cumulative degree‐days calculated from 1 Jan. of each year using a base temperature of 10 °C; n, number of shoots analysed. *Data collected on 9 Sep. 2000 (doy = 252) were used for validation.
Determination and validation of allometric equations
Allometric relationships between shoot dimensions, biomass amounts and leaf area were analysed initially on a harvest date basis, and then on a yearly basis. Linear and non‐linear regression models were evaluated to determine the most suitable functional form for the allometric equations; several explanatory variables were considered in the various regressions, including the basal (Db, in cm) and mid‐length stem diameters (Dm, in cm); stem length (L, in cm); the numbers of grapes (ng), primary (npl) and lateral (nll) leaves; and the diameter of the grape peduncle (Dp, in mm). Six multiple equations per year providing a reasonable balance between the cost of data collection and the loss of accuracy in the prediction were developed using stepwise and R2 selection procedures for predictor variables in the software package Systat (SPSS Inc., Chicago, IL, USA). Dry mass of the leafless primary stem (Wps, in g) was best described on a yearly basis using a common log‐transformed function:

where S is the sum of degree‐days on a base of 10 °C calculated from 1 January each year (Moncur et al., 1989), and a, b, c, d and k are fitted parameters. Similar seasonal allometric regressions were also fitted for biomasses of the lateral stem, primary and lateral leaves and total plant leaf area. However, the dry mass of a grape (Wg) was best estimated from the basal diameter of the bunch peduncle (Dp), the cumulative degree‐days (S) and the number of grapes per shoot (ng):
log (Wg) = log k + a log (Dp) + c log (S) + d log (ng)(2)
Finally, multi‐linear regression slopes were compared manually following Tomassone et al. (1983); as there were no significant differences between years, a single generalized multi‐year equation for each vine component was computed from the 3‐year pooled data (Table 2).
Table 2.
Multi‐year seasonal allometric regression equations for six above‐ground components of a vine shoot
| Variable | a | b | c | d | k | R 2 | s.e. | n |
| Primary stem mass (g) | 1·799 | 0·998 | 0·565 | ‐ | –2·145 | 0·965 | 0·100 | 218 |
| Lateral stem mass | 5·436 | 0·696 | 0·992 | ‐ | –3·179 | 0·793 | 0·327 | 142 |
| Primary leaf mass | 1·091 | 0·400 | 0·298 | 0·739 | –1·206 | 0·949 | 0·079 | 218 |
| Lateral leaf mass | 4·380 | 0·682 | 1·266 | ‐ | –3·661 | 0·819 | 0·279 | 153 |
| Grape mass* | 2·156 | ‐ | 2·846 | –0·293 | –8·428 | 0·924 | 0·244 | 251 |
| Total leaf area (dm2) | 1·289 | 0·666 | 0495 | ‐ | –1·032 | 0·932 | 0·104 | 128 |
a, b, c, d and k represent regression parameters of the equation log W = log k + a log Dm + b log L + c log S + d log npl, where Dm, L, S and npl are primary stem diameter at mid‐length (cm), main stem length (cm), cumulative degree‐days (using a base temperature of 10 °C) and number of primary leaves per shoot, respectively. R2 is the adjusted correlation coefficient, s.e. is the standard error of the variable estimate and n is the number of samples. All regression equations were highly significant at P < 0·01 level. * Note that for grapes, a and d represent regression parameters of the grape peduncle diameter (Dp, mm) and the number of grapes per shoot (ng), respectively.
Validation of the multi‐year allometric regressions was specifically checked on 9 Sep. 2000, using 60 additional shoots randomly selected from the four plot. Observed vegetative and reproductive biomass data were compared with predicted values calculated according to the procedure described above.
Illustrative application of the allometrically based regressions approach
The accuracy and reliability of the allometric equations established above were tested during the 1999 and 2000 growing seasons on 48 randomly selected grapevines distributed equally in the four plots. As no destructive samplings were made in this experiment, objectives were not to validate sensu stricto seasonal evolution of simulated biomass per vine but rather (1) to illustrate the sensitivity of the approach to environmental conditions in general and soil N availability in particular; and (2) to determine an efficient sampling scheme for the measured variables. Mid‐height diameter and length of primary stem, peduncle diameter of each grape and number of primary leaves and grapes per shoot were measured at five dates through each growing season on all the shoots of 12 replicate vines per plot (Table 1), giving 2790 measurements in total. Two operational field‐variables currently followed in viticultural practices, fruit yield and pruned wood measurements, were determined at harvest and before the winter, respectively, and compared with corresponding simulated data.
RESULTS
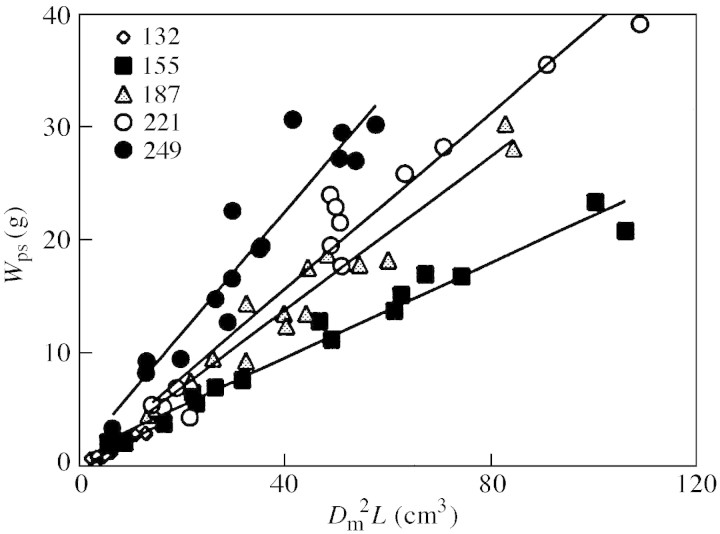
For leafless primary stems (Fig. 1), and to a lesser extent for other vegetative parts of vine shoots (data not shown), there were strong allometric relationships between dry mass and shoot dimensions [i.e. stem length and (diameter measured at mid‐length)2]; but these relationships differed substantially from date to date mainly due to a significant increase in stem mass over the growing season (Fig. 2). To generate seasonal allometric equations, cumulative degree‐days were therefore introduced systematically to the regression model as an additional explanatory variable (Table 2). Adding further variables (e.g. the number of primary leaves per shoot) to regression equations did not significantly improve the predictive ability of most seasonal equations, but did appear to be necessary to explain additional variance of primary leaf biomass. For reproductive parts, the best fit equation was obtained by correlating individual grape dry mass against the diameter of its peduncle, the number of grapes per shoot and cumulative degree‐days (Table 2).
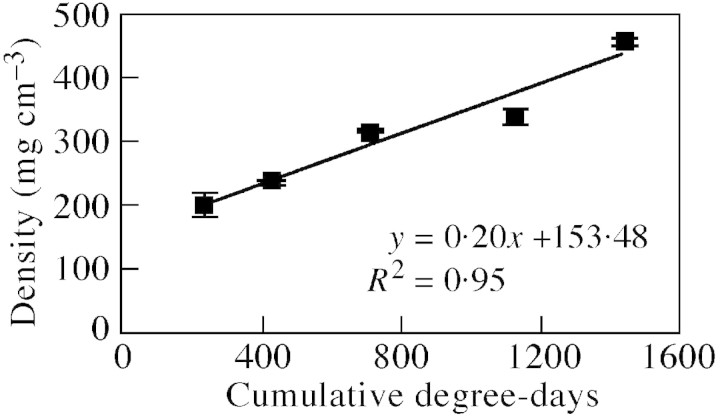
Fig. 1. Seasonal course of averaged primary stem density (mg f. wt cm–3) measured in 1999 on subsamples of 15 shoots per sampling date. Cumulative degree‐days were calculated from 1 Jan. 1999 using a base temperature of 10 °C. Vertical bars represent s.e.m. n = 15.
Fig. 2. Allometric relationships between primary stem dry mass (Wps, in g) and a combination of squared mid‐length diameter and length of the primary stem (Dm2L, in cm3) for five sampling dates in 1999 (see Table 1).
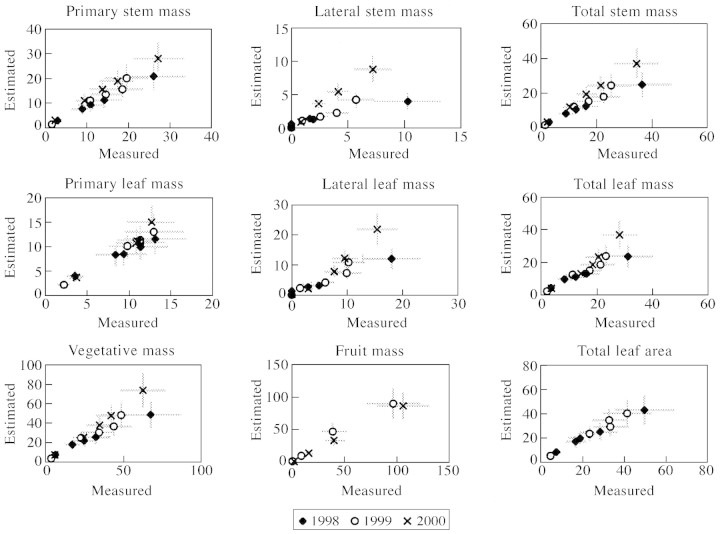
As there were no significant between‐year differences for the regression parameters, a unique multi‐year regression equation was computed from the pooled data for all 3 years for each vine component providing the best adjusted squared multiple correlation (Table 2). The logarithmic regression models generally had high R2 values and fitted the data well, as indicated by residual analysis (data not shown) or by linear 1 : 1 relationships observed when averaged daily measurements per vine component were plotted against corresponding mean simulated values (Fig. 3). Values of R2 were significantly lower for lateral growth components than for grapes, primary stems and leaves (Table 2).
Fig. 3. Comparison of field measurements and predicted values from multi‐year regression equations for various above‐ground components of a vine shoot. Each point represents the average value per date; horizontal and vertical bars represent s.e.m. n = 12–18.
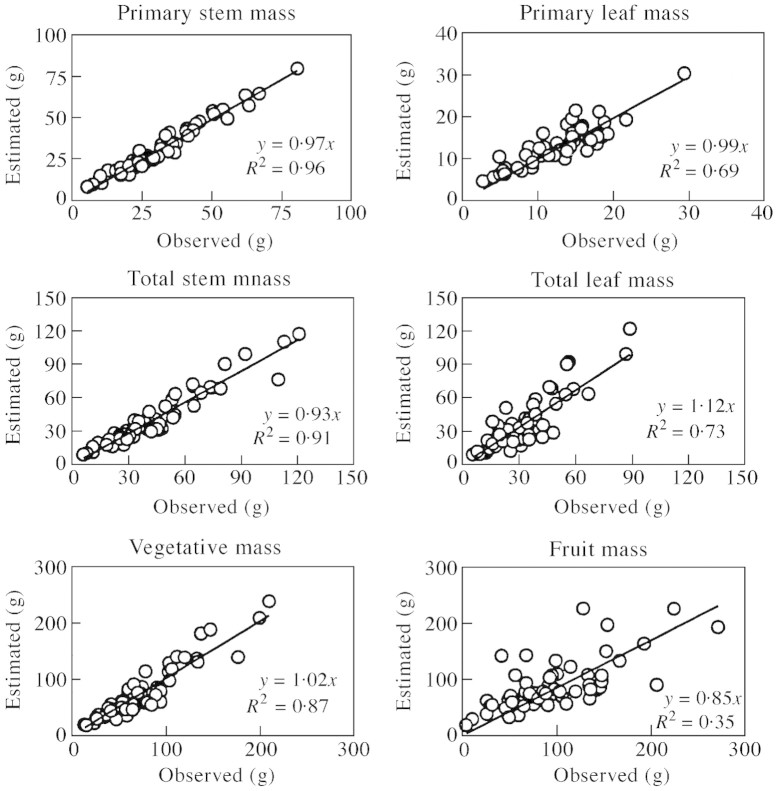
Multi‐year regression equations were validated on 9 Sep. 2000 on 60 shoots selected at random within the four experimental plots (Fig. 4). Dry mass of vegetative organs was well‐simulated by the model, especially for primary stems and leaves for which ratios of predicted to observed mean values per subplot differed by less than 8 % (data not shown). Less accurate predictions can be made using a single multi‐year equation to calculate the reproductive biomass (Fig. 4).
Fig. 4. Validation of multi‐year regression equations for various above‐ground components of a vine shoot. Data were collected on 9 Sep. 2000 (doy = 253) within the four experimental plots. n = 60.
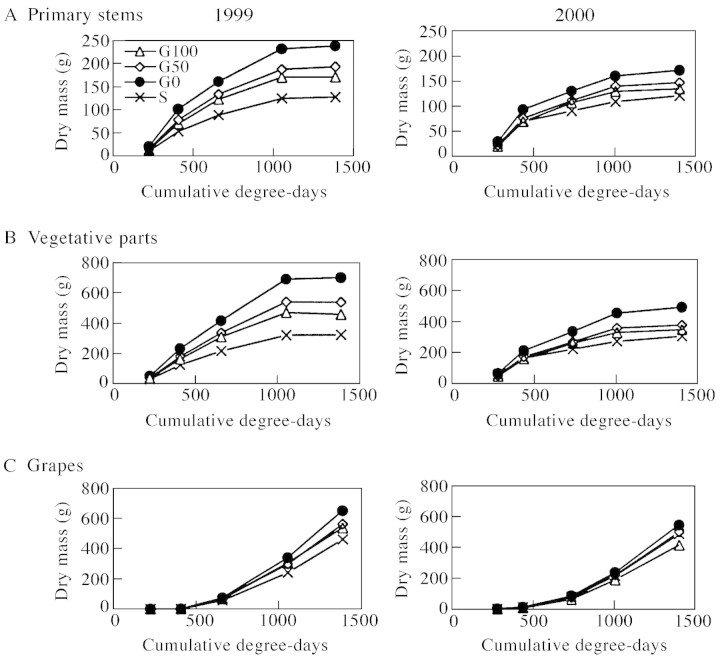
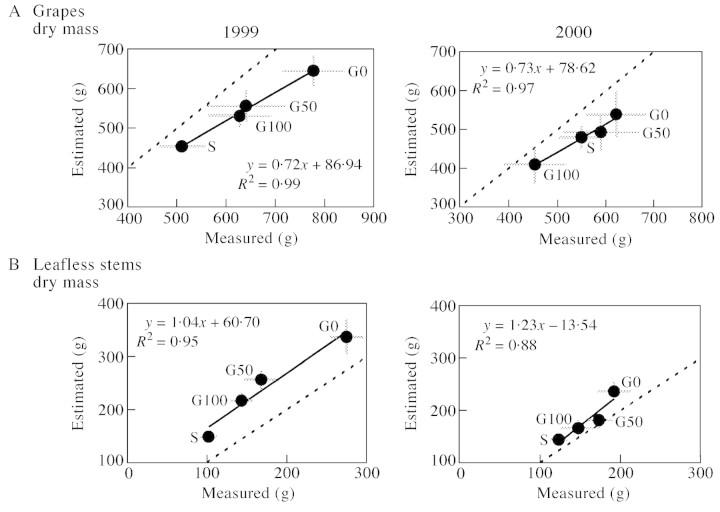
An illustration of the accuracy and reliability of the equations established above was demonstrated by comparing seasonal evolution of dry mass of grapevines grown at four contrasting levels of soil nitrogen (Figs 5 and 6). In both 1999 and 2000, estimates of vegetative above‐ground dry mass (representing total stems plus leaves per vine) were significantly higher in grapevines grown in the non‐grassed plot than in the half‐ or fully‐ grassed plots (Fig. 5). Compared with the non‐grassed treatment, full‐grassing decreased vegetative dry mass at maturity by 1·54 and 1·43 in 1999 and 2000, respectively. Grapevines grown in the gravelly soil accumulated less dry mass throughout the season, in accordance with the low soil N availability of the plot. Grapevines appeared to be less vigorous in 2000 than in 1999, especially for non‐ and half‐grassed treatments (Fig. 5), partly due to fewer primary shoots per vine in 2000 (Table 3) and a significant reduction in secondary growth (data not shown). Seasonal evolution of grape dry mass accumulation followed the typical pattern reported in the literature: at maturity, the yield was higher in non‐grassed than in grassed plots, and represented around 50, 54 and 60 % of total biomass in ungrassed, fully‐grassed and gravelly soil plots, respectively, for both years (Fig. 6). The effect of year was less pronounced on grape dry mass than on vegetative dry mass accumulation (Fig. 5), even though grape number per vine was significantly lower in 1999 than in 2000 (Table 3). Comparisons between simulated and field‐observed dry mass data were made for fruit yield and pruned wood biomass, which are two operational field variables currently followed in viticultural practices. In both 1999 and 2000, mean dry mass of total grapes per vine estimated in each plot at maturity (i.e. at approx. 1400 °d) was significantly correlated to corresponding data observed at harvest (R2 > 0·95, Fig. 6A). Low slope values were explained by the time lag (21 and 14 d in 1999 and 2000, respectively) between simulations and observations. Similarly, mean dry mass per plot of simulated total stems (i.e. primary plus lateral stems) was significantly correlated to mean dry mass of pruned wood measured during the following winter (Fig. 6B). In this case, simulated data were slightly higher than observed data, probably because it is viticultural practice to leave two annual shoots per vine for the following season, which were not actually weighed.
Fig. 5. Predicted seasonal evolution of mean dry mass (g per vine) for primary stems (A), vegetative (B) and reproductive parts (C) of grapevine grown under four levels of soil N. G0, G50, G100 and S represent ungrassed (circles), half‐grassed (diamonds), fully‐grassed (triangles) and gravelly soil (crosses) plots, respectively. Data were estimated for both years using the same multi‐year allometric regression equations defined in Table 2. For legibility, s.e.m. is not plotted.
Table 3.
Mean number of primary shoots and grapes per vine (± s.e.) for the plants used in the illustrative experiment (Experiment 2)
| Year | G0 | G50 | G100 | S | |
| Grapes | 1999 | 11·7 ± 0·4 | 11·3 ± 0·7 | 11·7 ± 0·8 | 11·1 ± 0·5 |
| 2000 | 8·4 ± 0·8 | 9·4 ± 0·9 | 8·5 ± 0·8 | 8·8 ± 0·5 | |
| Shoots | 1999 | 6·1 ± 0·2 | 5·8 ± 0·3 | 5·9 ± 0·2 | 5·8 ± 0·2 |
| 2000 | 5·3 ± 0·4 | 5·8 ± 0·3 | 5·5 ± 0·2 | 5·5 ± 0·2 |
G0, G50, G100 and S represent ungrassed, half‐grassed, fully‐grassed and gravelly soil plots, respectively.
Fig. 6. Comparison of measured mean dry mass values per vine of grapes (A) or total stems (B) to predicted values estimated from multi‐year regression equations. (See Table 1 for more information concerning sampling calendar). G0, G50, G100 and S represent ungrassed, half‐grassed, fully‐grassed and gravelly soil plots, respectively. Vertical and horizontal bars represent s.e.m. Solid and dashed lines represent the least square regression and the 1 : 1 line between measured and predicted values, respectively.
DISCUSSION
Different dimensions of a plant are assumed to be related to each other (Corner, 1949). As a plant grows, its dimensions change in ways that maintain their functional balance, but not in ways that maintain constant ratios between the dimensions. This study confirms the earlier observations (Williams et al., 1985; Bindi et al., 2001) that equations based on these allometric relationships provide a reliable means of estimating the current year’s leaf area and above‐ground biomass of a field‐grown grapevine. At each sampling date, primary stem dry mass of an individual vine shoot—and to a lesser extent biomass of other vegetative organs—was linearly related to stem diameter and length after a so‐called two‐sided log transformation on both the dependent and independent variables. Numerous similar allometric relationships have been reported in studies of woody plants which predict—in the light of the pipe‐model theory—leaf area or tree biomass, using mainly the cross‐sectional area of the trunk (Bormann, 1990; Niklas, 1995; Bartelink, 1997; Clough et al., 1997; Van et al., 1998; Droppelmann et al., 2000; Lott et al., 2000; Ketterings et al., 2001). In most of these equations, incorporating tree height into the dry mass equations in addition to stem diameter leads to only minor improvements in the predictions (Tahvanainen, 1996). In the present study, however, including height as an independent variable in the biomass model significantly improved the predictive power of the equations, mainly because when wood density remains unchanged, the dry mass of the primary stem is directly proportional to the stem volume, which is a function of the diameter and height. In other words, it is relevant to assume that any viticultural practices (such as shoot trimming) that directly reduce primary stem length, but not diameter, also modify stem dry mass. Finally, including cumulative degree‐days as an additional predictor in the regression equation was a simple and effective way of extrapolating allometric equations from a daily to a seasonal basis, mainly because vine development rate and physiological processes are primarily temperature dependent. The most adequate method of calculating degree‐days and the limits of its uses were not addressed in the present study (Bonhomme, 2000).
Linear regression models have often been preferred over non‐linear models due to the ease of the calculations. Therefore, to estimate parameters of the regression equations in a simple linear form using the least sum of squares method, both dependent and independent variables were log10‐transformed despite the potential disadvantages of logarithmic transformations (Baskerville, 1972). In return, using linear transformations instead of non‐linear regression analyses removed the heteroscedasticy from the residuals (Crow and Laidly, 1980). In fitting the multiple linear equations, the independent variables were chosen not only because they provided the best overall correlation with dry mass, but also for the ease and speed with which they could be measured in the field. Therefore, mid‐length stem diameter was considered an easier and more accurate measurement than basal stem diameter. In the case of primary leaves, omitting the variable relating to the number of primary leaves from the equation would provide a simpler form of the relationship, but also results in a less accurate estimate of leaf biomass. Adding further surrogate measurements (i.e. number of lateral stems or leaves per shoot) as independent variables in the equations would have explained additional variance for lateral growth biomass, but would also have reduced the practicality of the equations.
Using a unique multi‐year equation led to a less efficient estimate of reproductive dry mass per shoot than vegetative dry mass, probably because grape dry mass is highly related to the number of berries per grape, a variable that was not measured in the present study. In addition, it can also be supposed that the discrepancy between estimated and measured grape mass values, especially at the end of growing season (Fig. 4), resulted from a failure to account for the water stress that may affect carbohydrate accumulation in berries (and therefore grape dry mass) to a greater extent than dimensional growth of the grape peduncle. Further improvements are still needed to estimate grapes yield more accurately, particularly at the end of the season.
This study has quantified in detail the seasonal evolution of dry mass of field‐grown grapevines over 3 years and at four levels of soil N in the Bordeaux region of France. There are, of course, many questions still to be addressed, including how many and how frequently shoots must be measured to obtain a reasonable estimate of biomass and yield in a given vineyard or plot, but the qualitative similarities between the observations and estimations reported here show the soundness and appropriateness of our approach. Allometrically based regression equations are therefore a powerful technique by which to determine in a non‐destructive and cost‐effective manner the seasonal balance between vine shoots and fruit production from simple vine measurements and climatic data. Along with other viticultural indices (Smart, 1990), these values should be useful as guidelines for researchers and growers to diagnose source/sink relationships of their vines and to adopt canopy management techniques that will have a beneficial impact on wine grape production, fruit composition and wine quality.
ACKNOWLEDGEMENTS
This research was funded in part by the Mexican government (Grant conacyt‐cefi‐sfere, 62247–1997) and the Interprofessional Council of Bordeaux Wines (CIVB). We thank C. Barbot, R. Chignon, J. Giraudon and T. Robert for their technical support.
Supplementary Material
Received: 8 June 2001; Returned for revision: 21 September 2001; Accepted: 14 December 2001.
References
- BartelinkHH.1997. Allometric relationships for biomass and leaf area of beech (Fagus sylvatica L). Annals of Forest Science 54: 39–50. [Google Scholar]
- BaskervilleGL.1972. Use of logarithmic regression in the estimation of plant biomass. Canadian Journal of Forest Research 1: 49–53. [Google Scholar]
- BindiM, Fibbi L, Miglietta F.2001. Free air CO2 enrichment (FACE) of grapevine (Vitis vinifera L.): II. Growth and quality of grape and wine in response to elevated CO2 concentrations. European Journal of Agronomy 14: 145–155. [Google Scholar]
- BindiM, Miglietta F, Gozzini B, Orlandini S, Seghi L.1997. A simple model for simulation of growth and development in grapevine (Vitis vinifera L.). I. Model description. Vitis 36: 67–71. [Google Scholar]
- BonhommeR.2000. Bases and limits to using ‘degree‐day’ units. European Journal of Agronomy 13: 1–10. [Google Scholar]
- BormannBT.1990. Diameter‐based biomass regression models ignore large sapwood‐related variation in Sitka spruce. Canadian Journal of Forest Research 20: 1098–1104. [Google Scholar]
- BrouatC, Giberneau M, Amsellem L, McKey D.1998. Corner’s rules revisited: ontogenic and interspecific patterns in leaf‐stem allometry. New Phytologist 139: 459–470. [Google Scholar]
- CloughBF, Dixon P, Dalhaus O.1997. Allometric relationships for estimating biomass in multi‐stemmed mangrove trees. Australian Journal of Botany 45: 1023–1031. [Google Scholar]
- CornerEJH.1949. The durian theory of the origin of the modern tree. Annals of Botany 13: 368–414. [Google Scholar]
- CrowTR, Laidly PR.1980. Alternative models for estimating woody plant biomass. Canadian Journal of Forest Research 10: 367–370. [Google Scholar]
- DroppelmannKJ, Berliner PR.2000. Biometric relationships and growth of pruned and non‐pruned Acacia saligna under runoff irrigation in northern Kenya. Forest Ecology and Management 126: 349–359. [Google Scholar]
- GutierrezAP, Williams DW, Kido H.1985. A model of grape growth and development: the mathematical structure and biological considerations. Crop Science 25: 721–728. [Google Scholar]
- KetteringsQM, Coe R, van Noordwijk M, Ambagau Y, Palm CA.2001. Reducing uncertainly in the use of allometric biomass equations for predicting above‐ground tree biomass in mixed secondary forests. Forest Ecology and Management 146: 199–209. [Google Scholar]
- LottJE, Howard SB, Black CR, Ong CK.2000. Allometric estimation of above‐ground biomass and leaf area in managed Grevilla robusta agroforestry systems. Agroforestry Systems 49: 1–15. [Google Scholar]
- MoncurMW, Rattignan K, Mackenzie DH, McIntyre GN.1989. Base temperatures for budbreak and leaf appareance of grapevines. American Journal of Enology and Viticulture 40: 21–26. [Google Scholar]
- NiklasKJ.1994. Plant allometry. The scaling of form and process. Chicago, USA: The University of Chicago Press. [Google Scholar]
- NiklasKJ.1995. Size‐dependent allometry of tree‐height, diameter and trunk‐taper. Annals of Botany 75: 217–227. [Google Scholar]
- Rodriguez‐LovelleB, Soyer JP, Molot C.2000. Nitrogen availability in vineyard soils according to soil management practices. Effects on vine. Acta Horticulturae 526: 277–285. [Google Scholar]
- SmartRE, Dick JK, Gravett IM, Fisher BM.1990. Canopy management to improve grape yield and wine quality – principles and practices. South African Journal of Enology and Viticultur e 11: 3–17. [Google Scholar]
- TahvanainenL.1996. Allometric relationships to estimate above‐ground dry mass and height in Salix Scandinavian Journal of Forest Research 11: 233–241. [Google Scholar]
- TeleniusB, Verwijst T.1995. The influence of allometric variation, vertical biomass distribution and sampling procedure on bio mass estimates in commercial short rotation foests. Bioresource Technology 51: 247–253. [Google Scholar]
- TomassoneR, Lesquoy E, Millier C.1983. La régression: nouveau regard sur une ancienne méthode statistique. In: Masson, ed. Actualités scientifiques et agronomiques de l’INRA, Paris. [Google Scholar]
- VanDR, Palmiotto PA, Strimbeck GR.1998. Allometric equations for two South American conifers: test of a non‐destructive method. Forest Ecology and Management 106: 55–71. [Google Scholar]
- WermelingerB, Baumgärtner J.1991. A demographic model of assimilation and allocation of carbon and nitrogen grapevines. Ecological Modelling 53: 1–26. [Google Scholar]
- WilliamsDW, Williams LE, Barnett WW, Kelley KM, McKenry MV.1985. Validation of a model for the growth and development of the Thompson seedless grapevine. I. Vegetative growth and fruit yield. American Journal of Enology and Viticulture 36: 275–282. [Google Scholar]
Associated Data
This section collects any data citations, data availability statements, or supplementary materials included in this article.


