

Abstract
Objectives
To investigate whether the preventive use of cranberry capsules in long-term care facility (LTCF) residents is cost-effective depending on urinary tract infection (UTI) risk.
Design
Economic evaluation with a randomized controlled trial.
Setting
Long-term care facilities.
Participants
LTCF residents (N = 928, 703 female, median age 84), stratified according to UTI risk.
Measurements
UTI incidence (clinically or strictly defined), survival, quality of life, quality-adjusted life years (QALYs), and costs.
Results
In the weeks after a clinical UTI, participants showed a significant but moderate deterioration in quality of life, survival, care dependency, and costs. In high-UTI-risk participants, cranberry costs were estimated at €439 per year (1.00 euro = 1.37 U.S. dollar), which is €3,800 per prevented clinically defined UTI (95% confidence interval = €1,300–infinity). Using the strict UTI definition, the use of cranberry increased costs without preventing UTIs. Taking cranberry capsules had a 22% probability of being cost-effective compared with placebo (at a willingness to pay of €40,000 per QALY). In low-UTI-risk participants, use of cranberry capsules was only 3% likely to be cost-effective.
Conclusion
In high-UTI-risk residents, taking cranberry capsules may be effective in preventing UTIs but is not likely to be cost-effective in the investigated dosage, frequency, and setting. In low-UTI-risk LTCF residents, taking cranberry capsules twice daily is neither effective nor cost-effective.
Keywords: economic evaluation, geriatrics, long-term care facility, urinary tract infection, prevention, cranberry
Urinary tract infection (UTI) is a common bacterial infection in residents of long-term care facilities (LTCFs).1–4 The effectiveness of the use of cranberry capsules to prevent UTIs was assessed in a randomized controlled trial.5 In residents with high UTI risk, taking cranberry capsules twice daily reduced the incidence of clinically defined UTI by 26%. No reduction was found for strictly defined UTI or in residents with low UTI risk. The current brief report investigates the effect of UTI on health and costs and whether the preventive use of cranberry capsules in LTCFs is cost-effective.
Methods
This economic evaluation was part of a double-blind randomized placebo-controlled multicenter trial.5 Residents from LTCFs (N = 928, median age 84, 703 female) were randomized to receive cranberry or placebo capsules twice daily for 12 months. The cranberry capsules contained 500 mg of the product with 1.8% proanthocyanidins (9 mg). Participants were stratified according to UTI risk (including long-term catheterization, diabetes mellitus, ≥1 UTIs in the preceding year). Main outcomes of the trial were incidence of UTI according to a clinical definition (following clinical practice guidelines for residents in LTCFs) and a strict definition (with confirmation by a positive dipslide or culture).5
Cost-Effectiveness and Cost-Utility Analysis
The economic evaluation consisted of a cost-effectiveness analysis (CEA) from a narrow perspective and a cost-utility analysis (CUA) from a lifelong societal perspective for high- and for low-UTI-risk participants.
The CEA from a narrow perspective was based directly on the trial data during follow-up, to prevent modeling assumptions. Effectiveness was measured according to the number of clinically defined and strictly defined UTIs (first and recurrent). Costs included only cranberry use.
The CUA was performed from a lifelong societal perspective. Costs, survival and quality-adjusted life years (QALYs) were estimated using a non-Markovian state-transition model, with parameters estimated from the trial data. In this model, the cranberry and placebo groups differed in their clinically defined UTI infection rate but not in the consequences per UTI. Thus, it was implicitly assumed that prevented UTIs are comparable with nonprevented UTIs and that cranberry use has no relevant effects other than cranberry costs and UTI prevention. These modeling assumptions were made beforehand because it was clear that the study would have insufficient power for a direct randomized economic comparison.
In the CUA model (Figure1), participant time was categorized into five model states: during the initial 2 months and before the first UTI, after the initial 2 months and before the first UTI, during the first month after the first UTI, after the first month after the first UTI, and death.
Figure 1.
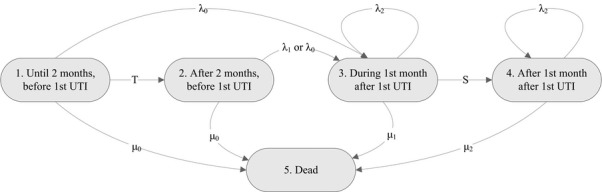
The state-transition model used in the economic evaluation. UTI = Urinary Tract Infection.
UTI Infection Rate and Mortality
Three separate annual UTI infection rates were estimated in a combined Poisson regression analysis. Infection rates in the cranberry and placebo groups were different after the first 2 months and before the first UTI (State 2). No effect of cranberry use was seen in the initial 2 months (State 1) or after the first UTI (States 3 and 4). Occurrence of a first UTI was associated with greater mortality during the subsequent month (State 3) and after the subsequent month (State 4). Annual mortality was estimated in a combined Poisson regression analysis.
Utilities
Utilities represent the valuation of the quality of life of the participants on a scale anchored at 1 (perfect health) and 0 (as bad as being dead). Utility was measured using the EQ-5D classification system, which is a brief questionnaire with five domains (mobility, self-care, usual activities, pain and discomfort, and anxiety and depression), each with three levels (no, some, or extreme problems).6 Utility values were assigned to the EQ-5D using the Dutch tariff.7 Valuations were also obtained using a visual analog scale (VAS) ranging from 100 (perfect health) to 0 (worst imaginable health), which was transformed to a utility scale using a power transformation.8 EQ-5D and VAS measurements were obtained from the participants (11%) or from well-informed nurses or caregivers (89%).
Utility before and after the first UTI (parameters U0 and U2) was estimated from EQ-5D and VAS measurements obtained at baseline and after 6 and 12 months (correcting for time). In addition, UTIs were assumed to have a short-term effect on utility for 2 weeks. Additional EQ-5D and VAS measurements were obtained in 123 participants with a clinically defined UTI (from 17 different LTCFs) every 3 days over 3 weeks after the UTI to estimate this effect. The utility decrement during the UTI was estimated as the difference between the average over the first 2 weeks and the average over the third week (parameter ΔU, attributed to State 3 with parameter U1 = U2−ΔU × 14/30).
Costs
The economic model included two types of costs. The first was the costs of cranberry use (parameter c1). These costs were estimated at €439 annually (€0.62 per intake) based on one capsule twice a day, a market price of €44 for 180 capsules, on average 45 seconds of nursing time per capsule (estimated using time registrations), nursing time valued at €30 per hour,9 and 97% adherence (1.00 euro = 1.37 U.S. dollar).
The second type of costs were the costs associated with each UTI (parameter c2, Table1), including costs of UTI diagnostics and antibiotic treatment, additional care by the elderly-care physician, additional nursing care, and hospitalizations. Costs of UTI diagnostics and antibiotic treatment per UTI were calculated from actual costs in patient records for each UTI (n = 548). Additional care by the elderly-care physician was estimated at on average €25 per UTI (10–30 minutes of time, valued at €111 per hour9,10). Additional nursing costs during the 2 weeks after a UTI were estimated in proportion to the Care Dependency Scale,11 which measures 15 items of basic care needs, each rated on a 5-point scale (1 = completely dependent; 5 = completely independent). Hospitalizations costs were recorded for six UTIs (1% of n = 548), all in high-UTI-risk participants. Costs per hospitalization ranged from €3,000 (for 6 days of normal hospital care) to €15,000 (for 7 days of normal care and 5 days of intensive care).9
Table 1.
Parameters for the Health–Economic Model, Estimated from the Trial Data
| Parameter | Estimated Value | (95% Confidence Interval) |
|---|---|---|
| UTI infection ratesb in low-UTI-risk participants | ||
| Rate before the first UTI, during the first 2 months (λ0) | 0.32 | (0.23–0.40) |
| Hazard ratio before first UTI,after first 2 months (λ1/λ0)a,c | 1.41 | (0.77–1.86) |
| Hazard ratio after the first UTI (λ2/λ0)c | 4.02 | (2.11–5.29) |
| UTI infection ratesb in high-UTI-risk participants | ||
| Rate before the first UTI, during the first 2 months (λ0) | 0.81 | (0.68–0.94) |
| Hazard ratio before first UTI, after first 2 months (λ1/λ0)a,c | 0.75 | (0.52–0.94) |
| Hazard ratio after the first UTI (λ2/λ0)c | 1.81 | (1.35–2.18) |
| Mortalityb | ||
| Rate before the first UTI (μ0) | 0.33 | (0.29–0.38) |
| Hazard ratio during the first month after first UTI (μ1/μ0)c | 3.57 | (2.00–4.81) |
| Hazard ratio after the first month after first UTI (μ2/μ0)c | 1.32 | (0.87–1.67) |
| Utilitiesd based on EQ-5D | ||
| Before the first UTI (U0) | 0.37 | (0.36–0.38) |
| Decrement after the first UTI (U2–U0)c | 0.02 | (−0.01–0.05) |
| Decrement during first 2 weeks after first UTI (ΔU)c | 0.04 | (0.01–0.07) |
| Utilitiesd based on visual analog scale | ||
| Before the first UTI (U0) | 0.73 | (0.72–0.74) |
| Decrement after the first UTI (U2–U0) | 0.00 | (−0.02–0.02) |
| Decrement during first 2 weeks after first UTI (ΔU) | 0.03 | (0.00–0.05) |
| Annual costs of cranberry use, € (c1)c | 439 | — |
| Cost per UTI, € | ||
| Cost of diagnostics | 8 | (6–10) |
| Cost of antibiotic treatment | 3 | (2–4) |
| Cost of elderly care physician | 25 | (22–28) |
| Cost of additional nursing care | 120 | (49–194) |
| Cost of hospitalizations | 40 | (−8–74) |
| Total cost per (prevented or nonprevented) UTI (c2) | 196 | (111–278) |
Only in the cranberry group.
Annual event rate.
Relative or absolute change during the specified period, compared with the base value.
Valuation of quality of life of the participants on a scale anchored at 1 (perfect health) and 0 (as bad as being dead).
UTI = urinary tract infection.
Costs were presented in euros, at 2013 prices (updated if necessary using the general Dutch consumer price index).12 Included costs were all medical costs, which for this trial population coincided with the societal perspective.
Lifelong Outcomes
The model shown in Figure1 and Table1 was used to extrapolate the trial period to lifelong outcomes. Life expectancy was calculated as the expected total time spent in States 1 to 4. QALYs were calculated by weighing the time in each state with the appropriate utility value, discounted at δ = 4%.13 Using this approach, the following formula for the difference in discounted QALYs between the cranberry and the placebo groups was derived:
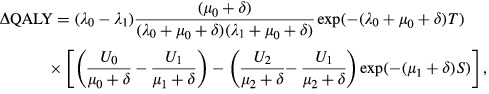 |
where T denotes the initial 2 months and S denotes the 1 month after the first UTI. A similar formula was derived for the discounted costs. The models for the cranberry and placebo groups differ only in their value for the infection rate (λ1 and λ0, respectively) and in their value for the annual cranberry costs (c1 and 0, respectively).
Statistical Analysis
Uncertainty due to sampling error for the estimated lifelong outcomes was assessed using bootstrap analysis (using B = 10,000 bootstrap samples). For each bootstrap sample, all model parameters (Table1) were re-estimated, and the lifelong formulae were used to estimate outcome. The 95% confidence intervals (CIs) for the parameters and outcomes were assessed from the 2.5 and 97.5 percentiles among the bootstrap samples.10 Statistical analyses for the economic evaluation were performed in R version 2.13.0 (Vienna, Austria).
Depending on the willingness to pay (WTP) for obtained effectiveness, cranberry use is estimated to be cost-effective if it has a better net benefit (NB = WTP × effectiveness−costs) than placebo. Cost-effectiveness acceptability curves were used to plot the probability that cranberry use is more cost-effective than placebo as a function of WTP (estimated as the percentage of bootstrap samples in which cranberry use had a better estimated NB). Confidence intervals for the cost-effectiveness ratio were calculated as WTP values for which the difference in net benefit was not significantly different.14 The base-case CUA compared total societal costs with QALYs calculated from the Dutch tariff for the EQ-5D at a WTP of €40,000 per QALY.
Results
Effect of UTIs on Mortality, Utility, and Costs
Quality of life was significantly but moderately worse during a UTI; comparing the first 2 weeks after a UTI with the third week, averages were 0.341 versus 0.379 for the EQ-5D (difference 0.038, P = .02) and 0.727 versus 0.753 for the VAS (difference 0.026, P = .03).
Mortality in the month after a first UTI was 3.6 times as great as in residents without a UTI (Table1). After more than a month, the difference was not statistically significant.
The Care Dependency Scale was also significantly but moderately worse during a UTI (40.7 vs 42.0; difference 1.2; P = .01), with an estimated 4% increase in nursing costs in the 2 weeks after a UTI. Total healthcare costs associated with (prevented) UTIs were estimated at €196, primarily consisting of the additional nursing care (61%), followed by hospitalization costs (20%), care by the elderly-care physician (13%), diagnostics (4%). and antibiotic treatment (2%).
High-UTI-Risk Participants
Cranberry use on average prevented 0.09 clinically defined UTIs (0.69 vs 0.78, P = .32) during the trial follow-up (of 289 vs 289 days, P = .99). The associated costs were estimated at €3,800 per prevented UTI (95% CI = €1,300–infinity). Cranberry use did not prevent strictly defined UTIs during follow-up (0.28 vs 0.22, P = .30).
From a lifetime societal perspective, the reduced clinical UTI infection rate resulted in improvements in other health outcomes and costs, although not significantly (Table2). Life expectancy was estimated to be approximately 2 weeks longer (0.044 years, 95% CI = −0.023–0.091). The savings on costs associated with UTIs were much smaller than the cranberry costs, use of cranberry capsules increased lifelong total costs by €941 (95% CI = €779–1,055). Whether this cost difference is economically acceptable depends on how much one is willing to pay for the health improvement in terms of QALYs (Figure2). For relatively low willingness to pay up to €20,000 per QALY, the probability that cranberry use is more cost-effective than placebo was estimated at less than 1% (in the base-case analysis using the EQ-5D). At €40,000 per QALY, the probability that cranberry use is cost-effective was estimated at 22%. When the VAS was used instead of the EQ-5D, more value was assigned to quality of life during the added life expectancy. As a result, the estimated probability that cranberry use is more cost-effective than placebo at a willingness to pay of €20,000 and €40,000 per QALY was 16% and 53%, respectively (Figure2).
Table 2.
Mean Lifelong Health-Economic Outcomes of Treatment with or without Cranberry, Estimated from the Health-Economic Model
| Outcome | Cranberry | Placebo | Difference | (95% Confidence Interval) |
|---|---|---|---|---|
| Low UTI risk | ||||
| Number of UTIsa,b | 2.13 | 1.84 | 0.29 | (−0.06–0.60) |
| Life expectancy, yearsa | 2.53 | 2.59 | −0.06 | (−0.14–0.05) |
| QALYs based on EQ-5Dc | 0.83 | 0.85 | −0.02 | (−0.05–0.01) |
| QALYs based on VASc | 1.69 | 1.73 | −0.04 | (−0.09–0.03) |
| Cost of cranberry use, € | 1,012 | 0 | 1,012 | (863–1,120) |
| Cost of diagnostics, € | 15 | 13 | 2 | (−1–5) |
| Cost of antibiotic treatment, € | 5 | 4 | 1 | (−1–2) |
| Cost of elderly-care physician, € | 47 | 40 | 7 | (−2–15) |
| Cost of additional nursing care, € | 228 | 196 | 32 | (−22–68) |
| Cost of hospitalizations, € | 76 | 65 | 11 | (−13–23) |
| Total UTI cost, € | 1,383 | 318 | 1,065 | (889–1,183) |
| High UTI risk | ||||
| Number of UTIa,b | 2.75 | 2.96 | −0.21 | (−0.42–0.04) |
| Life expectancy, yearsa | 2.45 | 2.40 | 0.05 | (−0.02–0.09) |
| QALYs based on EQ-5Dc | 0.81 | 0.79 | 0.02 | (−0.01–0.03) |
| QALYs based on VASc | 1.64 | 1.61 | 0.03 | (−0.01–0.06) |
| Cost of cranberry use, € | 982 | 0 | 982 | (814–1,099) |
| Cost of diagnostics, € | 20 | 22 | −2 | (−4–1) |
| Cost of antibiotic treatment, € | 7 | 8 | −1 | (−2–1) |
| Cost of elderly-care physician, € | 61 | 66 | −5 | (−10–1) |
| Cost of additional nursing care, € | 298 | 323 | −25 | (−49–13) |
| Cost of hospitalizations, € | 99 | 107 | −8 | (−17–9) |
| Total UTI cost, € | 1,467 | 526 | 941 | (779–1,055) |
Undiscounted.
Lifelong, both first and other urinary tract infections (UTIs), using the clinical definition.
Quality-adjusted life years (QALYs; life expectancy weighed by utility for quality of life).
VAS = Visual Analog Scale.
Figure 2.
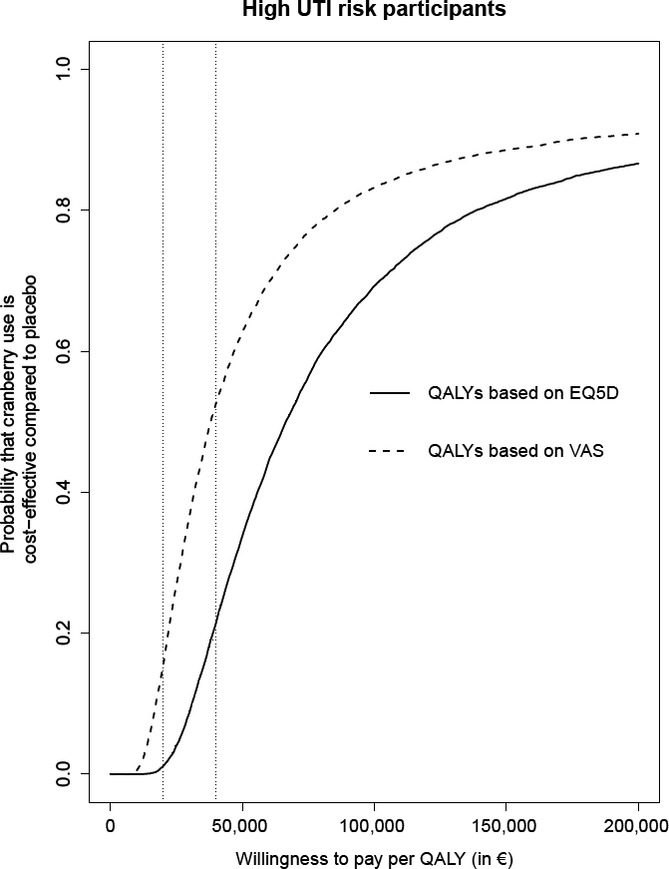
Cost-effectiveness acceptability curves, for high-urinary tract infection (UTI)-risk participants (the probability that cranberry use is more cost-effective than placebo, depending on how much one is willing to pay for a quality-adjusted life year (QALY), based on utility measured using the EQ-5D or the visual analog scale (VAS)).
The economic assessment would be more favorable to cranberry use if the costs of cranberry use were lower or the savings per prevented UTI were higher. The costs of cranberry use would need to decrease from €439 to €300 to make cranberry and placebo equally cost-effective. Similarly, the savings per prevented clinical UTI would need to increase from €196 to €1,704 to make cranberry and placebo equally cost-effective.
Low-UTI-Risk Participants
In the low-UTI-risk participants, because no effect of cranberry use on UTI infection rate was found, there was also no difference in the other health outcomes. The only difference was the estimated lifelong costs of €1,012 for cranberry use. As a result, it is highly unlikely that use of cranberry capsules is cost-effective in low-UTI-risk residents (probability <3%, regardless of willingness to pay per QALY).
Discussion
This study investigated whether the use of cranberry capsules is more cost-effective than placebo based on data from a randomized controlled trial.5 In participants with low UTI risk, the use of cranberry capsules did not prevent UTIs, and consequently, their use is not cost-effective. In high-UTI-risk participants, there were fewer clinically defined UTIs. Moreover, there was a significant, but moderate, short-term effect of those UTIs on quality of life and care dependency. Most of the QALY gain was due to the prevented UTI mortality, resulting in a gain in life expectancy of approximately 2 weeks. This relative 1.5% improvement in life expectancy is consistent with the estimated mortality attributable to UTI (7.7%) combined with the 26% treatment effect.5
Savings on prevented UTIs partly compensate for the costs of the cranberry capsules, but using a lifelong perspective, those savings added up to approximately €50. As a result, the overall cost difference is about equal to the costs of the cranberry capsules, estimated at €439 per year or at €3,800 per prevented clinically defined UTI. The health gain in terms of QALYs was small in comparison with the costs, so use of cranberry capsules was not likely to be cost-effective (22% for a WTP threshold of €40,000 per QALY).
Options to Improve Cost-Effectiveness
Cranberry use does not constitute a low-cost strategy to prevent UTIs.15 The estimated price for the capsules was lower than the price estimated previously (€0.24 vs CAN$0.73 ≈ €0.61),16 but the overall costs per capsule were somewhat similar because of the added nursing time in the current study. The previous study estimated the costs per prevented UTI at CAN$1,890, which was acknowledged as quite high.16 That study suggested that cranberry use could be cost-effective if the strength or size of the cranberry product could be reduced without reducing effectiveness. In the current study, a preventive effect was seen with the cranberry capsules after 2 months. It is unknown whether lowering the frequency after those 2 months would change not only the costs, but also the effect.
Second, the cost-effectiveness of cranberry use would also be more favorable in settings in which the savings per prevented UTI were higher. In the current study, these savings would need to be eight times as high to make cranberry and placebo equally cost-effective. This seems unrealistic for the Dutch LTCF setting, although in other healthcare systems, residents with UTIs may more frequently be referred to a hospital than the 1% in the current study population. Similarly, in noninstitutionalized vulnerable older persons, the savings associated with prevented UTIs may be higher because of the need for additional formal and informal care during and after a UTI.
Third, the high-UTI-risk criteria included diabetes mellitus, long-term catheterization, and UTI in the preceding year. Better identification of older persons at high UTI risk may also improve cost-effectiveness.
Limitations
There are several complicating factors in analyzing cost-effectiveness in vulnerable older persons in LTCFs. The first is how to value the residents’ health. According to the EQ-5D, health during the 2-week life expectancy gain was valued at approximately 40%, whereas according to the VAS, this gain would be valued at approximately 70%. In accordance with the study protocol, the EQ-5D was considered to be more appropriate than the VAS because the EQ-5D provides a societal valuation and because the descriptions it requires are less subjective than the valuations that the VAS requires.17 Consistent with the high percentage of participants with dementia (76%) and the high percentage of participants for whom family provided informed consent (84%),5 nurses mostly provided the utility measures (89%), and little is known about the validity of proxy VAS valuations in a LTCF context. Considering the often poor health of LTCF residents, the VAS valuations appear high.
Another factor is the high costs of standard LTCF care, amounting to approximately €80,000 annually in the Netherlands.9,18 Including these high costs in the analysis would make any life-prolonging treatment too expensive, even if the treatment itself was cost free. In the analysis, the 2-week life expectancy gain would add approximately €1,500 to the costs associated with cranberry use, confirming the conclusion that use of cranberry capsules is not likely to be cost-effective. Dutch guidelines for economic evaluations in health care recommend including costs associated with additional life time only if they are related to the primary intervention, which was not the case in the current analysis.
Third, it was decided beforehand that the economic state/transition model would be based on the clinical definition, because it was expected that it would be more predictive of outcome. Had the strict UTI definition been used for the model, the estimated effectiveness and cost-effectiveness would have been less favorable to the use of cranberry capsules, confirming the conclusion that use of cranberry capsules is not likely to be cost-effective.
Finally, this study was performed in Dutch LTCFs, where elderly-care physicians provide medical care.19–21 The results are not automatically generalizable to vulnerable older persons living at home. In LTCFs, medication prescription and distribution are well organized. Because the study capsules were added to the existing drug-dispensing system, participants rarely missed taking a capsule, reflected in a high adherence rate. For other settings, not only differences in vulnerability and infection rates are expected, but also in adherence. Moreover, at home, cranberry capsules can be taken without the help of nurses, which would halve the costs of cranberry use.
Conclusions
In high-UTI-risk residents, taking cranberry capsules may be effective in preventing UTIs but is not likely to be cost-effective in the investigated dosage, frequency, and setting. In low-UTI-risk LTCF residents, taking cranberry capsules twice daily is neither effective nor cost-effective.
Acknowledgments
The authors thank the organizations and members of the University Nursing Home Research Network South Holland, Parnassia, and the staff of the LTCFs participating in this study. Their ongoing collaboration enabled us to perform this study.
Conflict of Interest: All researchers worked independently from the funders. The editor in chief has reviewed the conflict of interest checklist provided by the authors and has determined that the authors have no financial or any other kind of personal conflicts with this paper.
A grant was received from ZonMw Doelmatigheid, the Dutch Organization for Health Research, the Netherlands (Project 170882501). Springfield Nutraceuticals B.V., Oud-Beijerland, the Netherlands, supplied the cranberry and placebo capsules.
Author Contributions: Dr. Jacobijn Gussekloo had full access to all of the data in the study and takes responsibility for the integrity of the data and the accuracy of the data analysis. Study concept and design: Caljouw, van den Hout, Cools, Gussekloo. Analysis and interpretation of data: van den Hout, Caljouw, Putter, Cools, Gussekloo. Drafting of the manuscript: van den Hout. Critical revision of the manuscript for important intellectual content: van den Hout, Caljouw, Putter, Cools, Gussekloo.
Sponsor's Role: All funding sources and suppliers were independent and had no influence on the study design; collection, analyses, and interpretation of data; writing of the report; or the decision to submit the manuscript for publication.
References
- 1.Nicolle LE. Urinary tract infections in the elderly. Clin Geriatr Med. 2009;25:423–436. doi: 10.1016/j.cger.2009.04.005. [DOI] [PubMed] [Google Scholar]
- 2.Foxman B. Epidemiology of urinary tract infections: Incidence, morbidity, and economic costs. Am J Med. 2002;113(Suppl 1A):5S–13S. doi: 10.1016/s0002-9343(02)01054-9. [DOI] [PubMed] [Google Scholar]
- 3.Ruben FL, Dearwater SR, Norden CW, et al. Clinical infections in the noninstitutionalized geriatric age group: Methods utilized and incidence of infections. The Pittsburgh Good Health Study. Am J Epidemiol. 1995;141:145–157. doi: 10.1093/oxfordjournals.aje.a117402. [DOI] [PubMed] [Google Scholar]
- 4.Dwyer LL, Harris-Kojetin LD, Valverde RH, et al. Infections in long-term care populations in the United States. J Am Geriatr Soc. 2013;61:341–349. doi: 10.1111/jgs.12153. [DOI] [PubMed] [Google Scholar]
- 5.Caljouw MA, van den Hout WB, Putter H, et al. Effectiveness of cranberry capsules to prevent urinary tract infections in vulnerable older persons. A double-blind randomized placebo-controlled trial in long-term care facilities. J Am Geriatr Soc. 2014:103–110. doi: 10.1111/jgs.12593. [DOI] [PMC free article] [PubMed] [Google Scholar]
- 6.Dolan P. Modeling valuations for EuroQol health states. Med Care. 1997;35:1095–1108. doi: 10.1097/00005650-199711000-00002. [DOI] [PubMed] [Google Scholar]
- 7.Lamers LM, McDonnell J, Stalmeier PF, et al. The Dutch tariff: Results and arguments for an effective design for national EQ-5D valuation studies. Health Econ. 2006;15:1121–1132. doi: 10.1002/hec.1124. [DOI] [PubMed] [Google Scholar]
- 8.Stiggelbout AM, Eijkemans MJ, Kiebert GM, et al. The ‘utility’ of the Visual Analog Scale in medical decision making and technology assessment. Is it an alternative to the time trade-off? Int J Technol Assess Health Care. 1996;12:291–298. doi: 10.1017/s0266462300009648. [DOI] [PubMed] [Google Scholar]
- 9.Hakkaart-van Rooijen L, Tan SS, Bouwmans CAM. Manual for Cost Analysis, Methods and Standard Prices for Economic Evaluations in Health Care [Dutch] Amstelveen: Dutch Health Insurance Executive Board; 2010. [Google Scholar]
- 10.Wehrens R, Putter HB, Buydens LMC. The bootstrap: A tutorial. Chemom Intell Lab Syst. 2000;54:35–52. [Google Scholar]
- 11.Dijkstra A, Tiesinga LJ, Plantinga L, et al. Diagnostic accuracy of the care dependency scale. J Adv Nurs. 2005;50:410–416. doi: 10.1111/j.1365-2648.2005.03406.x. [DOI] [PubMed] [Google Scholar]
- 12.Statistics Netherlands. Consumer Price Index [on-line]. Available at www.cbs.nl Accessed March 15, 2013.
- 13.van den Hout WB. The GAME estimate of reduced life expectancy. Med Decis Making. 2004;24:80–88. doi: 10.1177/0272989X03261564. [DOI] [PubMed] [Google Scholar]
- 14.Zethraeus N, Johannesson M, Jonsson B, et al. Advantages of using the net-benefit approach for analysing uncertainty in economic evaluation studies. Pharmacoeconomics. 2003;21:39–48. doi: 10.2165/00019053-200321010-00003. [DOI] [PubMed] [Google Scholar]
- 15.Gotteland M, Brunser O, Cruchet S. Systematic review: Are probiotics useful in controlling gastric colonization by Helicobacter pylori. Aliment Pharmacol Ther. 2006;23:1077–1086. doi: 10.1111/j.1365-2036.2006.02868.x. [DOI] [PubMed] [Google Scholar]
- 16.Stothers L. A randomized trial to evaluate effectiveness and cost effectiveness of naturopathic cranberry products as prophylaxis against urinary tract infection in women. Can J Urol. 2002;9:1558–1562. [PubMed] [Google Scholar]
- 17.Pickard AS, Johnson JA, Feeny DH, et al. Agreement between patient and proxy assessments of health-related quality of life after stroke using the EQ-5D and Health Utilities Index. Stroke. 2004;5:607–612. doi: 10.1161/01.STR.0000110984.91157.BD. [DOI] [PubMed] [Google Scholar]
- 18.Oostenbrink JB, Koopmanschap MA, Rutten FF. Standardisation of costs: The Dutch Manual for Costing in economic evaluations. Pharmacoeconomics. 2002;20:443–454. doi: 10.2165/00019053-200220070-00002. [DOI] [PubMed] [Google Scholar]
- 19.Conroy S, Van Der Cammen T, Schols J, et al. Medical services for older people in nursing homes—comparing services in England and the Netherlands. J Nutr Health Aging. 2009;13:559–563. doi: 10.1007/s12603-009-0107-9. [DOI] [PubMed] [Google Scholar]
- 20.Ribbe MW, Ljunggren G, Steel K, et al. Nursing homes in 10 nations: A comparison between countries and settings. Age Ageing. 1997;26(Suppl 2):3–12. doi: 10.1093/ageing/26.suppl_2.3. [DOI] [PubMed] [Google Scholar]
- 21. Verenso [on-line]. Available at http://www.verenso.nl/english/elderly-care-medicine/ Accessed June 15, 2012.