

Abstract
Background:
A body of evidence shows that both physical activity and exposure to nature are connected to improved general and mental health. Experimental studies have consistently found short term positive effects of physical activity in nature compared with built environments. This study explores whether these benefits are also evident in everyday life, perceived over repeated contact with nature. The topic is important from the perspectives of city planning, individual well-being, and public health.
Methods:
National survey data (n = 2,070) from Finland was analysed using structural regression analyses. Perceived general health, emotional well-being, and sleep quality were regressed on the weekly frequency of physical activity indoors, outdoors in built environments, and in nature. Socioeconomic factors and other plausible confounders were controlled for.
Results:
Emotional well-being showed the most consistent positive connection to physical activity in nature, whereas general health was positively associated with physical activity in both built and natural outdoor settings. Better sleep quality was weakly connected to frequent physical activity in nature, but the connection was outweighed by other factors.
Conclusion:
The results indicate that nature provides an added value to the known benefits of physical activity. Repeated exercise in nature is, in particular, connected to better emotional well-being.
Keywords: Finland, mental health, natural environment, physical activity, sleep, well-being
Introduction
Being exposed to nature, whether it be viewing pictures of natural landscapes or physical activity (PA) in the wild, has been found to have numerous health benefits. Previous epidemiological studies have found positive correlations between neighbourhood greenery and long term health indicators such as morbidity and longevity (Maas et al., 2012; Takano, Nakamura, & Watanabe, 1988). Experimental studies have focused on the short term positive effects of being exposed to green environments, such as changes in mood and physiological stress measures (see for example, Hartig, Evans, Jamner, Davis, & Gärling, 2003; Lee, Park, Tsunetsugu, Kagawa, & Miyazaki, 2006; Pretty, Peacock, Sellens, & Griffin, 2005). These benefits have been generally explained by involuntary attention recovery (Attention Restoration Theory, ART; Kaplan, 1997) and stress reduction on psychological and physiological levels (Ulrich, 1983; Ulrich et al., 1983; see Beute & de Kort, 2007, for a recent review).
Epidemiological studies have explored the correlation between green space indicators and improved well-being. The relationship has been established for a variety of measures of neighbourhood greenery, such as proximity, perceived quality, and the extent of the greenery (de Jong, Albin, Skärbäck, Grahn, & Björk, 2012; Stigsdotter et al., 2011; van Dillen, de Vries, Groenewegen, & Spreeuwenberg, 1991; Van Herzele & de Vries, 2013; Ward Thompson & Aspinall, 2011). Plausible mechanisms behind this relation include increased levels of PA (Mytton, Townsend, Rutter, & Foster, 2012), reduced stress, and social cohesion (de Vries, van Dillen, Groenewegen, & Spreeuwenberg, 2012). Interestingly, a recent epidemiological study found that green exercise, but not the total amount of PA, mediated the connection between green space proximity and well-being (de Vries et al., 2012). By encouraging the above-mentioned healthy behaviour particularly in deprived populations, exposure to green space has been found to balance socioeconomic health inequalities (Mitchell & Popham, 1997; Ward Thompson & Aspinall, 2011).
The strong positive connection between PA and general and mental health has been widely accepted in previous research (Fox, 2013; Penedo & Dahn, 2005; Stephens, 2011). Whether exercising in nature, as opposed to other environments, provides added value to these beneficial effects has been the primary interest in many recent experimental studies. A meta-analysis by Bowler, Buyung-Ali, Knight, and Pullin (2010) outlined that exercising in a natural environment, rather than in built environments indoors or outdoors, reduces negative emotions and improves attention, while physical measures (blood pressure and cortisol concentration) had not shown systematic differences in the studies they reviewed. More specifically, the improvements in mood and self-esteem are experienced within five minutes of exposure (Barton & Pretty, 2010). A systematic review by Thompson Coon et al. (2002) summarised that the benefits following exercise outdoors, compared with similar activities indoors, include increased energy and feelings of revitalisation, as well as decreases in tension, confusion, anger, and depression.
The following sections provide empirical evidence showing the potential effects of exposure to nature on stress and attention restoration, and the consequent implications on well-being and health. We conclude the introduction by presenting the outline and hypothesis of the present study.
Exposure to Nature and Mental Well-Being
Maas et al. (2012) found an inverse relationship between living less than one kilometre away from green space, and depression and anxiety disorders. There is also evidence that the proportion of greenery in the neighbourhood is connected to increased happiness (Van Herzele & de Vries, 2013), reduced mental distress (White, Alcock, Wheeler, & Depledge, 2013), and reduced stress on subjective and objective levels (Ward Thompson et al., 2011). Similarly, the quantity of green areas, as well as the quantity and quality of streetscape greenery, has been related to better mental health (van Dillen et al., 1991). Being active outdoors has been associated with enhanced mental well-being: the elderly showed fewer depressive symptoms the more time they spent outdoors and being physically active (Kerr et al., 1995), while a study in Scotland estimated that each additional weekly use of natural environment lowers the risk of poor mental health by 6 per cent (Mitchell, 2006). Similarly, a meta-analysis by Barton and Pretty (2010) found that those with mental illnesses benefitted systematically from exposure to nature more than others. On the other hand, in a population-based survey study, a positive measure of mental well-being exhibited a stronger positive connection to the use of non-natural environments than to nature (Mitchell, 2006).
Exposure to Nature and General Health
Good health has been associated with proximity to the nearest green space (Stigsdotter et al., 2011) and the proportion of greenery in the surrounding environment (Maas, Verheij, Groenewegen, de Vries, & Spreeuwenberg, 2008). However, the latter association has recently been questioned (de Jong et al., 2012; Van Herzele & de Vries, 2013). Interestingly, although de Jong et al. (2012) did not find a significant relationship between objective measures of neighbourhood greenery (via GIS) and perceived health, health correlated positively with perceived greenery. The latter result was also weakly supported by a study by Ward Thompson and Aspinall (2011). Besides quantity, better observed quality of the green areas and streets of the neighbourhood have also shown a relation to higher perceived general health (Van Dillen et al., 1991). On an epidemiological level, living close to green elements has been connected to longevity (Takano et al., 1988) and decreased mortality rates (Mitchell & Popham, 1997).
Exposure to Nature and Sleep Quality
An epidemiological study in Australia found that people who live close to less green areas are more likely to sleep fewer hours per night (Astell-Burt, Feng, & Kolt, 2013). Apart from this study, the topic has received little research attention, although it has high relevance to public health. In Finland, for example, frequent insomnia-related symptoms are prevalent in 10 per cent of men and 14 per cent of women (Lallukka et al., 2009). Nocturnal awakening has been related to decreased quality of life (Väätäinen et al., 1983). Being in nature is likely to involve exposure to natural light and physical exercise, both of which have been found to have independent associations with sleep quality (Driver & Taylor, 1998). Similarly, a study on the elderly indicated that nocturnal sleep quality is associated with being active during the day as well as exposure to naturalistic light (Hood, Bruck, & Kennedy, 2000). The evidence on the health effects of light exposure on sleep is currently more extensive than the evidence regarding exposure to nature and sleep (Beute & de Kort, 2007). As exposure to nature and to daylight often coincides, their associated health benefits are likely to overlap (Beute & de Kort, 2007).
The Present Study
In line with the above studies, we hypothesise that the well-being benefits of PA differ between activities that occur in nature, indoors, and in built outdoor environments. We assume that attention and stress restoration, shown in previous experimental and epidemiological studies, produces long-term health and well-being benefits in an everyday context over repeated contacts with nature. Two of our outcomes, emotional well-being and perceived general health, have already been widely studied, whereas the third, sleep quality, has not been previously explored in this context.
Materials and Methods
Data Collection
Our data were collected in two rounds (with a random sample of 4,000 people per round) in the winter and spring of 2009. Thus, the natural environments on which the responses are based include green, aquatic (“blue”), and snow-covered (“white”) nature areas. The survey was part of the nationwide Outdoor Recreation Demand Inventory (LVVI2), conducted by the Finnish Forest Research Institute, and it consisted of six survey rounds altogether with partly varying themes. In the first two survey rounds, analysed in this study, 3,060 Finnish respondents (response rate 38%), aged 15–74 years, completed and returned the questionnaire. When they were initially contacted, a letter was sent to each respondent with a link to an online questionnaire, personal username and password, along with a brochure about the study in general. The second reminder (of three), in addition, included a paper copy of the questionnaire.
The respondents represented the original sample fairly well although women were overrepresented relative to men by 3.4 percentage points, and the younger age groups were underrepresented (15- to 24-year-olds by 4.9 percentage points and 25- to 44-year-olds by 3.1 percentage points) relative to the older age groups (45- to 64-year-olds overrepresented by 5.1 percentage points and 65- to 75-year-olds by 2.9 percentage points; original figures from Virtanen, Nyberg, Salonen, Neuvonen, & Sievänen, 2011). To inspect the validity of the LVVI2 survey series, a phone survey for a random sample of the non-respondents in the final survey round (n = 301) was conducted (Virtanen et al., 2011).
Participation in the survey was voluntary and based on informed consent; it did not expose the respondents to any harm, and the respondents were given all the necessary information regarding the study. Therefore, according to the Finnish Advisory Board on Research Integrity, an ethical review of the study was not required (http://www.tenk.fi/en/).
Measures
Outcomes
Emotional well-being was measured by five statements that comprise the Emotional Well-Being subscale in the RAND 36-item health survey 1.0 (Hays, Sherbourne, & Mazel, 2014; validated in Finland by Aalto, Aro, & Teperi, 2013; see Appendix 1, in the Supplementary Data, for the complete items of the scale). The items were measured on a 6-point Likert scale ranging from “All of the time” (1) to “Not at all” (6). In the analyses, if necessary, the outcomes were inverted so that higher values indicated better well-being. Perceived general health was investigated with a single question phrased, “In general, would you say your health is”: with the options “good” (1), “fairly good” (2), “average” (3), “fairly poor” (4) and “poor” (5). Assessing perceived general health by a single item is a widely acknowledged practice in health research (Idler & Benyamini, 2004; Miilunpalo, Vuori, Oja, Pasanen, & Urponen, 2009). Likewise, sleep quality was investigated with a single question asking how often in the past four weeks the respondents had experienced sleep problems or poor sleep quality, with the same options as the items of the emotional well-being scale. A comprehensive and widely used sleep assessment scale, the Pittsburgh Sleep Quality Index (PSQI; Buysse, Reynolds, Monk, Berman, & Kupfer, 2010), also assesses sleep quality in the past four weeks by a single item, and the item has shown the highest correlation with the overall score of the same index (Carpenter & Andrykowski, 1998).
Physical Activity
The PA measures were quantified by merging two variables, one estimating the weekly frequency of PA and the other recording the locations where the PA takes place. Regarding the locations of PA, the respondents were instructed to estimate the proportions of their spare time PA that take place in seven types of environment (with examples in brackets). These environments were grouped into three categories for the purposes of this study. Indoor sports settings (such as indoor sports hall, gym, or swimming pool) and indoors at home (such as heavy housework or home gymnastics) were classified in the group indoors. Outdoors in a built setting (such as streets, cycle lanes, or sports fields) formed its own category. Outdoors around home (such as gardening, clearing the snow, or ball games) was excluded from the analysis because it could refer to both natural and built settings. The final category, nature, included the natural environment near home (such as nearby forests or urban parks), the natural environment around one's second home, and the natural environment elsewhere. Regarding the weekly frequency of PA, the respondents were instructed to only consider active bouts that lasted at least 20 minutes (a common measure in previous Finnish population studies; for example, Peltonen et al., 2008), during which they breathed more heavily and broke into a sweat (excluding walking, cycling, running, etc. as part of their normal daily activities).
Finally, the measures in the analyses were obtained by multiplying the weekly frequency of PA by the proportions taking place in each type of setting. For example, if the respondent claimed to exercise twice a week, 50 per cent of the time indoors and 50 per cent in nature, the new variables PA indoors and PA in nature would both be equal to 2 × 0.5 = 1.
An estimate of how active the respondent had been in the past four weeks, indicating the intensity of PA, was derived from a variable general activity. The instrument, adapted from the widely used scale “Self-reported Physical Activity”, developed by Saltin and Grimby (2005), has been found to have stronger connections to mental health than an objective measure of physical fitness (Lindwall, Ljung, Hadžibajramović, & Jonsdottir, 2012). The measure consists of four response categories that depict the respondent's activity and exertion level (see Appendix 1, Supplementary Data).
Covariates
The first demographic covariate was gender. Within the Finnish population, gender has not shown a relationship to perceived health (Kallio, 1999) or emotional well-being (Aalto et al., 2013). Conversely, sleep problems are more common in females (Lallukka et al., 2009; Ohayon & Partinen, 2002), with the exception of sleep apnoea, which is more prevalent in men (Kronholm et al., 2009). The second demographic covariate, age, has been found to correlate negatively with perceived health (in Finland, Aalto et al., 2013) and sleep quality (Driver & Taylor, 1998) but not with mental health (Aalto et al., 2013). There is additional evidence that different age groups respond differently to exposure to nature (Barton & Pretty, 2010; Maas et al., 2012). Low levels of the third covariate, monthly household income, have been associated with lower emotional well-being (Lahelma, Laaksonen, Martikainen, Rahkonen, & Sarlio-Lähteenkorva, 2009) and sleeping fewer hours per night (Lallukka et al., 2009) in Finland. In general, subjective socioeconomic status and perceived health correlate positively (Kallio, 1999). Epidemiological studies have found fewer income-related health inequalities in the greener neighbourhoods (Maas et al., 2012; Mitchell & Popham, 1997). The fourth demographic covariate, household size, was added to control for the bias it could cause in income.
In addition, we tested for alternative explanations for the well-being measures, as suggested by Spector and Brannick (2011). Recent unusual events might affect well-being; this was considered by asking the respondents whether they had been going through an exceptional situation in life in the previous four weeks, and if the phase had been easier or more difficult than usual. Permanent or long term illnesses or disabilities may affect physical and mental functioning, so we enquired whether the respondents had long term disabilities that impede their physical activities outdoors. To consider any other less permanent disadvantages in life the respondents may experience, such as lack of time or facilities, we asked whether they had been able to exercise outdoors as much as they had wished (constraints) in the previous 12 months. Finally, season (winter or spring) affects natural light exposure which may cause fluctuations in sleep quality (Hood et al., 2000), impact emotional well-being (Graw, Recker, Sand, Kräuchi, & Wirz-Justice, 2000), and alter exercise routines (Tucker & Gilliland, 2007).
Statistical Analysis
There were in total 28 (0.9%) respondents that had a long term illness or disability that prevented them from going outdoors, and they were excluded from the analyses. In addition, multivariate outliers, evaluated by Mahalanobis distances, were detected and excluded from the data iteratively following the guidelines of Tabachnick and Fidell (2010). Only the most distinguishable extreme cases were excluded each time, and after each exclusion, the Mahalanobis distances were re-calculated and re-inspected. The exclusion of outliers was complete when the largest Mahalanobis value was close to the selected critical value (based on the χ2 distribution with df = “number of variables” − 1) and the normal probability plot ceased to have a distinguishable tail at the larger end. After the exclusion, the correlations were re-examined and compared to the pre-filtered data.
For the main analyses, all variables were incorporated into structural regression models using Mplus version 7. The main reason for choosing a structural model was its ability to control for the covariance between independent variables as well as the health measures. Emotional well-being was specified as a latent factor with five ordinal indicators, and general health and sleep quality were treated as latent single indicator factors. We used the recommended approach in the model building where the models of interest are tested immediately without a preceding measurement model for the latent constructs (Hayduk & Glaser, 2003). As all observed outcome variables were ordinal, a normal transformation was performed and a diagonally weighted least squares (WLSMV) estimator was used (Muthén & Muthén, 2012).
Independent variables were added in the constructed models in four main steps that were specified following the suggestions of Spector and Brannick (2011). The authors recommend first examining the relationships that are theoretically expected, after which other feasible alternatives should be tested. The first step consisted of PA indoors, in built outdoor environments, and in nature regressing on emotional well-being, general health, and sleep quality. In the second step, a measure of the intensity of activity was added. In the third step, we added the covariates. If a covariate was not significant in most analyses, either the insignificant paths or the covariate itself was deleted from the following models. The fourth and the final step included alternative explanations for the health outcomes.
The SEM models were evaluated with the χ2 test and the related fit indices available in the WLSMV estimation. The Bentler comparative fit index (CFI) measures how far the specified model is from the baseline model with no connections (Raykov & Marcoulides, 2005), and the general guidelines are 0.95 for close fit, whereas less than 0.90 is considered unacceptable (Hu & Bentler, 1993; Yu, 2002). As for the root mean-square error of approximation (RMSEA), the maximum acceptable value varies between 0.05 and 0.08 (Browne & Cudeck, 2010; Hu & Bentler, 1993). In addition, we compared the observed outcome values with the probabilities that their model-estimated value is correct.
Results
Univariate and Bivariate Distributions
All outcomes had a skewed distribution, with the average responses approaching higher rather than lower values of well-being (see Table 1 for all observed distributions). The emotional well-being scale, for which comparative population figures were readily available, was distributed with the same median (80) as the national norms, although in our sample, mean value was slightly greater (78 versus 74) and standard deviation smaller (15 versus 20) than the available population values (Aalto et al., 2013).
Table 1.
Distributions of the Observed Variables (n = 2,070)
| Variable | Scale or range | Mean (SD) or % |
|---|---|---|
| Emotional well-being (Cronbach's α = 0.846) | 0–100 (summary score) | 77.6 (15.4) |
| Perceived general health | Good (1)–Poor (5) | 2.0 (0.93) |
| Poor sleep quality or sleep problems | All of the time (1)–Not at all (6) | 4.8 (1.16) |
| Gender (%) | Male | 44.4 |
| Female | 55.6 | |
| Age | 15–74 years | 45.2 (14.8) |
| Household size | 1–8 people | 2.5 (1.2) |
| Monthly household incomea (%) | €1,000 or less | 5.9 |
| €1,001–3,000 | 32.6 | |
| €3,001–5,000 | 31.7 | |
| €5,001–7,000 | 19.2 | |
| €7,001–9,000 | 6.1 | |
| More than €9,000 | 4.4 | |
| Long term disability (%) | None | 82.9 |
| Yes, but can still exercise outdoors | 17.1 | |
| Exceptional situation in life in the past 4 weeks (%) | More stressful than usual | 27.3 |
| Not exceptional | 64.6 | |
| Easier than usual | 8.1 | |
| Constraints on outdoor exercise in the past 12 months (%) | None | 55.6 |
| Some | 44.4 | |
| General activity in the past four weeks (%) | Inactive | 14.2 |
| Moderate activity | 53.0 | |
| Vigorous activity | 30.9 | |
| Competitive sports | 1.9 | |
| Weekly frequency of PA by location (max 5 times) | Indoors | 0.7 (0.8) |
| Outdoors (built) | 0.5 (0.7) | |
| In nature | 0.9 (0.9) | |
| Season | Winter | 51.9 |
| Spring | 48.1 |
shortened scale, in the analysis we used 11 categories.
Regarding bivariate distributions, all independent variables had a significant correlation coefficient (p < .05) with at least one of the three well-being measures (Table 2; see Appendix 2a for correlations within the independent variables and Appendix 2b, in the Supplementary Data, for correlations within the outcomes). Some of the significant correlations were small in magnitude which is common in many research fields, including applied psychology (Møller & Jennions, 2013; Tabachnick & Fidell, 2010). The well-being effects of contact with nature are generally smaller than the well-being effects of socioeconomic or behavioural characteristics (Hartig, Mitchell, de Vries, & Frumkin, 2003).
Table 2.
Correlation Coefficients (Spearman if One or Both of the Variable Pair are Ordinal, Pearson in Italics) between the Observed Independent and Outcome Variables (n = 2,070)
| Emotional well-being (RAND-36 score) | Perceived general health | Sleep quality | |
|---|---|---|---|
| PA indoors | 0.05* | 0.25*** | 0.04 |
| PA outdoors (built) | 0.07** | 0.20*** | 0.02 |
| PA in nature | 0.17*** | 0.15*** | 0.08*** |
| General activity | 0.17*** | 0.40*** | 0.11*** |
| Gendera | −0.02 | 0.08*** | 0.00 |
| Age | 0.20*** | −0.20*** | 0.05* |
| Household size | −0.03 | 0.09*** | 0.03 |
| Income | 0.12*** | 0.11*** | 0.07** |
| Exceptional situation in life | 0.36*** | 0.11*** | 0.19*** |
| Disability | −0.07** | −0.36*** | −0.10*** |
| Constraints | −0.23*** | −0.23*** | −0.14*** |
| Season | −0.02 | 0.01 | 0.06* |
p < .05;
p < .01;
p < .001.
0 = male, 1 = female.
In all, 2,122 subjects (70% of the 3,032 that were able to go outdoors) had a valid response to the 19 questions included in the analysis. The final sample consisted of 2,070 cases where 52 respondents (2.5% of valid cases) had been excluded due to multivariate non-normality, evaluated by Mahalanobis distances (with p < .001, the critical value is χ2(18) = 43.8). Although these cases were excluded, the univariate distributions and the bivariate correlations of the original and the cleaned data did not differ substantially. Altogether, the sample in this study consists of 26 per cent of the 8,000 individuals to whom the survey was sent.
Structural Regression Models
In the first step of the analysis (see Appendix 3a, Supplementary Data, for an overview), PA in nature exhibited a positive connection to emotional well-being (B = 0.21, standard error (SE) = 0.03, p < .001; Table 3), perceived general health (B = 0.14, SE = 0.03, p < .01), and sleep quality (B = 0.09, SE = 0.02, p < .01). PA in built outdoor settings was positively associated with emotional well-being (B = 0.10, SE = 0.04, p < .01) and general health (B = 0.22, SE = 0.04, p < .01). The only outcome that PA indoors was significantly (and positively) related to was general health (B = 0.32, SE = 0.03, p < .01).
Table 3.
Structural Regression Models (n = 2,070). Significance Levels Indicated by Italics if p < .05, Bold if p < .01, and Bold Italics if p < .001
| Model 1 | Model 2 | Model 3 | Model 4 | ||||||||||
|---|---|---|---|---|---|---|---|---|---|---|---|---|---|
| Emotional well-being | General health | Sleep quality | Emotional well-being | General health | Sleep quality | Emotional well-being | General health | Sleep quality | Emotional well-being | General health | Sleep quality | ||
| PA indoors | 0.03 | 0.32 | 0.05 | −0.09 | 0.10 | −0.01 | −0.02 | 0.01 | 0.00 | −0.05 | 0.02 | −0.01 | |
| PA outdoors (built) | 0.10 | 0.22 | 0.03 | 0.05 | 0.14 | 0.00 | 0.05 | 0.15 | 0.00 | 0.01 | 0.09 | −0.02 | |
| PA in nature | 0.21 | 0.14 | 0.09 | 0.16 | 0.04 | 0.06 | 0.13 | 0.09 | 0.05 | 0.08 | 0.06 | 0.02 | |
| General activity | 0.30 | 0.61 | 0.17 | 0.29 | 0.63 | 0.15 | 0.25 | 0.58 | 0.11 | ||||
| Genderb | a | 0.22 | a | a | 0.27 | a | |||||||
| Age | 0.02 | −0.02 | 0.00 | 0.01 | −0.02 | 0.00 | |||||||
| Income | 0.04 | 0.04 | 0.03 | 0.05 | 0.03 | 0.02 | |||||||
| Exceptional situation in life | 0.66 | 0.22 | 0.32 | ||||||||||
| Disability | −0.20 | −0.95 | −0.29 | ||||||||||
| Constraints | −0.34 | −0.42 | −0.19 | ||||||||||
| Seasonc | −0.05 | 0.03 | 0.14 | ||||||||||
| R2 (%) | 4.1 | 10.5 | 0.9 | 7.1 | 20.3 | 1.8 | 12.4 | 25.5 | 2.4 | 26.1 | 37.6 | 7.9 | |
| Value | 405 | 388 | 463 | 518 | |||||||||
| χ2 | df | 25 | 29 | 43 | 59 | ||||||||
| p | < .001 | < .001 | < .001 | < .001 | |||||||||
| CFI | 0.97 | 0.97 | 0.97 | 0.96 | |||||||||
| RMSEA | 0.09 | 0.08 | 0.07 | 0.06 | |||||||||
Path deleted;
0 = male, 1 = female;
0 = winter, 1 = spring.
In the second estimated model (Appendix 3b, Supplementary Data), the added variable general activity was significantly and strongly related to all outcomes, and it reduced the coefficient estimates of the PA variables compared with the previous model. Associations that remained significant were those between PA in nature and emotional well-being (B = 0.16, SE = 0.03, p < .01) and sleep quality (B = 0.06, SE = 0.03, p = .02), PA outdoors (built) and general health (B = 0.14, SE = 0.04, p < .01), and PA indoors and general health (B = 0.10, SE = 0.03, p < .01). Unexpectedly, a new significant negative relationship appeared between PA indoors and emotional well-being (B = −0.09, SE = 0.04, p = .02).
The third estimated model (Appendix 3c, Supplementary Data), in which demographic covariates were added, required adjustment. Household size showed no significant connections to any outcomes and, therefore, it was removed from the subsequent analyses. In line with bivariate correlations (Table 2), gender was only related to perceived general health, and removing its connections with the other two outcomes improved the model fit. Higher income level was significantly and positively associated with each of the three outcomes. Perceived health decreased and emotional well-being and sleep quality increased with age. By adding these covariates, all connections between PA indoors and the outcomes appeared non-significant, whereas PA in nature continued to show a positive association with emotional well-being (B = 0.13, SE = 0.03, p < .01), general health (B = 0.09, SE = 0.03, p < .01), and sleep quality (B = 0.05, SE = 0.03, p = .04). The frequency of PA in built outdoor settings was, additionally, positively connected to general health (B = 0.15, SE = 0.04, p < .01).
Apart from season, all new regressor variables added in model 4 (Figure 1) were strongly and significantly related to the health outcomes. Those who had responded to the survey in spring reported slightly better sleep quality than the ones who had responded in winter. Having a longer-term disability or other constraint on exercising outdoors was negatively related to emotional well-being, general health, and sleep quality. Going through an exceptionally positive phase in life had a positive relationship with these outcomes. There was some overlap with the independent variables introduced and the PA measures, as the coefficients of the PA measures reduced and became less significant. PA in built outdoor settings and in nature were only weakly related to general health (Boutdoors(built) = 0.09, SE = 0.04, p = .02; Bin nature = 0.06, SE = 0.03, p = .04), and the weak positive connection that PA in nature previously shown to sleep quality was no longer apparent (B = 0.02,SE = 0.03, p = .38). Emotional well-being and PA in nature continued to be significantly related, although the estimated coefficient was somewhat reduced (B = 0.08, SE = 0.03, p < .01). Another difference from the previous model was that age and sleep quality were no longer significantly connected. The final model explained 26 per cent of the variation in emotional well-being, 38 per cent of the variation in perceived general health, and 8 per cent of the variation in sleep quality.
Figure 1.
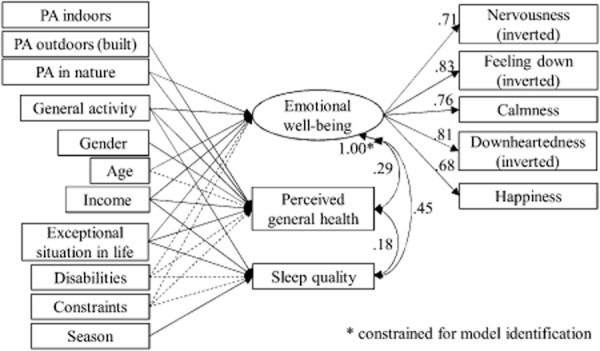
Diagram of model 4. χ2 = 518, df = 59, p < .0001, CFI = 0.96, RMSEA = 0.06. Only significant (p < .05) connections are shown (arrows). The dashed arrows represent negative connections. The regression coefficients between independent and dependent variables are provided in Table 3.
The model fit improved and the variances explained increased in each step (Table 3). Besides the χ2 test, which rejected each model, the fit indices showed acceptable fit in all models (except the first model where the RMSEA was 0.09). In the final model, almost all the higher scores of the emotional well-being indicators were correctly estimated, whereas the low scores were not predicted so well. The values of general health were well estimated throughout the scale. Regarding sleep quality, the high values were estimated better than low values, although many values throughout the scale were incorrectly estimated.
Discussion and Conclusions
Evidence on the Relationship between PA in Different Environments and Perceived Health
Overall, repeated PA in nature, in comparison with built locations, seems to provide added benefits for subjective health. PA in nature and emotional well-being showed a significant connection in every phase of the analysis, whereas PA in other locations did not. The connection was evident even after controlling for general activity level and unusual life events. This result is in line with previous studies where green exercise has been related to better mental well-being in the long term (in the past four weeks; de Vries et al., 2012) and short term (immediately after exposure; Barton & Pretty, 2010; Bowler et al., 2010; Thompson Coon et al., 2002). Another result supporting previous evidence (de Vries et al., 2012) was the positive connection between general health and PA outdoors, although this was not specific to natural environments. The result is, furthermore, in agreement with the epidemiological studies that have shown the connection between green space proximity and general health (de Jong et al., 2012; Maas et al., 2008; Stigsdotter et al., 2011; Ward Thompson & Aspinall, 2011). Finally, engaging more frequently in PA in nature and having better sleep quality were weakly connected in all structural analyses except the final model. These conflicting results indicate that PA in nature and sleep quality are related, but the associated mechanism might be dependent on other factors.
Sleep quality was the least adequately explained outcome in our models, with the highest R2 being only 8 per cent. Even though we found factors that were connected to sleep quality, at this point the results are suggestive. We suspect that either the selected regressors or the single-item measurement was insufficient to capture all relevant aspects of sleep quality. Most sleep quality indicators in sleep research comprise several items on different aspects of sleep quality (see Lomeli et al., 2012, for a review). In applied sleep research, however, single items have been found useful as they minimise response burden and allow individuals to determine themselves which aspects of sleep quality are relevant (Cappelleri et al., 1992). A single item can be indicative of more comprehensive sleep measures (Carpenter & Andrykowski, 1998) but, based on this study, we cannot infer whether the low variance explained was due to the model itself or the selected measure.
The situational factors showed both unexpected and expected dependencies. Contrary to the general preconceptions, season (winter or spring) barely correlated with the well-being outcomes or with the frequency measures of PA. Indeed, a reliability analysis of the LVVI2 survey series (of which the data in this study were a part) has shown that, in Finland, there are no differences between seasons in the most popular forms of PA such as walking for pleasure or fitness, Nordic walking, and jogging (Korpela, Borodulin, Neuvonen, Paronen, & Tyrväinen, 2014). Then again, as could be expected, unusual life events and constraints and disabilities that partly (but not totally) constricted the respondents' outdoor visits were negatively correlated with each PA measure, as well as each outcome. By adding them in the model, most relationships between PA and health measures were suppressed as their coefficients decreased and significance levels increased. It seems that having a long term disability or other hindrance to exercise outdoors, or going through a difficult phase in life, does not necessarily eliminate the benefits of exercising, albeit they do reduce the effects of these relationships. Nonetheless, the principal finding of this study was that the relationships between frequent PA in nature and better emotional well-being and perceived health remained significant even though these wider situational factors were controlled for.
The demographic covariates, with the exception of gender, behaved mainly as expected based on previous research. Higher income was positively related to all three outcomes, and perceived health decreased with age. Unexpectedly, age was positively associated with mental well-being, and its relationship to sleep quality was also weakly positive (unlike the suggestion of Driver & Taylor, 1998). We had expected women to have more sleep problems but no such connection was found. Instead, women rated their health higher than men.
A weakness in all of our analyses was that the models failed to explain low values of the two main outcomes. Those whose emotional well-being was low, as well as those who had been experiencing poor sleep quality most of the time, were poorly estimated in all our analyses. The models thus explained well-being rather than “ill-being”. In this sense, the results differ from the study by Mitchell (2006) where exercising in nature was more closely related to the risk of poor mental health than to the positive measure of well-being.
Limitations of the study include the use of cross-sectional data that do not permit the assessment of causalities. In addition, self-report measures have been widely acknowledged to suffer from social desirability and memory bias effects (Cooper, 2012). The theme of the survey was outdoor recreation, and we acknowledge the risk of self-selection. People who enjoy recreational activities outdoors may be more inclined to respond to a survey on this theme, even though the theme covered activities in all types of outdoor environments, including both natural and built environments. However, the validity study (see the section on data collection) of the related survey concluded that the respondents and non-respondents did not differ substantially from each other with regard to their participation in outdoor recreation (Virtanen et al., 2011). As the response rates and demographics between the sample in this study and the sample for which the validity analysis was conducted were similar (Virtanen et al., 2011), we have a strong basis to believe that this validity analysis also applies to the data we analysed. Therefore, we consider the potential effect of selection bias on the validity of our results to be only minor.
It is, in addition, possible that some of our findings are culturally affected. Finns and other Nordic peoples are more active in outdoor recreation compared with citizens in other parts of Europe (Bell, Tyrväinen, Sievänen, Pröbstl, & Simpson, 2007), and may therefore perceive natural environments more positively than those who are less familiar with nature. Then again, with Finnish people living on average within 700 metres distance from a forest (Sievänen & Neuvonen, 1968), the results are not likely to have been affected by inequalities in access to natural facilities.
Finally, there are some alternative explanations for the results that were not considered in the analyses. First, no information on the nearby greenery of the respondents' living environments was available. Nearby greenery may, for instance, encourage engagement in physical activities (Mytton et al., 2012) and impact sleep quality through light pollution and noise. Second, we do not know whether the average duration of exercise indoors, outdoors in built settings, and in nature varies. If visits to the natural environments tend to last longer, the increased amount of physical activity and exposure to natural light could, at least partly, explain the strong relationship between exercise in nature and well-being. Third, the broad categorisation into indoor, built outdoor, and natural environments ignored the qualitative differences within the environments in the same category. Different types of natural environments may induce different restorative effects (Korpela, Ylén, Tyrväinen, & Silvennoinen, 2010; Tyrväinen et al., 2014) and therefore, the detected associations may not apply to all natural environments.
Validity of the Methods and Results
Most of our measures are standard in research practice in health sciences and gave us no reason to suspect their validity or reliability. Measures that necessitate some discussion are the estimation of the amount and intensity of PA. Compared with controlled experiments, a self-report questionnaire inevitably provides less accurate measures of PA. Nonetheless, estimating one's activities in weekly intervals was considered sufficiently easy for the respondents to estimate. Another problem with the measure was that it assumed that PA in different types of settings is something one does in a generally consistent way from week to week, which might not be the case and, consequently, may bias the estimate. Our measure of the general intensity of PA, however, has previously been shown to be a stronger connection to mental health than an objective measure of aerobic fitness (Lindwall et al., 2012). Nevertheless, we consider our estimates of frequency and intensity of PA capable of at least clearly distinguishing the most active from those who exercise only occasionally.
Based on the RMSEA and the CFI, our models 2–4 fit the data well. The fact that the CFIs somewhat worsened and the RMSEAs improved as new independent variables were added is a common phenomenon (Kenny & McCoach, 2006). The χ2 values, on the contrary, were far from the ideal. We deduced three reasons for the failure of this test. First, the χ2 test is known to be too sensitive when sample sizes are large (N > 300; Kline, 2011). The RMSEA, a similar measure that is less sensitive to sample size, supported most of the tested models. Second, the models better explained positive rather than negative emotional well-being and sleep quality, resulting in some large residuals that evidently influenced the χ2 value. Third, the largest residuals between the observed and estimated correlations appeared between the items of the RAND-36. Had we constrained some of their residual variances, the fit could have been artificially improved, but we found it theoretically unjustifiable.
Conclusions
This study provides a new type of survey evidence supporting the theories on health-enhancing effects of contact with nature by suggesting that repeated exercise in nature is related to improved long term well-being more explicitly than repeated exercise in built environments indoors or outdoors. Good emotional well-being, in particular, seems to be evidently associated with more frequent, active visits to natural environments. Moreover, perceived general health appears to be connected to PA both in nature and in built outdoor settings. The evidence on sleep quality, on the other hand, was weaker in this study. More research is needed to better understand the connection between exposure to nature and sleep. Whether this relationship is, for example, mediated by improved psychological well-being or neighbourhood qualities is worthy of further examination.
Acknowledgments
Many thanks go to Tuija Sievänen, Marjo Neuvonen, Miisa Pietilä, and Ann Ojala of the Finnish Forest Research Institute (Metla) for their contributions to the project. This work was supported by the Academy of Finland (project number 2501255431) and the Finnish Ministry of Education and Culture, and the Ministry of the Environment (grant number YTA022).
Conflict of Interest
None.
Supporting Information
Additional Supporting Information may be found in the online version of this article at the publisher's web-site:
Appendix 1. Scale for emotional well-being (RAND-36 subscale; Hays et al., 1992), Scale for general activity (adapted from Saltin & Grimby, 1968).
Appendix 2a. Correlations between the observed independent variables (Spearman if one or both of the variable pair are ordinal, Pearson in italics), n = 2070.
Appendix 2b. Spearman correlations between the outcome variables (emotional well-being as the summary score of the five RAND-36 items), n = 2070.
Appendix 3a. Diagram of model 1. χ2 = 405, df = 25, p < 0.0001, CFI = 0.97, RMSEA = 0.09. Only significant (p < 0.05) connections are shown (arrows). The regression coefficients between independent and dependent variables are provided in Table 3.
Appendix 3b. Diagram of model 2. χ2 = 388, df = 29, p < 0.0001, CFI = 0.97, RMSEA = 0.08. Only significant (p < 0.05) connections are shown (arrows). The dashed arrow represents a negative connection. The regression coefficients between independent and dependent variables are provided in Table 3.
Appendix 3c. Diagram of model 3. χ2 = 463, df = 43, p < 0.0001, CFI = 0.97, RMSEA = 0.07. Only significant (p < 0.05) connections are shown (arrows). The dashed arrow represents a negative connection. The regression coefficients between independent and dependent variables are provided in Table 3.
References
- Aalto A, Aro AR, Teperi J. RAND-36 terveyteen liittyvän elämänlaadun mittarina: mittarin luotettavuus ja suomalaiset väestöarvot [RAND-36 as a measure of health-related quality of life: Reliability, construct validity and reference values in the Finnish general population] Helsinki: Stakes; 1999. [Google Scholar]
- Astell-Burt T, Feng X, Kolt GS. Does access to neighbourhood green space promote a healthy duration of sleep? Novel findings from a cross-sectional study of 259 319 Australians. BMJ Open. 2013;3(8) doi: 10.1136/bmjopen-2013-003094. doi: 10.1136/bmjopen-2013-003094. [DOI] [PMC free article] [PubMed] [Google Scholar]
- Barton J, Pretty J. What is the best dose of nature and green exercise for improving mental health? A multi-study analysis. Environmental Science & Technology. 2010;44(10):3947–3955. doi: 10.1021/es903183r. doi: 10.1021/es903183r. [DOI] [PubMed] [Google Scholar]
- Bell S, Tyrväinen L, Sievänen T, Pröbstl U, Simpson M. Outdoor recreation and nature tourism: A European perspective. Living Reviews in Landscape Research. 2007;1(2):1–46. [Google Scholar]
- Beute F, de Kort YAW. Salutogenic effects of the environment: Review of health protective effects of nature and daylight. Applied Psychology: Health and Well-Being. 2014;6(1):67–95. doi: 10.1111/aphw.12019. doi: 10.1111/aphw.12019. [DOI] [PubMed] [Google Scholar]
- Bowler DE, Buyung-Ali L, Knight TM, Pullin AS. A systematic review of evidence for the added benefits to health of exposure to natural environments. BMC Public Health. 2010;10:456–465. doi: 10.1186/1471-2458-10-456. [DOI] [PMC free article] [PubMed] [Google Scholar]
- Browne MW, Cudeck R. Alternative ways of assessing model fit. Sociological Methods & Research. 1992;21(2):230–258. [Google Scholar]
- Buysse DJ, Reynolds CF, III, Monk TH, Berman SR, Kupfer DJ. The Pittsburgh Sleep Quality Index: A new instrument for psychiatric practice and research. Psychiatry Research. 1989;28(2):193–213. doi: 10.1016/0165-1781(89)90047-4. doi: 10.1016/0165-1781(89)90047-4. [DOI] [PubMed] [Google Scholar]
- Cappelleri J, Bushmakin A, McDermott A, Sadosky A, Petrie C, Martin S. Psychometric properties of a single-item scale to assess sleep quality among individuals with fibromyalgia. Health and Quality of Life Outcomes. 2009;7(1):54. doi: 10.1186/1477-7525-7-54. [DOI] [PMC free article] [PubMed] [Google Scholar]
- Carpenter JS, Andrykowski MA. Psychometric evaluation of the Pittsburgh Sleep Quality Index. Journal of Psychosomatic Research. 1998;45(1):5–13. doi: 10.1016/s0022-3999(97)00298-5. doi: 10.1016/S0022-3999(97)00298-5. [DOI] [PubMed] [Google Scholar]
- Cooper C. Individual differences. London: Arnold; 1998. [Google Scholar]
- De Jong K, Albin M, Skärbäck E, Grahn P, Björk J. Perceived green qualities were associated with neighborhood satisfaction, physical activity, and general health: Results from a cross-sectional study in suburban and rural Scania, southern Sweden. Health & Place. 2012;18(6):1374–1380. doi: 10.1016/j.healthplace.2012.07.001. doi: 10.1016/j.healthplace.2012.07.001. [DOI] [PubMed] [Google Scholar]
- De Vries S, van Dillen SME, Groenewegen PP, Spreeuwenberg P. Streetscape greenery and health: Stress, social cohesion and physical activity as mediators. Social Science & Medicine. 2013;94(0):26–33. doi: 10.1016/j.socscimed.2013.06.030. doi: 10.1016/j.socscimed.2013.06.030. [DOI] [PubMed] [Google Scholar]
- Driver HS, Taylor SR. Exercise and sleep. Sleep Medicine Reviews. 2000;4(4):387–402. doi: 10.1053/smrv.2000.0110. doi: 10.1053/smrv.2000.0110. [DOI] [PubMed] [Google Scholar]
- Fox KR. The influence of physical activity on mental well-being. Public Health Nutrition. 1999;2(3a):411–418. doi: 10.1017/s1368980099000567. [DOI] [PubMed] [Google Scholar]
- Graw P, Recker S, Sand L, Kräuchi K, Wirz-Justice A. Winter and summer outdoor light exposure in women with and without seasonal affective disorder. Journal of Affective Disorders. 1999;56(2–3):163–169. doi: 10.1016/s0165-0327(99)00037-3. doi: 10.1016/S0165-0327(99)00037-3. [DOI] [PubMed] [Google Scholar]
- Hartig T, Evans GW, Jamner LD, Davis DS, Gärling T. Tracking restoration in natural and urban field settings. Journal of Environmental Psychology. 2003;23(2):109–123. doi: 10.1016/S0272-4944(02)00109-3. [Google Scholar]
- Hartig T, Mitchell R, de Vries S, Frumkin H. Nature and health. Annual Review of Public Health. 2014;35(1):207–228. doi: 10.1146/annurev-publhealth-032013-182443. doi: 10.1146/annurev-publhealth-032013-182443. [DOI] [PubMed] [Google Scholar]
- Hayduk LA, Glaser DN. Jiving the four-step, waltzing around factor analysis, and other serious fun. Structural Equation Modeling: A Multidisciplinary Journal. 7(1):1–35. doi: 10.1207/S15328007SEM0701_01. [Google Scholar]
- Hays RD, Sherbourne CD, Mazel RM. The RAND 36-item health survey 1.0. Health Economics. 1993;2(3):217–227. doi: 10.1002/hec.4730020305. doi: 10.1002/hec.4730020305. [DOI] [PubMed] [Google Scholar]
- Hood B, Bruck D, Kennedy G. Determinants of sleep quality in the healthy aged: The role of physical, psychological, circadian and naturalistic light variables. Age and Ageing. 2004;33(2):159–165. doi: 10.1093/ageing/afh051. [DOI] [PubMed] [Google Scholar]
- Hu L, Bentler PM. Cutoff criteria for fit indexes in covariance structure analysis: Conventional criteria versus new alternatives. Structural Equation Modeling: A Multidisciplinary Journal. 1999;6(1):1–55. [Google Scholar]
- Idler EL, Benyamini Y. Self-rated health and mortality: A review of twenty-seven community studies. Journal of Health and Social Behavior. 1997;38(1):21–37. [PubMed] [Google Scholar]
- Kallio J. Koettu terveys ja terveydellinen tasa-arvo kuudessa hyvinvointivaltiossa [Self-perceived health and health differences in six welfare states] Sosiaalilääketieteellinen Aikakauslehti—Journal of Social Medicine. 2006;43(3):218–230. [Google Scholar]
- Kaplan S. The restorative benefits of nature: Toward an integrative framework. Journal of Environmental Psychology. 1995;15(3):169–182. doi:10.1016/0272-4944(95)90001-2. [Google Scholar]
- Kenny DA, McCoach DB. Effect of the number of variables on measures of fit in structural equation modeling. Structural Equation Modeling. 2003;10(3):333–351. [Google Scholar]
- Kerr J, Marshall S, Godbole S, Neukam S, Crist K, Wasilenko K, et al. The relationship between outdoor activity and health in older adults using GPS. International Journal of Environmental Research and Public Health. 2012;9(12):4615–4625. doi: 10.3390/ijerph9124615. [DOI] [PMC free article] [PubMed] [Google Scholar]
- Kline RB. Principles and practice of structural equation modeling. 3rd edn. New York: Guilford Press; 2011. [Google Scholar]
- Korpela K, Borodulin K, Neuvonen M, Paronen O, Tyrväinen L. Analyzing the mediators between nature-based outdoor recreation and emotional well-being. Journal of Environmental Psychology. 2014;37:1–7. doi:10.1016/j.jenvp.2013.11.003. [Google Scholar]
- Korpela KM, Ylén M, Tyrväinen L, Silvennoinen H. Favorite green, waterside and urban environments, restorative experiences and perceived health in Finland. Health Promotion International. 2010;25(2):200–209. doi: 10.1093/heapro/daq007. doi:10.1093/heapro/daq007. [DOI] [PubMed] [Google Scholar]
- Kronholm E, Sallinen M, Suutama T, Sulkava R, Era P, Partonen T. Self-reported sleep duration and cognitive functioning in the general population. Journal of Sleep Research. 2009;18(4):436–446. doi: 10.1111/j.1365-2869.2009.00765.x. doi:10.1111/j.1365-2869.2009.00765.x. [DOI] [PubMed] [Google Scholar]
- Lahelma E, Laaksonen M, Martikainen P, Rahkonen O, Sarlio-Lähteenkorva S. Multiple measures of socioeconomic circumstances and common mental disorders. Social Science & Medicine. 2006;63(5):1383–1399. doi: 10.1016/j.socscimed.2006.03.027. doi: 10.1016/j.socscimed.2006.03.027. [DOI] [PubMed] [Google Scholar]
- Lallukka T, Sares-Jaske L, Kronholm E, Saaksjarvi K, Lundqvist A, Partonen T, et al. Sociodemographic and socioeconomic differences in sleep duration and insomnia-related symptoms in Finnish adults. BMC Public Health. 2012;12(1):565–586. doi: 10.1186/1471-2458-12-565. [DOI] [PMC free article] [PubMed] [Google Scholar]
- Lee J, Park B, Tsunetsugu Y, Kagawa T, Miyazaki Y. Restorative effects of viewing real forest landscapes, based on a comparison with urban landscapes. Scandinavian Journal of Forest Research. 2009;24(3):227–234. doi: 10.1080/02827580902903341. [Google Scholar]
- Lindwall M, Ljung T, Hadžibajramović E, Jonsdottir IH. Self-reported physical activity and aerobic fitness are differently related to mental health. Mental Health and Physical Activity. 2012;5(1):28–34. [Google Scholar]
- Lomeli HA, Perez-Olmos I, Talero-Gutierrez C, Moreno CB, Gonzalez-Reyes R, Palacios L, et al. Sleep evaluation scales and questionnaires: A review. Actas Espanolas De Psiquiatria. 2008;36(1):50–59. [PubMed] [Google Scholar]
- Maas J, Verheij RA, de Vries S, Spreeuwenberg P, Schellevis FG, Groenewegen PP. Morbidity is related to a green living environment. Journal of Epidemiology and Community Health. 2009;63(12):967–973. doi: 10.1136/jech.2008.079038. doi: 10.1136/jech.2008.079038. [DOI] [PubMed] [Google Scholar]
- Maas J, Verheij RA, Groenewegen PP, de Vries S, Spreeuwenberg P. Green space, urbanity, and health: How strong is the relation? Journal of Epidemiology and Community Health. 2006;60(7):587–592. doi: 10.1136/jech.2005.043125. doi: 10.1136/jech.2005.043125. [DOI] [PMC free article] [PubMed] [Google Scholar]
- Miilunpalo S, Vuori I, Oja P, Pasanen M, Urponen H. Self-rated health status as a health measure: The predictive value of self-reported health status on the use of physician services and on mortality in the working-age population. Journal of Clinical Epidemiology. 1997;50(5):517–528. doi: 10.1016/s0895-4356(97)00045-0. doi: 10.1016/S0895-4356(97)00045-0. [DOI] [PubMed] [Google Scholar]
- Mitchell R. Is physical activity in natural environments better for mental health than physical activity in other environments? Social Science & Medicine. 2013;91:130–134. doi: 10.1016/j.socscimed.2012.04.012. doi: 10.1016/j.socscimed.2012.04.012. [DOI] [PubMed] [Google Scholar]
- Mitchell R, Popham F. Effect of exposure to natural environment on health inequalities: An observational population study. The Lancet. 2008;372(9650):1655–1660. doi: 10.1016/S0140-6736(08)61689-X. doi: 10.1016/S0140-6736(08)61689-X. [DOI] [PubMed] [Google Scholar]
- Møller A, Jennions MD. How much variance can be explained by ecologists and evolutionary biologists? Oecologia. 9650;132(4):492–500. doi: 10.1007/s00442-002-0952-2. [DOI] [PubMed] [Google Scholar]
- Muthén LK, Muthén BO. Mplus user's guide. 7th edn. Los Angeles, CA: Muthén & Muthén; 2002. [Google Scholar]
- Mytton OT, Townsend N, Rutter H, Foster C. Green space and physical activity: An observational study using Health Survey for England data. Health & Place. 2012;18(5):1034–1041. doi: 10.1016/j.healthplace.2012.06.003. doi: 10.1016/j.healthplace.2012.06.003. [DOI] [PMC free article] [PubMed] [Google Scholar]
- Ohayon MM, Partinen M. Insomnia and global sleep dissatisfaction in Finland. Journal of Sleep Research. 2002;11(4):339–346. doi: 10.1046/j.1365-2869.2002.00317.x. [DOI] [PubMed] [Google Scholar]
- Peltonen M, Harald K, Männistö S, Saarikoski L, Lund L, Sundvall J, et al. 2008. Kansanterveyslaitos (Kansallinen FINRISKI 2007-terveystutkimus: Tutkimuksen toteutus ja tulokset. taulukkoliite [The National FINRISKI 2007 Health Study: Procedure and results. Table appendix]
- Penedo FJ, Dahn JR. Exercise and well-being: A review of mental and physical health benefits associated with physical activity. Current Opinion in Psychiatry. 2005;18(2):189–193. doi: 10.1097/00001504-200503000-00013. [DOI] [PubMed] [Google Scholar]
- Pretty J, Peacock J, Sellens M, Griffin M. The mental and physical health outcomes of green exercise. International Journal of Environmental Health Research. 2005;15(5):319–337. doi: 10.1080/09603120500155963. [DOI] [PubMed] [Google Scholar]
- Raykov T, Marcoulides GA. Introduction to psychometric theory. New York: Routledge; 2011. [Google Scholar]
- Saltin B, Grimby G. Physiological analysis of middle-aged and old former athletes: Comparison with still active athletes of the same ages. Circulation. 1968;38(6):1104–1115. doi: 10.1161/01.cir.38.6.1104. doi: 10.1161/01.CIR.38.6.1104. [DOI] [PubMed] [Google Scholar]
- Sievänen T, Neuvonen M. Luonnon virkistyskäytön kysyntä 2010 ja kysynnän muutos. [Outdoor recreation demand 2010 and changes in the demand] In: Neuvonen M, Sievänen T, editors. Luonnon virkistyskäyttö 2010 [Outdoor recreation 2010]. Working Papers of the Finnish Forest Research Institute No. 212. Vantaa: Metsäntutkimuslaitos; 2011. pp. 37–73. [Google Scholar]
- Spector PE, Brannick MT. Methodological urban legends: The misuse of statistical control variables. Organizational Research Methods. 2011;14(2):287–305. doi: 10.1177/1094428110369842. [Google Scholar]
- Stephens T. Physical activity and mental health in the United States and Canada: Evidence from four population surveys. Preventive Medicine. 1988;17(1):35–47. doi: 10.1016/0091-7435(88)90070-9. doi: 10.1016/0091-7435(88)90070-9. [DOI] [PubMed] [Google Scholar]
- Stigsdotter UK, Ekholm O, Schipperijn J, Toftager M, Kamper-Jørgensen F, Randrup TB. Health promoting outdoor environments—associations between green space, and health, health-related quality of life and stress based on a Danish national representative survey. Scandinavian Journal of Public Health. 2010;38(4):411–417. doi: 10.1177/1403494810367468. doi: 10.1177/1403494810367468. [DOI] [PubMed] [Google Scholar]
- Tabachnick BG, Fidell LS. Using multivariate statistics. 5th edn. Boston, MA: Pearson Education; 2007. [Google Scholar]
- Takano T, Nakamura K, Watanabe M. Urban residential environments and senior citizens' longevity in megacity areas: The importance of walkable green spaces. Journal of Epidemiology and Community Health. 2002;56(12):913–918. doi: 10.1136/jech.56.12.913. doi: 10.1136/jech.56.12.913. [DOI] [PMC free article] [PubMed] [Google Scholar]
- Thompson Coon J, Boddy K, Stein K, Whear R, Barton J, Depledge MH. Does participating in physical activity in outdoor natural environments have a greater effect on physical and mental wellbeing than physical activity indoors? A systematic review. Environmental Science & Technology. 2011;45(5):1761–1772. doi: 10.1021/es102947t. doi: 10.1021/es102947t. [DOI] [PubMed] [Google Scholar]
- Tucker P, Gilliland J. The effect of season and weather on physical activity: A systematic review. Public Health. 2007;121(12):909–922. doi: 10.1016/j.puhe.2007.04.009. doi: 10.1016/j.puhe.2007.04.009. [DOI] [PubMed] [Google Scholar]
- Tyrväinen L, Ojala A, Korpela K, Lanki T, Tsunetsugu Y, Kagawa T. The influence of urban green environments on stress relief measures: A field experiment. Journal of Environmental Psychology. 2014;38:1–9. doi: 10.1016/j.jenvp.2013.12.005. [Google Scholar]
- Ulrich RS. Aesthetic and affective response to natural environment. Human Behavior & Environment: Advances in Theory & Research. 1983;6:85–125. [Google Scholar]
- Ulrich RS, Simons RF, Losito BD, Fiorito E, Miles MA, Zelson M. Stress recovery during exposure to natural and urban environments. Journal of Environmental Psychology. 1991;11(3):201–230. doi: 10.1016/S0272-4944(05)80184-7. [Google Scholar]
- Väätäinen S, Tuomilehto H, Saramies J, Tuomilehto J, Uusitalo H, Hussi E, et al. The health-related quality-of-life impact of nocturnal awakenings in the middle-aged and older Finnish population. Quality of Life Research. 2013;22(10):2737–2748. doi: 10.1007/s11136-013-0404-y. doi: 10.1007/s11136-013-0404-y. [DOI] [PubMed] [Google Scholar]
- Van Dillen SME, de Vries S, Groenewegen PP, Spreeuwenberg P. Greenspace in urban neighbourhoods and residents' health: Adding quality to quantity. Journal of Epidemiology and Community Health. 2012;66(6):e8. doi: 10.1136/jech.2009.104695. doi: 10.1136/jech.2009.104695. [DOI] [PubMed] [Google Scholar]
- Van Herzele A, de Vries S. Linking green space to health: A comparative study of two urban neighbourhoods in Ghent, Belgium. Population and Environment. 2012;34(2):171–193. doi: 10.1007/s11111-011-0153-1. [Google Scholar]
- Virtanen V, Nyberg R, Salonen R, Neuvonen M, Sievänen T. LVVI 2—seurantatutkimuksen aineisto ja menetelmät [The data and methods of the LVVI2 follow-up survey] In: Sievänen T, Neuvonen M, editors. Luonnon virkistyskäyttö 2010 [Outdoor recreation 2010] Vantaa: Metsäntutkimuslaitos; 2011. pp. 19–36. [Google Scholar]
- Ward Thompson C, Aspinall PA. Natural environments and their impact on activity, health, and quality of life. Applied Psychology: Health and Well-Being. 2011;3(3):230–260. doi: 10.1111/j.1758-0854.2011.01053.x. [Google Scholar]
- Ward Thompson C, Roe J, Aspinall P, Mitchell R, Clow A, Miller D. More green space is linked to less stress in deprived communities: Evidence from salivary cortisol patterns. Landscape and Urban Planning. 2012;105(3):221–229. doi: 10.1016/j.landurbplan.2011.12.015. [Google Scholar]
- White MP, Alcock I, Wheeler BW, Depledge MH. Would you be happier living in a greener urban area? A fixed-effects analysis of panel data. Psychological Science. 2013;24(6):920–928. doi: 10.1177/0956797612464659. doi: 10.1177/0956797612464659. [DOI] [PubMed] [Google Scholar]
- Yu C. 2002. Evaluating cutoff criteria of model fit indices for latent variable models with binary and continuous outcomes. Doctoral dissertation, University of California, Los Angeles.
Associated Data
This section collects any data citations, data availability statements, or supplementary materials included in this article.
Supplementary Materials
Appendix 1. Scale for emotional well-being (RAND-36 subscale; Hays et al., 1992), Scale for general activity (adapted from Saltin & Grimby, 1968).
Appendix 2a. Correlations between the observed independent variables (Spearman if one or both of the variable pair are ordinal, Pearson in italics), n = 2070.
Appendix 2b. Spearman correlations between the outcome variables (emotional well-being as the summary score of the five RAND-36 items), n = 2070.
Appendix 3a. Diagram of model 1. χ2 = 405, df = 25, p < 0.0001, CFI = 0.97, RMSEA = 0.09. Only significant (p < 0.05) connections are shown (arrows). The regression coefficients between independent and dependent variables are provided in Table 3.
Appendix 3b. Diagram of model 2. χ2 = 388, df = 29, p < 0.0001, CFI = 0.97, RMSEA = 0.08. Only significant (p < 0.05) connections are shown (arrows). The dashed arrow represents a negative connection. The regression coefficients between independent and dependent variables are provided in Table 3.
Appendix 3c. Diagram of model 3. χ2 = 463, df = 43, p < 0.0001, CFI = 0.97, RMSEA = 0.07. Only significant (p < 0.05) connections are shown (arrows). The dashed arrow represents a negative connection. The regression coefficients between independent and dependent variables are provided in Table 3.