

Abstract
The authors used the Panel Study of Income Dynamics 2007 Transition to Adulthood data in combination with the 2002 Child Development Supplement to examine social class bifurcation in young adulthood. Results indicate that poor youth possibly take on adult roles “too early” at the same time that high-income youth may be supported for a long period past their 18th birthday. Although not all evidence is consistent with this bifurcated story, childhood poverty does play a key role. Young adults from poor families establish financial independence early (e.g., contributing to family bills during adolescence, considering themselves fully responsible for their finances as young adults), whereas young adults from more affluent homes are more likely to receive financial transfers from their parents (who often help them pay for college and other expenses). These findings highlight the ways in which socioeconomic inequality in childhood can differentiate youth’s experiences of adolescence and young adulthood.
Keywords: transition to adulthood, childhood poverty, financial support, family context, adolescence
The research literature on contemporary adolescence and young adulthood offers two contrasting narratives about the transition to adulthood. The dominant theme is that it takes young people longer today than in the past to “emerge” as full functioning adults (Aquilino, 2006; Arnett, 2006; Furstenberg, Kennedy, McLoyd, Rumbaut, & Settersten, 2004). Adulthood is often conceptualized as achieving economic independence from parents (through completing school and being employed), establishing an independent household, and having one’s own family through cohabitation, marriage, and/or becoming a parent (Amato & Kane, 2011; Settersten & Ray, 2010). The importance of financial and residential independence for marking adulthood has remained relatively consistent over time and across social class groups. In more recent times, fewer people define marrying or becoming a parent as a necessary requirement for achieving full adulthood (Settersten & Ray, 2010). At the same time, social class variation in the timing and ordering of marriage and childbearing is increasing (Cherlin, 2009).
Increased investment in higher education, accompanied by delayed marriage and child-bearing, combine to create an extended period in which young adults experiment with different relationships and slowly settle into adult roles. Securing “good” jobs is also difficult for young workers, particularly those who do not invest in higher education (Oppenheimer, 2003; Oppenheimer, Kalmijn, & Lew, 1997). Housing costs are high, and this raises the bar for full financial independence. This combination of factors results in longer periods of coresidence with parents, a slower transition to financial independence from parents, and later ages at which young adults have the full accoutrements of adulthood.
This “emerging adulthood” research literature suggests that the majority of youth benefit from large parental investments during this elongated transition to adulthood. Yet there is significant variation by social class, with a discernible subgroup of adolescents and young adults who may lack the resources or have parents who lack the resources to support an elongated transition to adulthood. These youth feel great pressure to assist poor or poorly functioning families. In essence, they often take on adult roles, such as parenthood, too early; and this may impede investments in their own successful transitions to financially independent adults. This second narrative is much less recognized in contemporary notions of adolescence and young adulthood but is increasingly important during times of economic recession.
The description of adolescence and young adulthood found in some qualitative research and in the welfare reform experimental literature is that some children may be forced into adult roles too early (Burton, 2007; Gennetian et al., 2004; Morris, Huston, Duncan, Crosby, & Bos, 2001). Burton (2007) argued that in poor families children are keenly aware of parents’ financial problems and take on some of the responsibility for managing these problems (e.g., helping parents evade debt collectors, contributing to household income). Children and adolescents do this at relatively young ages when more affluent peers are protected from such adult concerns.
Welfare-to-work demonstration programs have found harmful effects of maternal employment on adolescents’ educational attainment, with one conjecture being that older children (especially daughters) in these families must assume the burden of caregiving for younger siblings. This caregiving responsibility often interferes with schooling by increasing tardiness or absences (Gennetian et al., 2004). In extreme cases, where parents’ physical or mental health is poor or where there is alcohol or drug dependency, children may actually function as parents to their own parents who are not capable of parenting and also to younger siblings (Burton, 2007). In some cases where there are issues of violence, neglect, or severe dysfunction, adolescents may be forced to live away from their parents.
In this article, we use the sample of young adults in the Panel Study of Income Dynamics (PSID) 2007 Transition to Adulthood (TA) study matched to the 2002 Child Development Supplement (CDS-II) interviews when they were adolescents, and their prior experiences of poverty from birth to age 12 (captured in the main PSID), to examine the role of childhood poverty in youth’s experiences of “growing up too fast” versus experiencing an elongated transition to adulthood supported by parents. We consider the role of key demographic and family context characteristics in the association between childhood poverty and variation in youth’s experiences of adolescence and young adulthood. The purpose of this article is to explore these divergent paths and provide critical documentation of inequalities that have profound effects on the transition to adulthood. Young adulthood is a key stage of the life course that links childhood disadvantage to inequality in adulthood and may be amenable to policy interventions aimed at breaking the trajectories of poverty among individuals and the intergenerational transmission of poverty among families.
Background
Demographic trends for the United States support the notion of a prolonged transition to adulthood. Family transitions that are typically associated with taking on adult roles are occurring at later ages. Between 2000 and 2010, median age at first marriage increased from 26.8 to 28.2 for men and increased from 25.1 to 26.1 for women (U.S. Census Bureau, 2010). Furstenberg (2010) showed (a) a decline in marriage among those age 18 to 34, with evidence of a dramatic decline among those in the early adult (18–24) years from just over 40% married in 1950 to fewer than 20% married in 2007, and (b) a decline in the proportion of (ever married) women age 15 to 34 with at least one child, with divergent patterns of first birth timing by socioeconomic status and a greater postponement of parenthood among young adults from better-off families.
Concurrent with these trends, there has been an increase in college attendance. Between 1990 and 2009, the percentage of high school graduates enrolled in college increased from 60% to 70% (U.S. Census Bureau, 2012). For those who do not complete college, Settersten and Ray (2010) illustrated the widely acknowledged decline in earnings for men over this time period, whereas women’s earnings have increased across the educational spectrum. Young adult children have increasingly delayed leaving their parents’ households until they have stable employment (Furstenberg et al., 2004) and stable employment has been in short supply for the young, especially for those with only a high school education or less (Oppenheimer et al., 1997). For many Americans, the transition to adulthood has become a longer, slower, and less certain process: marriage is less certain, parenthood is less compulsory, and the nature of education and work has changed.
Not surprisingly, given these trends, financial transfers from parents have increased (see Furstenberg, 2010; Settersten & Ray, 2010). Schoeni and Ross (2005) estimated that the 10% rise in the likelihood of young adults (age 18–34) living with parents between 1970 and 1990 resulted in a 13% increase in the assistance young adults received from parents. On average, young adults received around $38,000 (in 2001 dollars) in total during the period when they age from 18 to 34 (Schoeni & Ross, 2005, Table 12.4). These cost estimates included in-kind transfers, such as housing and food, when parents share a residence with an adult child.
The inequality by socioeconomic status in financial assistance to young adult children is substantial (Hogan, Eggebeen, & Clogg, 1993; Schoeni & Ross, 2005). Young adults in the top quartile of the family income distribution (measured when the young adult was age 10–15) received average transfers in the amount of $71,000 (in 2001 dollars) between age 18 and 34 (Schoeni & Ross, 2005). This compares with a transfer of $23,414, on average, for young adults with family incomes in the bottom quartile; still a positive flow from parent to child, but much smaller than at the top of the income distribution. These estimates coincide with claims throughout the popular press and the academic literature that the flow of support is substantial, yet variable, from parents to young adult children.
Although there is a sizable need on the part of children for parental support extending well into adulthood, families are differentially able to provide this support. Lareau (2003) argued that affluent youth are raised with incredible amounts of parental investments of time and money (concerted cultivation) whereas parents in poor and working-class families take a less active approach to childrearing (what Lareau calls “accomplishment of natural growth”). This is mainly the result of constraints on their circumstances that impede a more engaged approach. These parents are not as involved in organizing children’s activities and are not as efficacious in dealing with institutions like schools. Indeed, their circumstances are such that low-income parents may not be as able to navigate the college application and financial aid process, or other systems that could provide critical assistance. Hence, young adult outcomes diverge in predictable ways, with those from affluent families attending college and those from less affluent backgrounds sidetracked from accomplishing this goal even when they hold it (Lareau & Cox, 2011).
Burton (2007) described what she labels as “childhood adultification” in families where parents have few resources and where children grow up early. Adolescents may carry a heavy burden of support for siblings that ultimately interferes with schooling, increases absenteeism and disciplinary actions, and enhances the likelihood of dropping out or not continuing on to higher levels of schooling (Gennetian et al., 2004). In these families, the chances are high that the young adult makes early transitions such as having a child during the teen years, and there may be pressures to flee the parental home where demands are overwhelming (Burton, 2007). Evidence on the effects of adolescent care work has been mixed, however. Some research has found that adolescents who feel an obligation to support their family members have higher levels of emotional well-being (Fuligni & Pedersen, 2002), and that these benefits derive from the sense of role fulfillment that helping one’s family provides (Telzer & Fuligni, 2009).
In sum, the research evidence suggests divergent pathways to adulthood by social class; a divergence that has critical implications for the future economic trajectories of young adults. Those who transition early lack the resources and support to invest in themselves and their careers in the ways that may better set them up for financial security; those from more affluent homes appear to benefit from prolonged support and investment by their parents. In this study we set out to explore both pathways simultaneously using nationally representative data that allowed for consideration of social class variation in the adolescent and young adult years. By doing so, we make a valuable contribution to current discussions around the transition to adulthood years and emphasize that the dominant narrative of a prolonged transition is not accessible to all.
The Current Study
A rich data source for assessing some of these claims about social class variation in young adulthood is the 2007 Transition to Adulthood Supplement (TA) sample of the Panel Study of Income Dynamics (PSID), a data collection on young adults older than age 18 who were in PSID households from birth to the 2007 TA interview. These young adults were also part of the Child Development Supplement (CDS) to the PSID and were assessed twice during childhood with the second CDS interview occurring when they were adolescents. The main PSID survey includes information on family size and income, and poverty status throughout these young adults’ childhood years can be derived from this information. The TA data collection can be combined with the 2002 CDS to capture the investments made in adolescence and young adulthood by their families, as well as the support adolescents were called upon to provide to their families during adolescence. In this study, we used the TA (2007) and CDS-II (2002) data to assess socioeconomic inequality in youth’s experiences of adolescence and the transition to adulthood. We addressed two primary research questions:
In adolescence, do those who grow up in poverty (up to age 12) have more family responsibilities in their teen years than their more affluent peers? Is there an indication that they might take on adult roles “too soon”?
In young adulthood, are those who experience childhood poverty more likely to transition to adulthood roles early, perhaps prematurely, as evidenced by ending their schooling at an early age, becoming a parent, and having full responsibility for finances? Are those who grow up without experiencing poverty shielded from early adult roles and responsibilities? Do they tend to receive more support from their parents?
To address these questions, as depicted in Figure 1, we assessed variation in adolescents’ assistance to their parents and siblings, their contribution to family bills, their future educational expectations, and their worries about money and the future. In young adulthood, we assessed variation in the likelihood of early parenthood, union formation, and independent household formation; completion of high school and enrollment in higher education; expectations about their future financial security; their current financial responsibility; and their receipt of financial assistance from family. We recognized the ambiguity of “becoming an adult” in contemporary U.S. society and that each of these markers of adulthood may inhibit the occupation of other adult roles (e.g., early parenting and prolonged family investments may increase dependence on one’s own family).
Figure 1.
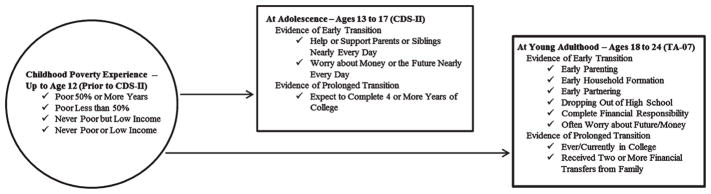
Conceptual Model of the Association Between Childhood Poverty and the Transition to Adulthood
Note: CDS = Child Development Supplement; TA = Transition to Adulthood.
Particular attention was paid to the association of growing up in poverty with these outcomes, using four mutually exclusive categories of childhood socioeconomic status between birth and age 12: (a) never lived in poverty or in a low-income household as a child (up to age 12); (b) never lived in poverty but lived in a low-income household before age 12; (c) experienced poverty during at least one, but fewer than one half of these childhood years; and (d) resided in poverty 50% or more of these childhood years. We also considered the role of other key demographic and family characteristics in explaining differences in youth’s experiences in adolescence and young adulthood.
Data and Methods
The PSID is a nationally representative panel survey of families. Begun in 1968, the study follows individuals whether they are living in the same dwelling as the original sample household or with the same people. Children who grow up and leave their parents’ household become what PSID calls “split-offs,” and these children continue to be followed and interviewed as they establish their own households. Interviews were conducted annually until 1997 when PSID moved to an every other year schedule. One drawback of the sampling design for “split-offs” was that, prior to TA, children who grew up in PSID households were not interviewed until they established residential independence from the parental household.
TA was designed to supplement the information on the activities of young adults by interviewing those who had participated in the PSID-CDS as they turned age 18, whether or not they still resided in the parental household. In the CDS, these young adults had been interviewed twice, once when they were in the age range of 0 to 12 and again in the age range of 6 to 17. The TA began in 2005 as the oldest members of the CDS cohorts turned age 18. These respondents were interviewed again in 2007 along with additional CDS respondents who had turned age 18 between 2005 and 2007.
Our sample is restricted to the 963 youth who completed CDS-II (2002) at ages 13 through 17 and who completed TA 2007. Additional cases were excluded that were missing on the dependent variables or that were missing more than 5 years of poverty data (after any missing years were imputed as described below) resulting in a final sample size of 714. For outcome measures involving help to siblings, the sample size was further restricted to 588 youth who had at least one biological sibling living in the household at the time of CDS-II.
Dependent Variables
The PSID provides several measures of early transitions in adolescence that may capture the notion that some youth must “grow up too fast.” The measures include helping parents, supporting parents, helping siblings, and supporting siblings during adolescence. These are somewhat ambiguous indicators of “adultification” in that a certain amount of help to parents may actually teach responsibility and provide a sense of belonging or meaning for the adolescent (Fuligni & Pedersen, 2002). However, we focused on the youth who said that they help their other family members often, every day or nearly every day, which may tap taking on extensive caregiving roles. Also assessed during adolescence were worries about money and the future and contributions to family bills. Both of these tap taking on the family’s financial burden and having adult concerns early in life.
During the transition to adulthood years, early transitions were measured by early births, early union formation (marriage, cohabitation), establishing an independent household, failing to complete high school, being completely financially responsible, and often worrying about money or the future. Early parenting imposes new constraints on young adults’ time and brings new responsibilities that often expedite their assumption of adult roles. Establishing a household or forming a union also represent taking on adult roles at an age in young adulthood that is increasingly uncommon. Dropping out of high school often necessitates entering the labor force and may make it harder to make longer term human capital investments. Finally, being financially responsible all of the time and often worrying about money and the future represent taking on adult responsibilities and concerns.
The PSID also contains several measures that might reflect differences in parental investment. One potential measure of investment is instilling in children the expectation that they will complete college. The CDS-II includes a question about how far the adolescent expects to go in school. The PSID-TA includes two relevant measures that we analyzed to consider how parental investment during the young adult transition may vary by child poverty experiences: college attendance of the young adult and the receipt of financial transfers from family members. The appendix details the question wording and coding of each CDS and TA outcome measure, each of which is dichotomized (0 = no, 1 = yes).
Main Independent Variable
Proportion of childhood years spent in poverty
Grieger, Schoeni, and Danziger (2008) described several possibilities for analyzing poverty in the PSID. We used the PSID-4 thresholds (downloaded for each year from http://simba.isr.umich.edu/help/UgenVars.aspx) to compute family poverty level for each year of respondents’ lives up to age 12, the youngest age prior to the CDS-II interview with adolescents age 13 to 17. This means that all respondents have the same number of reference years for the childhood poverty calculation, and all poverty data preceded CDS measurement. Note that the thresholds for each survey year were imported for the prior calendar year, because income was reported for the prior year. For example, family income reported in 2003 (for 2002) was compared to the poverty threshold for 2002. One limitation is that whereas the poverty threshold refers to income values for a calendar year, as do income reports, the poverty threshold is based on family composition the following year. Missing cases were imputed based on values for the years before and after. Thus, if someone had a missing value at age 6, the average poverty level at age 5 and 7 was used. If one of those years was missing, we used the value for the year with valid data.
We considered the proportion of childhood years spent in poverty prior to age 12 and devised four mutually exclusive categories: No childhood years below the poverty threshold or residing in a low-income household (i.e., below twice the poverty threshold); no childhood years living in poverty, but at least one year residing in a low-income household; fewer than one half of childhood years spent poor; and one half or more of childhood spent in poverty. Forty-three percent of the sample did not reside in a poor or low-income family before age 12; almost one fourth of respondents was never poor but was in a low-income family at least one year before age 12; more than one fifth of the sample was poor for some, but fewer than 50% of their childhood years; and 13% of the sample was in a poor family for one half or more of their childhood years.
Demographic Characteristics and Family Context
All demographic and family context characteristics were measured at the time of the CDS-II. Race/ethnicity included three categories: non-Hispanic White (reference group); non-Hispanic Black; and Hispanic, Other, and multiple races. Small sample sizes prevented disaggregation of the latter category. Given that the Hispanic, Other, and multiple races category is not easily interpretable, comparisons focus on differences and similarities between White and Black respondents. Age was coded as a categorical variable for ages 13 to 14 (reference group), ages 15 to 16, and ages 17 to 18. Gender of the adolescent was measured with a dichotomous variable with male = 1 and female = 0. Family structure was coded as a categorical variable with categories including two biological or adopted parents (reference group), biological mother only, biological mother and stepfather, and “other” family structures. Birth order was coded as first-born (reference group), second-born, or third-born or higher. Number of biological siblings living in the household is a continuous variable ranging from 1 to 8. An indicator is included for urban residence. Region of residence was measured with categories for Northeast (reference group), North Central, South, and West. Table 1 provides the weighted percentages (or means) of the demographic and family context variables used in the regressions for the full sample and by poverty categories.
Table 1.
Weighted Percentages (or Means) of Demographic and Family Context Characteristics at CDS 2002 by Proportion of Childhood Years in Poverty (N = 714)
| Full sample | Never poor or low income | Never poor, low income at least once | Poor less than 50% | Poor 50% or more | |
|---|---|---|---|---|---|
| Sample size | 714 | 250 | 172 | 166 | 126 |
| Weighted percentage | 100.0% | 43.0% | 24.0% | 21.0% | 13.0% |
| Race/Ethnicity | |||||
| Non-Hispanic White | 72.5% | 90.7% | 77.4% | 57.6% | 27.4% |
| Non-Hispanic Black | 16.6% | 3.4% | 10.6% | 27.7% | 53.3% |
| Hispanic/other/multiple races | 10.9% | 5.9% | 11.9% | 14.7% | 19.3% |
| Age at CDS | |||||
| 13–14 | 30.1% | 30.3% | 29.6% | 33.1% | 25.7% |
| 15–16 | 38.1% | 36.0% | 42.0% | 35.9% | 41.4% |
| 17–18 | 31.8% | 33.7% | 28.4% | 31.0% | 32.9% |
| Male | 47.0% | 46.9% | 42.4% | 45.9% | 57.2% |
| Family structure | |||||
| Two biological/adoptive parents | 63.6% | 85.2% | 67.1% | 43.9% | 18.0% |
| Biological mother only | 19.9% | 8.1% | 14.1% | 29.1% | 54.7% |
| Biological mother and stepfather | 6.7% | 4.8% | 5.6% | 9.8% | 10.1% |
| Other families | 9.7% | 1.9% | 13.2% | 17.2% | 17.3% |
| Birth order | |||||
| First-born | 39.7% | 44.3% | 35.2% | 43.4% | 27.0% |
| Second-born | 35.7% | 39.7% | 36.4% | 27.1% | 35.1% |
| Third-born or higher | 24.6% | 16.0% | 28.4% | 29.5% | 37.9% |
| Number of biological siblings in household | 1.20 (.05) | 1.15 (.08) | 1.05 (.09) | 1.28 (.12) | 1.51 (.18) |
| Urban residence | 69.5% | 74.0% | 65.0% | 62.9% | 73.6% |
| Region | |||||
| Northeast | 16.9% | 15.6% | 17.9% | 20.3% | 13.6% |
| North Central | 27.6% | 29.3% | 27.3% | 27.2% | 23.3% |
| South | 34.7% | 31.3% | 35.9% | 31.5% | 49.4% |
| West | 20.8% | 23.8% | 19.0% | 21.0% | 13.7% |
CDS = Child Development Supplement.
Analysis Strategy
We begin by discussing findings from bivariate analyses presented in Table 2 and then discuss logistic regression models used to examine the associations between childhood poverty and youth’s experiences of adolescence at the time of the CDS-II and in young adulthood at the time of the TA-07. For each outcome measure, the role of childhood poverty is assessed while considering several key demographic and family context characteristics.
Table 2.
Weighted Percentages of Dependent Variables at CDS 2002 and TA 2007 by Proportion of Childhood Years in Poverty (N = 714)
| Full sample | Never poor or low income | Never poor, low income at least once | Poor less than 50% | Poor 50% or more | |
|---|---|---|---|---|---|
| Sample size | 714 | 250 | 172 | 166 | 126 |
| Weighted percentage | 100.0% | 43.0% | 24.0% | 21.0% | 13.0% |
| CDS early “adult role” measures | |||||
| Help parents nearly every day | 38.7% | 33.0% | 35.0% | 47.0%* | 49.0%† |
| Support parents nearly every day | 12.0% | 7.9% | 7.1% | 21.2%** | 19.9%* |
| Help siblings nearly every daya | 13.0% | 10.0% | 14.0% | 21.0%* | 10.0% |
| Support siblings nearly every daya | 13.0% | 10.0% | 9.0% | 22.0%* | 15.0% |
| Worry about the future/money nearly every day | 16.1% | 10.3% | 15.2% | 22.2%* | 27.5%** |
| Help pay family bills | 16.8% | 9.1% | 16.1%† | 27.5%*** | 26.1%** |
| CDS investment/college measure | |||||
| Expect a 4-year degree or higher | 63.5% | 76.8% | 66.1%† | 51.5%*** | 34.5%*** |
| TA early transitions measures | |||||
| Early parenting | 13.0% | 6.1% | 11.7%† | 19.0%** | 28.0%*** |
| Early head of own household | 20.7% | 16.1% | 19.6% | 25.9%† | 29.3%† |
| Early marriage or cohabitation | 19.4% | 15.3% | 22.6% | 25.5%† | 17.1% |
| Did not finish high school | 7.7% | 2.8% | 7.0% | 11.3%* | 19.0%*** |
| Financially responsible all the time | 35.1% | 26.2% | 34.0% | 46.4%** | 48.0%** |
| Often worry about future/money | 17.8% | 15.1% | 12.5% | 22.9% | 28.2%* |
| TA investment/college measures | |||||
| Ever/currently in college | 72.3% | 90.4% | 72.5%*** | 51.8%*** | 45.4%*** |
| Received two or more financial transfers | 45.1% | 63.0% | 45.5%** | 19.9%*** | 25.7%*** |
Note: CDS = Child Development Supplement; TA = Transition to Adulthood.
Sample sizes for sibling measures: total N = 588; never poor or low income = 203; never poor, low income = 139; poor less than 50% = 133; poor 50% or more = 113.
p < .10.
p < .05.
p < .01.
p < .001. Compared to never poor or low income.
Results
Bivariate Associations
Table 2 shows the dependent measures and indicates whether there are statistically significant differences among the poverty groups. Almost all of the indicators are highly correlated with childhood poverty status. Overall, those who grew up in poverty were more likely to experience early transitions and less likely to be supported through the transition to adulthood than those who were never poor or low income.
Youth who were poor either less than one half or one half or more of their childhood years were more likely to help and support their parents nearly every day in adolescence than those who were never poor or low income. Among those residing with siblings, those who were poor less than one half of their childhood were more than twice as likely to help and support their siblings nearly every day as those who were never poor or low income. Respondents who were poor in childhood were more than twice as likely to worry about money or the future and almost three times more likely to have helped pay family bills during their adolescence than respondents who were never poor or low income. Adolescents who were poor in childhood, especially those who spent one half or more of these years in poverty, were much less likely to expect to attain a 4-year degree (or higher).
During young adulthood, those who were poor in childhood were more likely to become a young parent than those who were never poor or low income. Youth who grew up in poverty were much less likely to have finished high school and more likely to be completely financially responsible for themselves than those who were never poor or low income. Those who were poor one half or more of their childhood were almost twice as likely to worry often about the future and money as were those who were never poor or low income. Respondents who experienced poverty or spent time in a low-income household were much less likely to be ever or currently enrolled in college or to receive at least two financial transfers from their parents or relatives in young adulthood than those who were never poor or low income.
In adolescence and in young adulthood, there were only a few statistically significant differences between those who were never poor but were low income at least one year and those who were never poor or low income. In young adulthood, those who were low income were less likely to have ever attended college and less often received financial transfers during young adulthood than those who were never poor or low income (p < .05).
Multivariate Results
The first six models of Table 3 predict the early responsibilities for family caregiving and financial support that might be required by adolescents in poor households. The last column assesses whether the adolescent expects to graduate from a 4-year college, expectations we might expect to be higher among those whose families are better positioned to offer financial support.
Table 3.
Odds Ratios of Youth’s Experiences in Adolescence at CDS 2002 by Proportion of Childhood Years in Poverty and Demographic and Family Context Characteristics (N = 714)
| Early “adult roles”
|
Investment/college
|
||||||
|---|---|---|---|---|---|---|---|
| Help parents nearly every day | Support parents nearly every day | Help siblings nearly every daya | Support siblings nearly every daya | Worry about the future/money nearly every day | Help pay family bills | Expect a 4-year degree or higher | |
| Proportion of childhood years in poverty (Never poor or low income excluded) | |||||||
| Never poor, low income at least once | 1.07 | 0.72 | 1.25 | 0.88 | 1.35 | 1.76 | 0.59† |
| Poor less than 50% | 1.73† | 2.36* | 1.39 | 1.95 | 1.80 | 2.98** | 0.36** |
| Poor 50% or more | 1.59 | 1.90 | 0.44 | 1.38 | 1.87 | 2.35 | 0.21*** |
| Race/ethnicity (Non-Hispanic White excluded) | |||||||
| Non-Hispanic Black | 1.26 | 2.12* | 2.78** | 3.08** | 2.42* | 1.44 | 0.78 |
| Hispanic/other/multiple races | 0.75 | 1.47 | 0.77 | 1.04 | 1.79 | 1.30 | 1.63 |
| Age at CDS (13–14 excluded) | |||||||
| 15–16 | 1.00 | 0.48† | 0.77 | 0.52† | 0.66 | 1.33 | 0.73 |
| 17–18 | 1.02 | 0.73 | 0.44† | 0.43† | 1.36 | 2.88** | 0.66 |
| Male | 0.95 | 0.69 | 0.85 | 0.72 | 0.37*** | 0.64† | 0.87 |
| Family structure (Two biological/adoptive parents excluded) | |||||||
| Biological mother only | 1.08 | 1.03 | 1.40 | 0.61 | 1.40 | 1.69 | 0.43** |
| Biological mother and stepfather | 0.68 | 1.06 | 1.93 | 1.44 | 2.58† | 3.14* | 0.89 |
| “Other” families | 1.07 | 1.65 | 3.02* | 2.32 | 1.51 | 1.66 | 1.15 |
| Birth order (First-born excluded) | |||||||
| Second-born | 1.15 | 1.05 | 0.59 | 0.54† | 1.65 | 1.09 | 0.80 |
| Third-born or higher | 0.88 | 0.69 | 0.73 | 0.50 | 2.12* | 1.28 | 1.20 |
| Number of biological siblings in household | 1.18 | 0.94 | 0.86 | 0.79 | 0.79 | 0.90 | 1.00 |
| Urban residence | 0.86 | 0.86 | 1.03 | 1.13 | 1.40 | 1.13 | 1.50 |
| Region (Northeast excluded) | |||||||
| North Central | 0.87 | 0.61 | 0.84 | 1.11 | 1.87 | 1.47 | 1.19 |
| South | 1.18 | 1.10 | 0.87 | 0.69 | 1.16 | 0.57 | 1.54 |
| West | 0.72 | 0.82 | 1.14 | 1.16 | 1.64 | 0.67 | 1.09 |
| Intercept | −0.71x | −1.68** | −1.42* | −1.08 | −2.71*** | −2.77*** | 1.16** |
| −2 log likelihood | 15881 | 8221 | 7323 | 7067 | 9464 | 9697 | 14384 |
Note: CDS = Child Development Supplement.
Sample sizes for sibling measures: total N = 588; never poor or low income = 203; never poor, low income = 139; poor less than 50% = 133; poor 50% or more = 113.
p< . 10.
p < .05.
p < .01.
p < .001.
The direction of the outcomes is generally in the predicted direction; that is, adolescents who spent time in a poor or low-income household during their childhood were more likely to experience early adult-like behavior (most odds ratios are above 1.0), though the associations were not always statistically significant. The exceptions (although not statistically significant) were the lower likelihood of supporting parents and siblings among those who have lived in low-income families (relative to those never poor or low income) and the lower likelihood of helping siblings among those who spent one half or more of their childhood in poverty.
Associations were most often statistically significant and strongest not for the group poor most often, but for the group who experienced poverty for less than one half of the years before age 12. Adolescents who spent some but less than one half of their childhood living in poverty were more likely to help their parents nearly every day, nearly three times as likely to help pay family bills, and more than twice as likely to support their parents nearly every day as adolescents who were never poor or low income.
There is a strong and linear relationship between childhood poverty and having college plans. The likelihood of expecting to be able to attain a 4-year college degree was low for those who ever lived in low income or poor homes before age 12: only 0.2 (or about 20% as likely) for those poor more than one half of their childhood, around 0.4 (or about 40% as likely) for those poor some of their childhood, and 0.6 (or about 60% as likely) for those who were low income relative to the likelihood of college plans for those who were never poor or low income.
We also observed variation on our CDS-II outcome transition measures by family and demographic characteristics. Net of childhood poverty, Black adolescents were more likely to support their parents, help and support their siblings, and worry about the future or money nearly every day compared to White adolescents. Black adolescents did not differ significantly from their White counterparts in their helping to pay family bills or their expectation of graduating from college.
Older adolescents were more likely to help pay family bills than younger adolescents, and boys were less likely to worry about the future or money than girls. Compared to adolescents living with both of their biological or adopted parents, adolescents living in “other” family types (e.g., biological mother not present) were more likely to help their siblings nearly every day and those living with their biological mother only were less likely to expect to graduate college. Adolescents living with their mother and a stepfather were more likely to help pay the family bills. Finally, compared with first-born siblings, those third born or higher were more likely to worry about money and the future nearly every day.
Table 4 shows the associations among childhood poverty, early family transitions, educational outcomes, financial assistance, and worry about finances in young adulthood. These outcome measures are drawn from the 2007 TA sample. The first six models predict the early transition outcomes and the last two models predict college attendance and parental financial transfers.
Table 4.
Odds Ratios of Youth’s Experiences in Young Adulthood at TA 2007 by Proportion of Childhood Years in Poverty and Demographic and Family Context Characteristics (N = 714)
| Early Transitions
|
Investment/College
|
|||||||
|---|---|---|---|---|---|---|---|---|
| Early parenting | Early head of own household | Early marriage or cohabitation | Did not finish high school | Financially responsible all the time | Often worry about future/money | Ever/currently in college | Received two or more financial transfers | |
| Proportion of childhood years in poverty (Never poor or low income excluded) | ||||||||
| Never poor, low income at least once | 1.76 | 1.16 | 1.39 | 2.16 | 1.52 | 0.79 | 0.34** | 0.49* |
| Poor less than 50% | 2.32† | 1.54 | 1.49 | 3.21† | 2.68** | 1.78 | 0.17*** | 0.16*** |
| Poor 50% or more | 3.42* | 1.58 | 0.82 | 6.70** | 2.88* | 2.06 | 0.14*** | 0.25** |
| Race/Ethnicity (Non-Hispanic White excluded) | ||||||||
| Non-Hispanic Black | 3.59*** | 1.59 | 0.82 | 0.80 | 1.35 | 1.39 | 0.49* | 0.65 |
| Hispanic/other/multiple races | 2.31† | 1.80 | 1.75 | 0.75 | 1.17 | 0.89 | 1.44 | 1.48 |
| Age at CDS (13–14 excluded) | ||||||||
| 15–16 | 3.33** | 4.16*** | 2.20* | 0.65 | 2.92*** | 0.84 | 1.55 | 0.76 |
| 17–18 | 6.67*** | 6.38*** | 3.44** | 0.92 | 5.40*** | 0.72 | 1.51 | 0.50* |
| Male | 0.21*** | 0.60† | 0.34*** | 0.74 | 1.06 | 1.05 | 0.90 | 0.93 |
| Family structure (Two biological/adoptive parents excluded) | ||||||||
| Biological mother only | 1.60 | 1.37 | 1.72 | 2.14 | 0.76 | 0.86 | 0.57† | 0.94 |
| Biological mother and stepfather | 2.61* | 2.08† | 2.67* | 2.11 | 1.21 | 0.81 | 0.46 | 0.54 |
| “Other” families | 0.85 | 1.82 | 1.07 | 3.69* | 1.41 | 0.60 | 0.37* | 0.85 |
| Birth order (First-born excluded) | ||||||||
| Second-born | 0.85 | 1.36 | 1.25 | 1.47 | 0.79 | 1.35 | 0.66 | 1.24 |
| Third-born or higher | 0.68 | 0.87 | 1.75 | 0.97 | 0.66 | 1.50 | 0.71 | 0.94 |
| Number of biological siblings in household | 0.84 | 0.70* | 0.89 | 0.85 | 0.83 | 0.89 | 1.14 | 0.89 |
| Urban residence | 0.71 | 1.23 | 0.61† | 0.86 | 0.87 | 1.25 | 1.70† | 1.64* |
| Region (Northeast excluded) | ||||||||
| North Central | 2.14* | 1.16 | 2.42† | 1.00 | 1.53 | 1.49 | 1.10 | 0.61 |
| South | 1.15 | 0.98 | 1.64 | 0.51 | 1.37 | 1.73 | 2.98** | 0.70 |
| West | 0.93 | 1.01 | 1.90 | 0.44 | 1.62 | 1.22 | 1.55 | 0.62 |
| Intercept | −3.46*** | −2.85*** | −2.53*** | −2.93*** | −2.01*** | −2.13*** | 1.45** | 1.03* |
| −2 log likelihood | 7318 | 10926 | 10489 | 5812 | 14227 | 11016 | 11616 | 14664 |
Note: TA = Transition to Adulthood.
p < .10.
p < .05.
p < .01.
p < .001.
Early parenting, failing to complete high school, and being financially responsible for oneself all of the time were very strongly associated with the experience of poverty during childhood. Young adults who spent more than one half their childhood in poverty were more than three times as likely to engage in early childbearing, nearly seven times as likely to have not completed high school, and more than twice as likely to be completely financially responsible for their own support as their counterparts who were never poor or low income during childhood. Early household formation, early marriage or cohabitation, and worrying about money or the future were not statistically significantly related to the experience of poverty in childhood but these associations were generally in the expected direction. Young adults who spent any childhood years in a low-income or poor family were less than one half as likely to have attended college or to have received two or more financial transfers from family members as those with no childhood experience of being in poverty or a low-income household.
The demographic and family context variables also mattered for early transitions in young adulthood. Black young adults were significantly more likely than Whites to experience early childbearing. Net of poverty, Black young adults were less likely to go to college than their White counterparts, but were not significantly less likely to have received two or more financial transfers from family in young adulthood.
Age and gender were important controls in these models, given the younger age of family transitions for women and the longer time that older respondents had to make these transitions. Older respondents were more likely to have already had a first birth, married, or formed an independent household. They also were more likely to be completely financially responsible all of the time compared to younger respondents. Older respondents were one half as likely as younger respondents to receive two or more financial transfers in young adulthood. Young men were less likely to have yet experienced family transitions than young women.
Those living with a mother and stepfather in adolescence were more likely to experience family formation events early in young adulthood. Those in “other” family forms were least likely to complete high school compared to those who lived with two biological parents as adolescents. Young adults who lived in “other” types of families were also less likely to have attended college than were those who lived with two biological parents in adolescence. Those who grew up in a household with a higher number of biological siblings were less likely to establish an independent household. Those who lived in an urban area were more likely to have received two or more financial transfers in young adulthood than those who lived in a rural area. There were also some statistically significant regional differences, with earlier first births and marriages more likely in the North Central region compared with the Northeast and with those from the South more likely to have attended college than those from the Northeast.
Discussion
We examined evidence regarding social class variation in adolescence and young adulthood, with poverty-level youth possibly taking on adult roles “too early” at the same time that high-income youth are supported well past their 18th birthday. We considered whether those growing up in poverty have more family responsibilities as adolescents than those from more affluent families and whether associations depend on the length of time in poverty. Our bivariate results largely suggest that those experiencing at least some poverty as children typically do offer more help and support to siblings and parents, more often worry about money and the future, and more often help pay their families’ bills than their more affluent peers. In multivariate models with controls for other family and demographic characteristics, childhood poverty status remains significantly associated with supporting parents daily or near daily and helping pay family bills. Interestingly, these results held most strongly not for those who spent most of their childhood in poverty but rather for those experiencing poverty during some but less than one half of their childhood years.
This finding is consistent with evidence that families just above the poverty line may struggle the most with providing adequate income and time to their children (Williams & Boushey, 2010). These families are not poor enough to qualify for means-tested public support but are also not in a position to provide the resources to their families that are taken for granted in more affluent homes. Parents in these families may also have a difficult time getting enough hours on the job to provide adequately for a family (Jacobs & Gerson, 1998), thereby necessitating the involvement of all family members, including adolescent children, in providing time and money to the family.
We were also interested in whether youth who grow up in poor or low-income homes experience less parental investments than those from more affluent homes. Our results are suggestive that this may indeed be the case. Compared to those who were never poor or low income, adolescents growing up in poverty are less likely to expect to complete at least 4 years of college, perhaps partly in recognition of the limited financial ability of their families to support higher education. This association is not explained by family context or demographic characteristics included in the multivariate models.
Our examination of whether those who experienced childhood poverty were more likely to transition to adulthood roles early suggested that those who experienced poverty as children (but not those who only lived in low income homes) were indeed more likely to transition early to adult roles. In the multivariate models, those with poverty backgrounds made earlier transitions to parenting, ended schooling early, and were more likely to have complete financial responsibility for themselves. Those who did not experience childhood in a poor or low-income household received more support from parents, perhaps allowing them to delay work and family transitions while staying in school longer. Those who experienced childhood poverty or low-income environments were much less likely to have ever attended college and less often received financial transfers from their parents. These associations held up in multivariate models that accounted for family context and demographic characteristics.
In sum, the data offer support for two pictures of adolescence and young adulthood: delayed adult roles and transitions among the financially better-off, and earlier transitions among those growing up in poverty. Poor young adults often made early family transitions (to parenthood, for example); young adults from affluent families did so much less frequently. Young adults from poor families tended to establish financial independence (e.g., paying their own rent) early whereas affluent young adults typically received large financial transfers from their parents (e.g., to pay for college and to pay their bills).
In adolescence, the poor were generally more likely to help and support their parents and siblings than the affluent, as predicted in the qualitative ethnographic work on “childhood adultification” and the welfare-to-work reform experiments. Some of these associations between childhood poverty and early adult roles are explained by other family and demographic characteristics. However, childhood poverty was directly linked to the likelihood of helping to pay family bills, and to expecting a 4-year degree or higher even after accounting for the association between family and demographic characteristics. These disparities in investments coincide with growing achievement disparities since the 1970s (see Reardon, 2011).
This study has limitations. First, we were not able to follow young adults very far into adulthood but instead focused only on the early stage of the transition to adulthood when youth were age 18 to 24. We were also limited in our assessment of the possible “adultification” of youth in poor households. Ideally, we would have had more direct measures of this. Finally, the data analyzed were from 2007, before the onset of the recent “Great Recession.” It is likely that families across the economic spectrum have been affected in myriad ways that alter the transition to adulthood. Despite these limitations, the large differences in the experiences of children who grew up in poverty versus those who did not portend continued socioeconomic inequality as these cohorts enter the labor force and raise families.
Implications
This research has important implications for policy makers and counselors, teachers, college admissions officers, and other professionals who work with adolescents and young adults. Currently, the media images of young adults are dominated by the notion of the “elongated transition” that is supported by parents. The findings from this study remind us that many young adults do not have a family safety net that can backstop them as they try to continue their education, find jobs, and support families. This disconnect between the realities of the lives of many youth and the popular image was dramatized in the 2012 U.S. Presidential campaign when the Republican candidate advised those who wanted to start a business to borrow the money from their parents. That solution will not work for the poor and may not even be sustainable for the middle class.
Young adults from poor backgrounds need training in financial literacy at an early age, because they often have to help their own parents (rather than vice versa) and because of the high likelihood that they will need to be self-supporting at an early age. If they are to stay in school and defer early parenting, they have to be able to see a path forward to postsecondary training, one that does not rely on parental financial support to which they do not have access. We need a much larger public discussion of how to equalize opportunity for youth so that they can learn a trade or go to college and gain a secure foothold in the labor force. The supposition has been that childhood dependency can be elongated and parents will pick up the slack. The erosion of parental housing wealth in the last recession portends difficulties with this model for a growing segment of the young adult population, not only those who grow up in poverty or near poverty, as we have shown in this study, but perhaps also a growing segment of the middle class. We need a sustained focus on how best to promote the human capital development of all youth, regardless of family socioeconomic background.
Appendix: Measurement of CDS and TA Outcome Measures
| Measure | Question | Coding |
|---|---|---|
| CDS Early “Adult Roles’ Measures | ||
| Help parents nearly every day | “In the last 6 months, how often have you helped your parents with things they had to get done, such as chores or running errands?” | 1 = helped parents almost every day or every day vs. 0 = almost never to a few times a week |
| Support parents nearly every day | “In the last 6 months, how often have you provided emotional support to your parents, such as making them feel better when they were sad?’ | 1 = supported parents almost every day or every day vs. 0 = almost never to a few times a week |
| Help siblings nearly every day | “In the last 6 months, how often have you helped your brothers or sisters with things they had to get done, such as homework or chores?” | 1 = helped a sibling almost every day or every day vs. 0 = almost never to a few times a week |
| Support siblings nearly every day | “In the last 6 months, how often have you provided emotional support to your brothers or sisters, such as giving them advice on a problem or making them feel better when they were sad?” | 1 = supported a sibling almost every day or every day vs. 0 = almost never to a few times a week |
| Worry about future/money nearly every day | Comprising three questions: “In the last month …, how often do you worry that you will not get a good job when you are an adult?”; “how often do you feel discouraged about the future?”; and “how often do you worry that your family will not have enough money to pay for things?” | 1 = reported almost every day or every day for one or more questions vs. 0 = worried never to two or three times a week |
| Help pay family bills | “Did you use any of your money to help pay for family bills and expenses in the last month?” | 1 = yes vs. 0 = no |
| CDS Investment/College Measure | ||
| Expect a 4-year degree or higher | “Many people do not get as much education as they would like. How far do you think you will actually go in school?” | 1 = expected to receive a 4-year college degree or a higher level of education vs. 0 = expected less than a 4-year college degree |
| TA Early Transitions Measures | ||
| Early parenting | “How old were you when you had your first child/first took on a parenting role?” | 1 = reported having had their first child or had taken on a parenting role by the time of the TA interviewa |
| Early head of own household | PSID-constructed variable | 1 = established their own independent household at the time of the TA interview (i.e., defined as a ‘head’ or ‘wife’ of a household by PSID) vs. 0 = does not have independent householdb |
| Early marriage or cohabitation | Comprising two questions: marital status question and “Are you living with a partner in a marriage-like relationship?” | 1 = reported they had ever been married or living with a partner in a marriage-like relationship vs. 0 = not married or cohabiting |
| Did not finish high school | “Did you graduate from high school, get a GED, or neither?” | 1 = reported ‘neither’ vs. 0 = graduated from high school or got a GED |
| Financially responsible all the time | PSID-constructed variable comprising an average of responses to questions concerning the amount of responsibility respondents took for earning their own living, paying their own rent, paying their own bills, and managing their own money. | Response choices range from 1 = somebody else does this for me all of the time to 5 = I am completely responsible for this all of the time. 1 = average of 5 (financially responsible all the time) vs. 0 = average below 5 |
| Often worry about future/money | Comprised of four questions: “Using any number from 1 to 7, where 1 means very unlikely and 7 means very likely, in the future, how likely is it that … you will have a job that pays well?”; “you will have difficulty supporting your family financially?”; “you will be laid off from your job?”; and “life will turn out to be harder for you than it was for your parents?” | 1 = reported scores that represented likely to very likely (or unlikely to very likely for the first question) for one or more of the four questions vs. 0 = does not often worry about future/money |
| TA Investment/College Measures | ||
| Ever/currently in college | Comprising two questions: “Are you currently attending college?” and “Have you ever attended college?” | 1 = reported yes to either question vs. 0 = never attended college |
| Received two or more financial transfers | Comprising questions about whether a parent or other relative did the following for the respondent: paid rent or a mortgage payment, provided a personal vehicle, paid tuition, covered bills/expenses, or gave a personal loan. | 1= responded affirmatively to two or more of the questions vs. 0 = received no tranfers or one transfer |
Note: CDS = Child Development Supplement; TA = Transition to Adulthood; PSID = Panel Study of Income Dynamics; GED = Graduate Equivalency Diploma.
Age at the CDS interview is included as a control in the models because some respondents in the TA will have had more time to become parents than others by the time of the 2007 TA. Those in the 2007 TA were age 18 to 24.
If PSID-TA respondents were living away from home to attend school, they are not considered to have established their own independent household.
Contributor Information
Sarah M. Kendig, Arkansas State University
Marybeth J. Mattingly, University of New Hampshire.
Suzanne M. Bianchi, University of California, Los Angeles.
References
- Amato PR, Kane JB. Life-course pathways and the psychosocial adjustment of young adult women. Journal of Marriage and Family. 2011;73:279–295. doi: 10.1111/j.1741-3737.2010.00804.x. [DOI] [PMC free article] [PubMed] [Google Scholar]
- Aquilino WS. Family relationships and support systems in emerging adulthood. In: Arnett JJ, Tanner JL, editors. Emerging adults in America: Coming of age in the 21st century. Washington, DC: American Psychological Association; 2006. pp. 193–217. [Google Scholar]
- Arnett JJ. Emerging adulthood: Understanding the new way of coming of age. In: Arnett JJ, Tanner JL, editors. Emerging adults in America: Coming of age in the 21st century. Washington, DC: American Psychological Association; 2006. pp. 3–19. [Google Scholar]
- Burton L. Childhood adultification in economically disadvantaged families: A conceptual model. Family Relations. 2007;56:329–345. [Google Scholar]
- Cherlin AJ. The marriage-go-round: The state of marriage and the family today. New York: Alfred A. Knopf; 2009. [Google Scholar]
- Fuligni AJ, Pedersen S. Family obligation and the transition to young adulthood. Developmental Psychology. 2002;38:856–868. doi: 10.1037//0012-1649.38.5.856. [DOI] [PubMed] [Google Scholar]
- Furstenburg FF., Jr On a new schedule: Transitions to adulthood and family change. The Future of Children. 2010;20(1):67–87. doi: 10.1353/foc.0.0038. [DOI] [PubMed] [Google Scholar]
- Furstenberg FF, Jr, Kennedy S, McLoyd VC, Rumbaut RG, Settersten RA., Jr Growing up is harder to do. Contexts. 2004;3:1–10. [Google Scholar]
- Gennetian LA, Duncan G, Knox V, Vargas W, Clark-Kauffman E, London AS. How welfare policies affect adolescents’ school outcomes: A synthesis of evidence from experimental studies. Journal of Research on Adolescence. 2004;14:399–423. [Google Scholar]
- Grieger LD, Schoeni RF, Danziger S. PSID Technical Paper Series, No. 08-0. Ann Arbor, MI: Institute for Social Research; 2008. Accurately measuring the trend in poverty in the United States in the panel study of income dynamics. [Google Scholar]
- Hogan DP, Eggebeen DJ, Clogg CC. The structure of intergenerational exchanges in American families. American Journal of Sociology. 1993;98:1428–1458. [Google Scholar]
- Jacobs JA, Gerson K. Who are the overworked Americans? Review of Social Economy. 1998;56:442–459. [Google Scholar]
- Lareau A. Unequal childhoods. Berkeley, CA: University of California Press; 2003. [Google Scholar]
- Lareau A, Cox A. Social class and the transition to adulthood: Differences in parents’ interactions with institutions. In: Carlson MJ, England P, editors. Social class and changing families in an unequal America. Stanford, CA: Stanford University Press; 2011. pp. 134–164. [Google Scholar]
- Morris PA, Huston AC, Duncan GJ, Crosby DA, Bos JM. How welfare and work policies affect children. New York: Manpower Demonstration Research Corporation; 2001. [Google Scholar]
- Oppenheimer VK. Cohabiting and marriage during young men’s career-development process. Demography. 2003;40:127–149. doi: 10.1353/dem.2003.0006. [DOI] [PubMed] [Google Scholar]
- Oppenheimer VK, Kalmijn M, Lew V. Men’s career development and marriage timing during a period of rising inequality. Demography. 1997;34:311–330. [PubMed] [Google Scholar]
- Reardon S. The widening academic achievement gap between the rich and the poor: New evidence and possible explanations. In: Duncan GJ, Murnane R, editors. Whither opportunity? Rising inequality, schools, and children’s life chances. New York: Russell Sage; 2011. pp. 91–116. [Google Scholar]
- Schoeni RF, Ross KE. Material assistance from families during the transition to adulthood. In: Settersten RA Jr, Furstenberg FF Jr, Rumbaut RG, editors. On the frontier of adulthood. Chicago, IL: University of Chicago Press; 2005. pp. 396–416. [Google Scholar]
- Settersten RA, Jr, Ray B. What’s going on with young people today? The long and twisting path to adulthood. The Future of the Children. 2010;20(1):19–41. doi: 10.1353/foc.0.0044. [DOI] [PubMed] [Google Scholar]
- Telzer EH, Fuligni AJ. Daily family assistance and the psychological well-being of adolescents from Latin American, Asian, and European backgrounds. Developmental Psychology. 2009;45:1177–1189. doi: 10.1037/a0014728. [DOI] [PubMed] [Google Scholar]
- U.S. Census Bureau. US Census Bureau reports men and women wait longer to marry [News Release] Washington, DC: Author; 2010. Nov 10, Retrieved from http://www.census.gov/newsroom/releases/archives/families_households/cb10-174.html. [Google Scholar]
- U.S. Census Bureau. College enrollment of recent high school completers: 1970–2009. Washington, DC: Author; 2012. Retrieved from http://www.census.gov/compendia/statab/2012/tables/12s0276.pdf. [Google Scholar]
- Williams JC, Boushay H. The three faces of work-family conflict: The poor, the professionals, and the missing middle [Report] Washington, DC: Center for American Progress; 2010. [Google Scholar]