Abstract
Purpose of Review
This article summarizes the use of MRI in the diagnosis and treatment of multiple sclerosis (MS). Current and emerging imaging techniques are reviewed pertaining to their utility in MS.
Recent Findings
Conventional T1-weighted and T2-weighted sequences are used to identify and characterize disease pathology in MS. T2 lesion burden, postcontrast enhancement, T1 hypointensities, and regional and global atrophy are all informative and correlate to clinical measures, such as disease disability, to a variable extent. Newer techniques such as diffusion tensor imaging, magnetization transfer imaging, and MR spectroscopy are increasingly being incorporated into clinical trials and may provide improved specificity to the underlying pathology. Double inversion recovery and ultrahigh-field-strength MRI have direct application in MS for evaluating cortical pathology. Newer functional MRI techniques such as resting-state functional connectivity are increasingly being applied in MS.
Summary
Conventional and emerging imaging techniques greatly inform our understanding of MS. These techniques are integral in diagnosis, in evaluating new treatments for MS, and for following patients in the clinical setting.
INTRODUCTION
One could argue that neuroimaging has made the single greatest impact on our current understanding of multiple sclerosis (MS) and its treatment. MRI in particular offers an in vivo window for examining the underlying pathology of MS. Imaging augments our understanding of the disease by elucidating the mechanism and progression of disability in ways histopathologic studies have never achieved. Today, MRI is commonly used to (1) aid in the diagnosis of MS, (2) help evaluate new MS treatments more efficiently in clinical trials, and (3) follow patients clinically, both on and off disease-modifying therapy. Currently, the primary goals in developing new imaging techniques in MS include (1) increasing the specificity for the type ofunderlying pathology, including demyelination and axonal loss; (2) developing improved predictive markers offuture disease activity and disability; and (3) developing biomarkers increasingly sensitive to gray matter pathology that was previously underappreciated and understudied.
THE ROLE OF IMAGING IN THE DIAGNOSIS OF MULTIPLE SCLEROSIS
MRI represents perhaps the single most important diagnostic test supporting the diagnosis of MS. Current 2010 McDonald diagnostic criteria for MS (covered in greater detail in the article “Diagnosis and Differential Diagnosis of Multiple Sclerosis” by Dr Ilana B. Katz Sand and Dr Fred D. Lublin in this issue of CONTINUUM) make use of MRI and allow for a diagnosis based on one MRI scan performed at a single point in time by adopting simplified Magnetic Imaging in Multiple Sclerosis (MAGNIMS) criteria for determining dissemination in space (Case 9-1).1 Using these criteria, dissemination in space is established by one or more lesions in at least two of the following four locations: periventricular, juxtacortical, infratentorial, and spinal cord (symptomatic brainstem and spinal cord lesions do not contribute to lesion count). In addition, MRI often effectively excludes other diseases of the CNS. Typical clinical MRI protocols currently include conventional sequences based on T1-weighted and T2-weighted imaging.
Case 9-1
A 28-year-old woman who was 4 months postpartum developed vertigo and diplopia that gradually improved over 4 days and eventually resolved. She had no history of other neurologic symptoms. Her neurologic examination was normal. Brain and spinal cord MRI showed multiple foci of T2 hyperintensity in the periventricular and juxtacortical white matter, cerebellum, brainstem, genu of the corpus callosum, and cervical spinal cord, including two contrast enhancing lesions (Figure 9-1). The patient was diagnosed with multiple sclerosis (MS) and started disease-modifying therapy. A repeat brain MRI performed 6 months after treatment initiation was unchanged and without evidence of contrast enhancing lesions.
Figure 9-1.
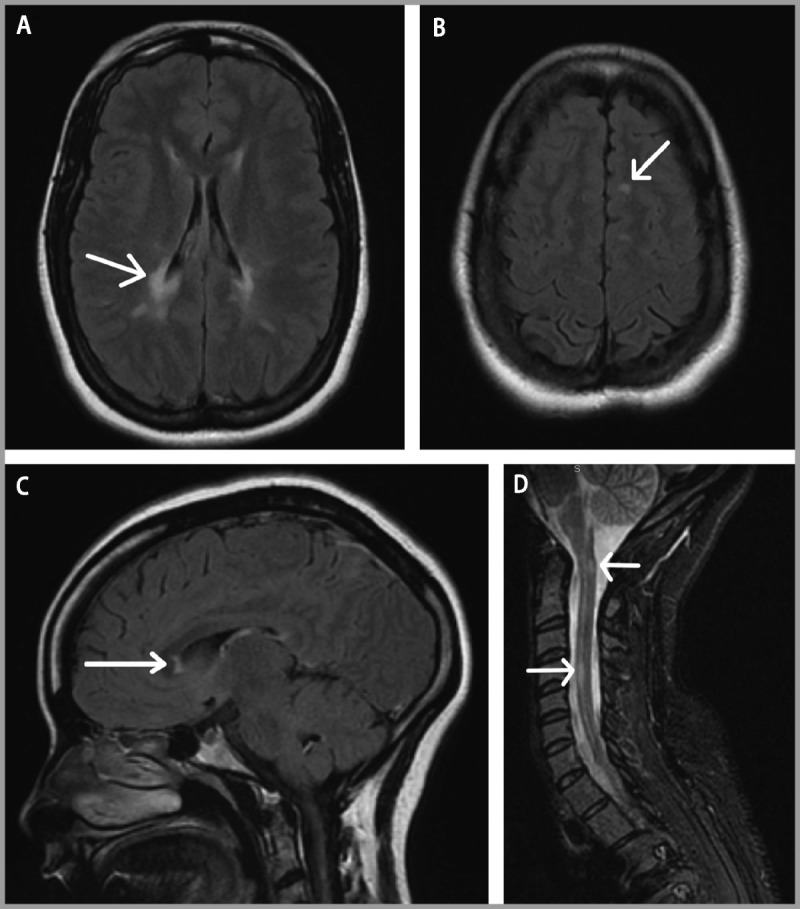
Brain and spinal cord MRI. Brain MRI at the time of diagnosis demonstrates A, periventricular lesions (arrow); B, juxtacortical lesions (arrow); and C, corpus callosum lesions (arrow) on fluid-attenuated inversion recovery (FLAIR) sequences. D, Spinal cord short T1 inversion recovery (STIR) image reveals lesions at C1 and C4 (arrows).
Comment. This case represents a typical presentation for MS. The presence of T2-hyperintense lesions in locations typical for MS satisfies 2010 McDonald criteria for dissemination in space, and the presence of enhancing and nonenhancing lesions satisfies criteria for dissemination in time based on the initial MRI. As is common in clinical practice, a repeat MRI 6 months after starting therapy assesses for the presence of breakthrough disease. If evidence of disease activity is present, even if asymptomatic, consideration should be given to alternative therapies for patients with suboptimal treatment response on MRI.
T2-Weighted Sequences
White matter lesions characteristic of MS are best seen on fluid-attenuated inversion recovery (FLAIR) sequences that suppress signal from the CSF and allow for increased sensitivity in detecting periventricular hyperintense lesions. The characteristic ovoid-appearing white matter hyperintensities on MRI have a predilection for periventricular and juxtacortical locations (Figures 9-2A and 9-2B). In contrast, nonspecific, small, round T2 hyperintensities typical for microvascular disease or migraine headache are observed in a subcortical location (Figure 9-2C). The periventricular distribution of MS lesions relates to the association with venules that is obvious on histopathology, ultrahigh-field-strength MRI (Figure 9-3), and a newly developed technique at 3 Tesla combining FLAIR and gradient echo T2*-weighted contrasts on a single image, called FLAIR*.2 Of note, the presence of a central vein, as demonstrated at higher field strengths, helps distinguish MS lesions from white matter lesions in other conditions and brain abnormalities seen in neuromyelitis optica (NMO).3,4 The corpus callosum is of particular regional interest because of its relative specificity as a common site of MS lesions and potential relationship to cognitive dysfunction.5 Visualization of the corpus callosum is optimized by inclusion of a sagittal FLAIR sequence in an MS-protocol MRI (Figure 9-4).
Figure 9-2.
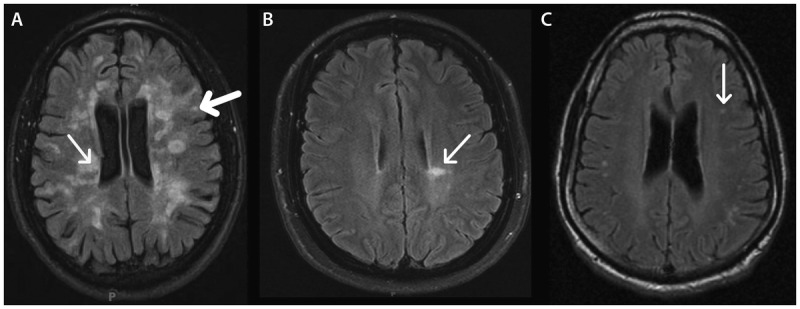
Location and appearance of multiple sclerosis (MS) lesions on fluid-attenuated inversion recovery (FLAIR) images. In MS, hyperintense FLAIR lesions are typically seen in periventricular (thin arrow) and juxtacortical (thick arrow) locations (A). Some lesions can radiate perpendicularly away from the lateral ventricles as fingerlike projections (arrow), termed “Dawson fingers” (B). In other diseases such as migraine, T2 hyperintensities tend to be small and round in appearance and subcortical in location (arrow) (C), although these lesions can also be seen in MS.
Figure 9-3.
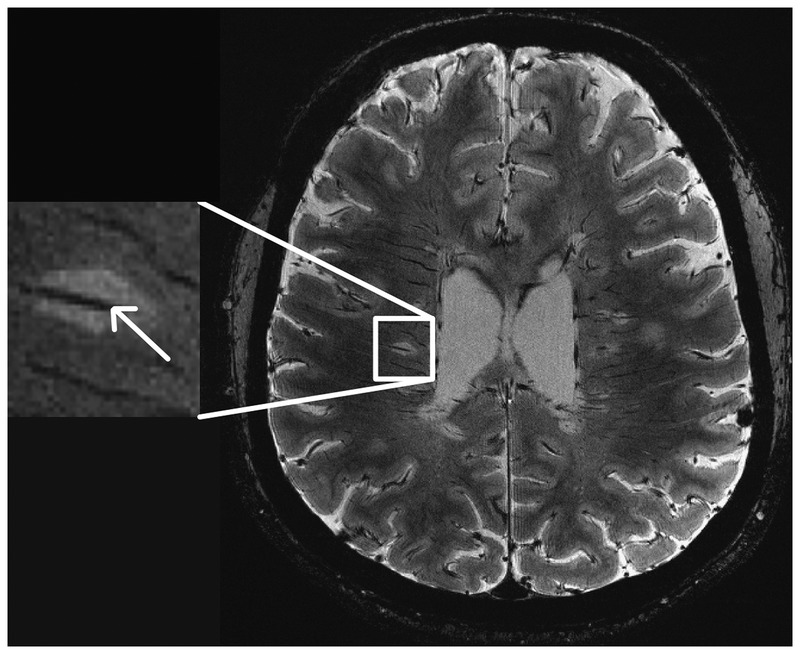
This fast low-angle shot (FLASH) T2*-weighted image at 7 Tesla demonstrates multiple lesions with venules coursing through (arrow).
Figure 9-4.
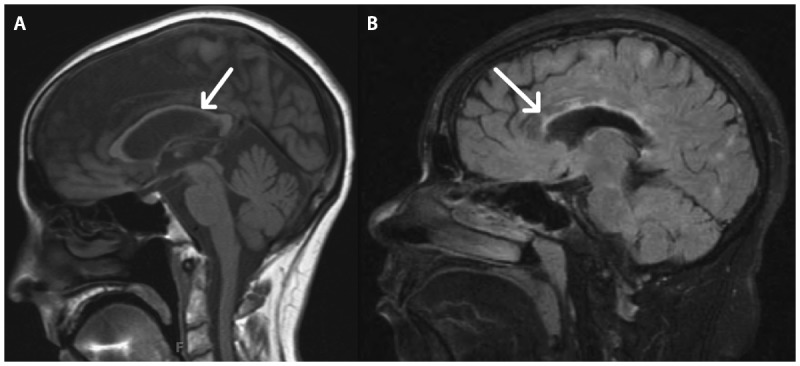
Corpus callosum imaging. A, A sagittal T1-weighted image shows significant corpus callosal thinning (arrow), indicative of atrophy. B, In a different patient, focal lesions (arrow) within the corpus callosum are visualized.
Other infratentorial brain locations with a predilection for MS plaques include the cerebellum, cerebellar peduncles, and brainstem. In contrast to the supratentorium, posterior fossa lesions are better visualized with T2-weighted and proton density images compared to FLAIR because of flow-related artifacts and poor lesion contrast (Figure 9-5).
Figure 9-5.
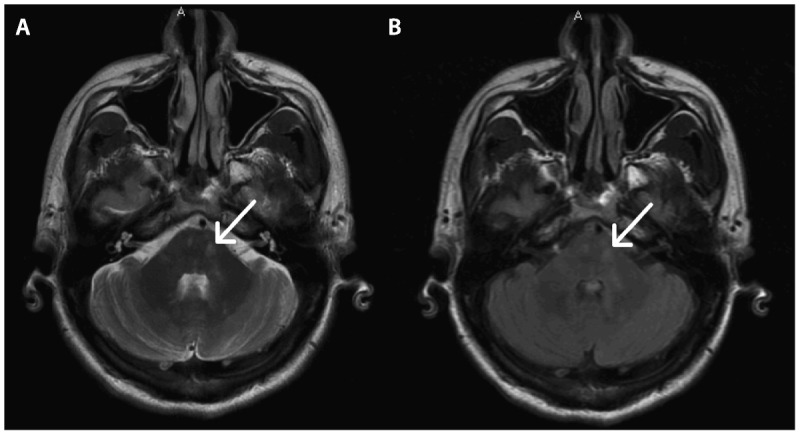
Demyelinating lesions in the posterior fossa (arrows) are typically visualized better with T2-weighted images (A) as compared to fluid-attenuated inversion recovery (FLAIR) images (B).
Contrast Enhancement and T1-Weighted Sequences
Inflammation in acute demyelinating MS lesions causes increased blood-brain barrier permeability. This leads to contrast enhancement on postgadolinium T1-weighted imaging. Contrast enhancement typically persists for 1 month on average, allowing for the dichotomization of MS lesions into acute and chronic lesions.6 Contrast enhancement is less commonly seen in progressive phases of MS. However, its presence in progressive MS may predict response to disease-modifying treatments that target inflammation.7
Enhancement patterns are variable but can be classified as nodular, punctate, or ringlike (Figure 9-6). Some lesions, particularly those with a tumefactive (ie, tumorlike) appearance, show an open-ring pattern,8 which may be helpful in discriminating a demyelinating lesion from abscess or neoplasm. Recognition of tumefactive MS on the differential diagnosis of ring enhancing and open-ring enhancing lesions may preclude the need for tissue biopsy where the underlying diagnosis is unclear. The enhancement pattern can evolve over time, with nodular lesions enhancing centrifugally (ie, outward) and ringlike enhancing lesions enhancing centripetally (ie, inward).9 There is value in having postcontrast T1 sequences in the axial, coronal, and sagittal planes incorporated into a clinical MS-protocol MRI tobetter increase the sensitivity of detecting contrast enhancing lesions. Delaying imaging after contrast administration will also increase sensitivity.
Figure 9-6.
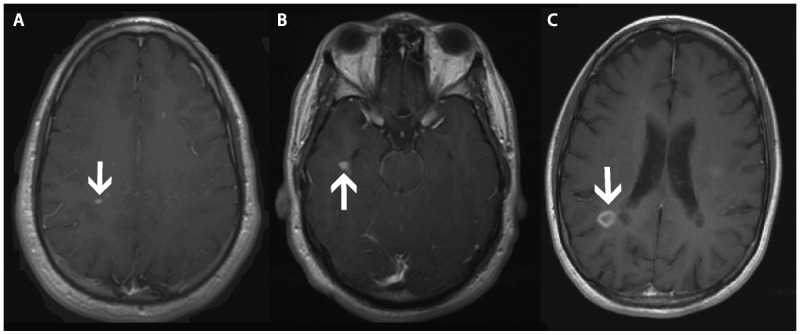
Patterns of contrast enhancement on postcontrast T1-weighted images include punctate (arrow) (A), nodular (arrow) (B), and ringlike (arrow) (C).
In addition, T1 hypointensities (alsotermed “black holes”) are characteristic of some but not all lesions at the time of contrast enhancement (Figure 9-7). A minority of acute T1 hypointensities will be persistent (lasting longer than 12 months), while others resolve and become isointense (termed “transient black holes”). Characteristics that predict persistence of black holes include a ring enhancing pattern of gadolinium enhancement, enhancement on two or more monthly MRIs, and enhancement greater than 6mm in diameter.10 Chronic T1 hypointensities are correlated with greater tissue damage and increased axonal damage on histopathology.11
Figure 9-7.
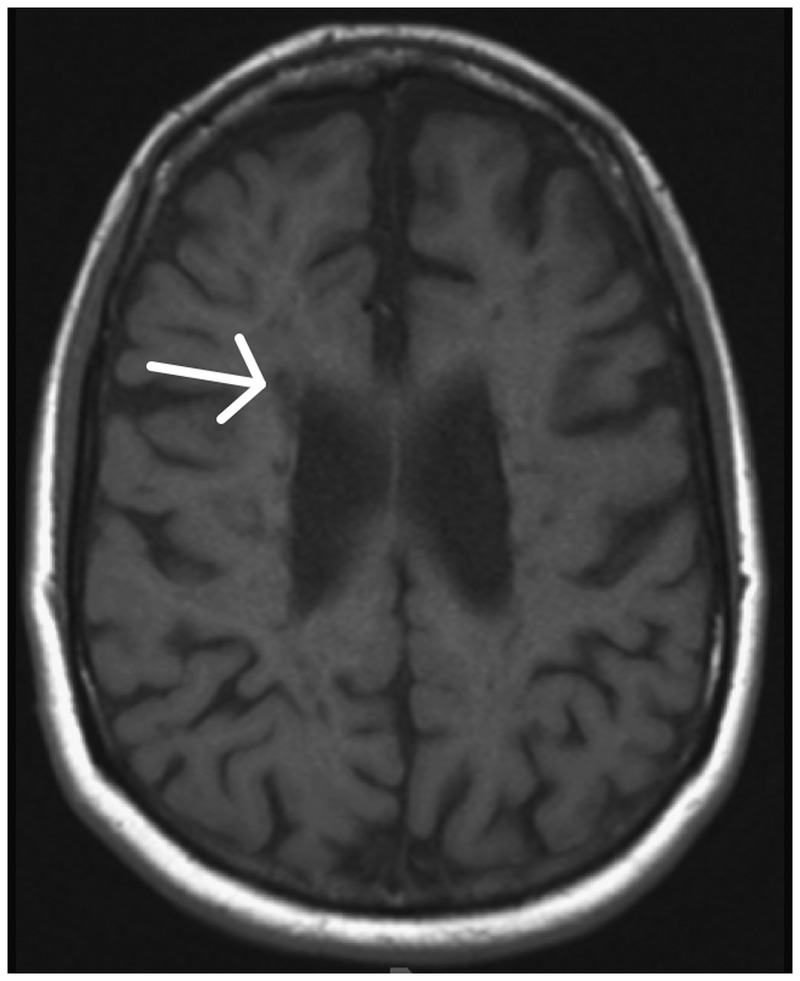
T1-weighted imaging in a patient with MS exhibits significant atrophy with prominent sulci and numerous T1 hypointensities (arrow).
Brain Atrophy
Atrophy progresses in MS at a rate (0.5% to 1% per year) greater than that observed in typical aging (see Figure 9-7). Considered a substrate for clinical disability and cognitive dysfunction, atrophy can occur early in the disease course of MS.12 Atrophy can be characterized as a global phenomenon in MS, occurring in both white matter and gray matter, but can also be evaluated on a regional basis.More advanced computational methods allow for brain segmentation into gray and white matter.13 Furthermore, deep gray matter can be excluded to produce a cortical atrophy measure. A preponderance of evidence suggests that segmented gray matter atrophy correlates better with clinical disability than white matter atrophy, although with some conflicting results.14,15 The mechanism of gray matter atrophy and its relationship to white matter disease remains an area of intense interest. Atrophy continues in the progressive phases of MS when the inflammatory component of the disease has diminished, providing an imaging outcome of particular interest in clinical trials evaluating potential neuroprotective agents geared toward progressive MS.16
Of the regional white matter structures, corpus callosum atrophy is widely appreciated in MS and correlates with level of disability (see Figure 9-4).17 The thalamus represents a deep gray matter structure with a relationship tocognitive dysfunction.18 Thalamic atrophy predicts conversion of clinically isolated syndrome (CIS) to MS and progression of disability.19,20 Regional hippocampal atrophy in the cornu ammonis (CA) 1 region is reported in relapsing-remitting MS and associated with memory-encoding dysfunction.21
Spinal Cord Imaging
Spinal cord imaging provides additional support for the diagnosis of MS in many instances. Spinal cord abnormalities are described in more than 80% of patients recently diagnosed with MS, with a proclivity for the cervical cord.22 Spinal cord lesions tend to span one vertebral segment or less. They tend to be located in an eccentric, dorsal, or lateral location in the axial plane of the cord and span less than half of the axial cord (Figure 9-8). In contrast, NMO spinal cord lesions are more likely to be longitudinally extensive, affect the spinal cord gray matter, and have associated T1 hypointensity.23
Figure 9-8.

Spinal cord short T1 inversion recovery (STIR) images in the sagittal (A) and axial (B) planes demonstrate eccentric lesions (arrows) that span less than one vertebral segment in a patient with multiple sclerosis.
USING NEUROIMAGING TO MONITOR PATIENTS WITH MULTIPLE SCLEROSIS
Subclinical inflammatory disease activity occurs commonly in MS and is captured to some extent by conventional MRI. Serial MRI can be employed in a number of clinical scenarios. Some patients with a first clinical demyelinating event (ie, CIS) will initially defer starting long-term MS disease-modifying therapy. In thesecases, MRIhelps monitor for asymptomatic inflammatory disease activity that maytip the balance for making the decision to start disease-modifying therapy. Radiologically isolated syndrome, in which an abnormal brain MRI consistent with MS is incidentally discovered, represents another group at high risk of developing clinically definite MS. Case 9-2 highlights the importance of closely following patients (clinically and with MRI) who are at a particularly high risk of converting to MS.
Case 9-2
A 55-year-old woman experienced an episode of difficulty reading the newspaper. Approximately 30 minutes later, she had trouble expressing herself when ordering coffee, lasting only seconds. Workup for these symptoms included imaging studies to evaluate for ischemia. Brain MRI was potentially consistent with demyelination with 10 T2 hyperintensities, some with the appearance of Dawson fingers (Figure 9-9A). Spinal cord imaging was normal (Figure 9-9B). Family history was notable for multiple sclerosis (MS) in her sister. Without clinical events definitely attributable to demyelinating disease, the patient was diagnosed with a radiologically isolated syndrome. She did not start treatment for MS at that time. Serial imaging remained unchanged until 1 year later in the setting of left arm numbness. At that time, new cervical spinal T2 hyperintensities were discovered, including one at C1-2 (Figure 9-9C).
Figure 9-9.

Baseline and follow-up brain MRI. A, Brain MRI is remarkable for characteristic Dawson fingers (arrow). B, Initial spinal cord MRI was normal. C, Follow-up spinal cord imaging 1 year later shows interval development of lesions at C1-2 and C4-5 (arrows).
Comment. This case highlights the importance of closely following patients (clinically and with MRI) who are at a particularly high risk of converting to MS and are not currently on disease-modifying therapy. In this case, it was helpful to have baseline spinal cord imaging (which was normal) to clearly demonstrate progression of disease that corresponded with subsequent symptoms.
For patients who are treated with a disease-modifying agent for MS, MRI is commonly used to assess the efficacy of the selected therapy. A follow-up MRI should be performed 6 to 12 months after starting a new therapy. In a large retrospective study of MS patients on therapy, the presence of more than two enhancing lesions at 1 year was a predictor of poor clinical outcomes at 5 years.24 Annual to biannual monitoring of brain imaging during the relapsing stage of MS is commonly practiced despite the lack of clear consensus. While monitoring with MRI offers only a snapshot of contrast enhancing lesions, new or enlarging T2 lesions and new T1 hypointensities may also be monitored. Brain imaging is generally considered a more sensitive surveillance tool than spinal cord imaging for longitudinal monitoring. In addition, brain imaging is more likely to identifysubclinical inflammation, where inflammation affecting the spinal cordis more likely to be symptomatic.Considerations for time and cost constraints may limit spinal cord MRI for monitoring MS treatments.
Currently, a notable drawback of monitoring patients with serial imaging is the inability to follow changes in brain atrophy in clinical practice. In addition, an unchanged brain MRI based on conventional sequences may give a false sense of security of disease stability, when in fact conventional sequences may be relatively insensitive to subtle changes. These issues necessitate development of more advanced techniques that can quantify changes in normal-appearing white and gray matter. Once these advanced techniques are fully validated and automated for quantitation, the goal is to incorporate them into the care of individual patients.
ADVANCED IMAGING METHODS FOR IMPROVING SPECIFICITY FOR UNDERLYING PATHOLOGY
Conventional MRI sequences lack a true specificity for underlying pathology of a given lesion. Hyperintense T2 lesions can contain a variable extent of demyelination, remyelination, axonal loss, inflammation, and edema. This variability may explain some of the discrepancy that can be seen between T2 lesion load and clinical disability, as exemplified by Case 9-3. Application of advanced quantitative imaging techniques addresses these deficiencies by attempting to improve the specificity for detecting the extent of demyelination or axonal loss. Diffusion tensor imaging (DTI), magnetization transfer imaging, and proton magnetic resonance spectroscopy have each been studied extensively and are being incorporated as secondary outcome measures in many clinical trials. Ultrahigh-field MRI and functional MRI (fMRI) provide additional means to understand disease mechanism and progression.
Case 9-3
A previously healthy 27-year-old man presented with bilateral hand numbness. In retrospect, he reported experiencing 1 month of groin numbness 4 years ago. He denied a history of vision changes or other neurologic symptoms. Neurologic examination was remarkable only for lower extremity hyperreflexia and bilateral ankle clonus.
Spinal cord imaging revealed multiple T2 hyperintensities intrinsic to the cord, with an enhancing lesion at C2. Brain MRI supported the diagnosis of multiple sclerosis with innumerable T2 hyperintensities in a periventricular and juxtacortical distribution and a severe disease burden (Figure 9-10). A minority of the lesions exhibited T1 hypointensity. A total of seven gadoliniumenhancing lesions were present.
Figure 9-10.
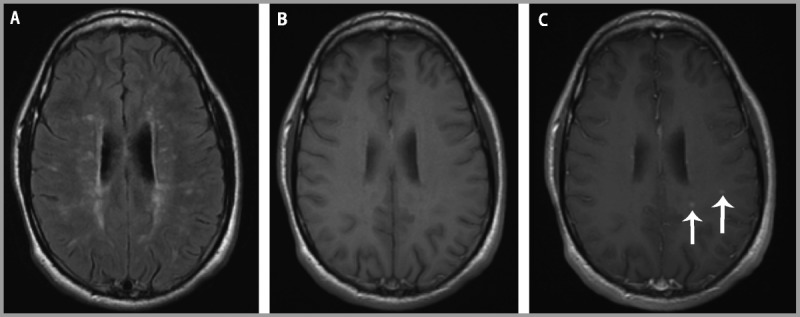
Brain MRI. A, Brain MRI shows multiple lesions on fluid-attenuated inversion recovery (FLAIR) but, B, few T1 hypointensities. C, Postcontrast T1-weighted images show several enhancing lesions (arrows) on this slice.
Comment. This case illustrates the discrepancy that is not uncommon between T2 lesion load and physical disability. In this case, few T1 hypointensities were evident, perhaps lending to the paucity of symptoms and examination findings. In light of the many enhancing lesions, one might consider treating this patient more aggressively to control the active inflammatory component of his disease and to preserve the low level of disability.
Diffusion Tensor Imaging
DTI may serve to evaluate the structural integrity of white matter and canalso be used for probabilistic or deterministic tractography (Figure 9-11). Both methods make use of the directional diffusion of water in tissue, which is affected by surrounding structures in CNS white matter. In normal white matter, water diffusion is greater in the direction parallel to axons (ie, axial diffusivity [AD]) than perpendicular to axons (radial diffusivity [RD]). Mean diffusivity (MD) and fractional anisotropy (FA) are other descriptive summary parameters derived from the diffusion characteristics. In animal models, increased RD correlates greatest with demyelination, and decreased AD correlates with acute axonal damage.25 In some in vivo studies of MS, RD appears to provide the closest correlation with tissue integrity.26 The association of AD and axonal damage in MS is less well established. DTI provides evidence for the revelation that white matter that appears normal on conventional imaging techniques, so-called normal-appearing white matter, is in fact not normal. Microglial activation and axonal pathology may explain this phenomenon.27 A multicenter validation study indicated that FA is the most comparable DTI measure across centers and supports its use in multicenter clinical trials.28
Figure 9-11.
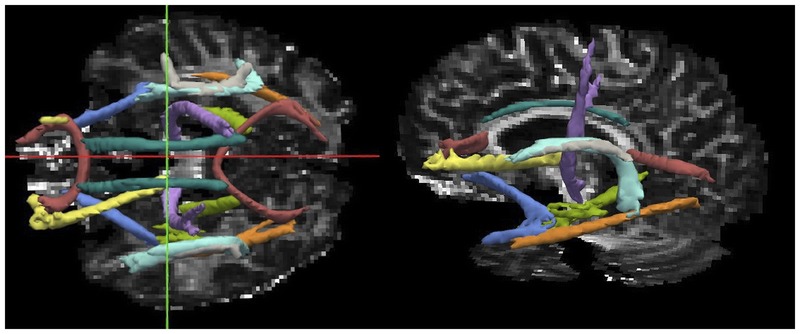
A probabilistic global tractography tool called Tracts Constrained by Underlying Anatomy (TRACULA) is used to reconstruct the major white matter tracts using diffusion tensor imaging (DTI) and anatomical constraints in a patient with multiple sclerosis. Diffusion tensor imaging parameters can be derived from any of the reconstructed white matter tracts. This method precludes the need to manually draw regions of interest to derive DTI measures.
Magnetization Transfer Imaging
Magnetization transfer imaging is based on the transfer of magnetization between semisolid and water protons in different structural environments. In intact white matter myelin, protons are bound to macromolecules such as lipids, yielding a high magnetization transfer ratio (MTR). In contrast, in areas of demyelination, decreased binding of protons reduces MTR.29 Longitudinal studies demonstrate decreases in MTR preceding contrast enhancement. There is marked reduction in MTR during contrast enhancement, followed by partial or complete resolution as inflammation reduces and remyelination occurs.30 Because of these features, this technique provides a promising primary outcome measure to evaluate remyelinating therapies in clinical trials. Several metrics that have been proposed for further study include intralesional MTR and whole-brain MTR.31 MTR may also provide insight into gray matter pathology, which is not well visualized using conventional imaging.32
Proton Magnetic Resonance Spectroscopy
Proton magnetic resonance spectroscopy detects metabolites in the neural tissues. N-acetylaspartate (NAA) is found in neurons and their processes and represents a candidate marker for axonal loss. A longitudinal study demonstrates a decrease in whole-brain NAA over a 2-year period in relapsing-remitting MS.33 Another study evaluated the ratio of myo-inositol, a marker of astrogliosis, to NAA in MS. The ratio of myo-inositol to NAA predicted future atrophy and disability progression.34 A new method of applying the technique of DTI to spectroscopy is termed “diffusion tensor spectroscopy.” Preliminary results indicate that reduced diffusion of NAA along axons may represent a marker of axonal damage.35
Advanced Spinal Cord Imaging
Applying the above-mentioned advanced imaging techniques in the spinal cord can be technically challenging for various reasons, including physiologic motion (ie, respiration, cardiac pulsation, CSF pulsation) and magnetic field inhomogeneity due to nearby vertebrae. However, various advanced imaging sequences have potential to better quantify the contribution of spinal cord pathology to level of disability. Atrophy also occurs in the spinal cord in MS and correlates to a greater extent with disability than other brain measures of atrophy in patients with mild disability.36 Spinal cord atrophy holds attraction as an outcome measure in progressive MS clinical trials because of the close relationship of this stage of MS with spinal cord damage. Other advanced techniques, such as DTI and MTR, can be implemented in the spinal cord but require careful attention from an MR physicist to reduce artifacts. These techniques allow for tract-specific measurements by placing regions of interest in the dorsal column or lateral corticospinal tracts of the spinal cord. Using these tract-specific techniques, differences between MS and NMO (a disease known to have greater tissuedestruction) can be observed.37 In a separate large study examining quantitative spinal cord measures such as spinal cord atrophy, DTI, and MTR, independent association of FA, MD, RD, and MTR with level of disability was observed.38 As the application of these techniques to the spinal cord continues to progress, it may eventually be possible to better incorporate spinal cord imaging into therapeutic clinical trials.
Imaging Cortical Pathology
Focal cortical demyelination has been long observed in autopsy studies of MS.39 However, identification of cortical lesions in vivo eludes clinicians at traditional field strengths. Several techniques have been championed to evaluate cortical pathology in MS. One attractive 3-Tesla technique is double inversion recovery (DIR), often used in conjunction with phase-sensitive inversion recovery (PSIR). Two inversion pulses suppress signal of both CSF and white matter in DIR. Intracortical lesions detected by DIR and PSIR are associated with cognitive dysfunction in MS.40 Because DIR can be implemented on 3-Tesla platforms, it offers the advantage of universal incorporation into clinical trials and clinical practice. However, DIR imaging suffers from signal artifacts that can be confused with cortical lesions and may lead to poor interrater reproducibility in identification of cortical lesions, even after implementing consensus recommendations.41 In addition, compared to higher field strengths, DIR suffers lower sensitivity for detecting cortical lesions, particularly subpial lesions.42
Compared to conventional field strengths, ultrahigh-field 7-Tesla MRI takes advantage of significant increases in signal-to-noise ratio to increase spatial resolution. The increased resolution notably decreases the partial volume effect between the gray matter and adjacent CSF and white matter. Ultrahigh-field imaging has allowed improved sensitivity for detecting corticallesions of all subtypes (leukocortical spanning white and gray matter, intracortical, and subpial) that closely mirror subtype distribution described in ex vivo studies (Figure 9-12).43 In addition, an overall subpial signal increase in specific areas of the cortex in MS patients compared to healthy controls provides evidence for the in vivo existence of disseminated subpial changes in MS.44 Pathologic correlation studies indicate that ultrahigh-field imaging has reasonable sensitivity for detecting cortical lesions.45 Once cortical lesions can be reliably detected on universal platforms, they can be incorporated into diagnostic criteria, likely increasing both the sensitivity and specificity of criteria.
Figure 9-12.
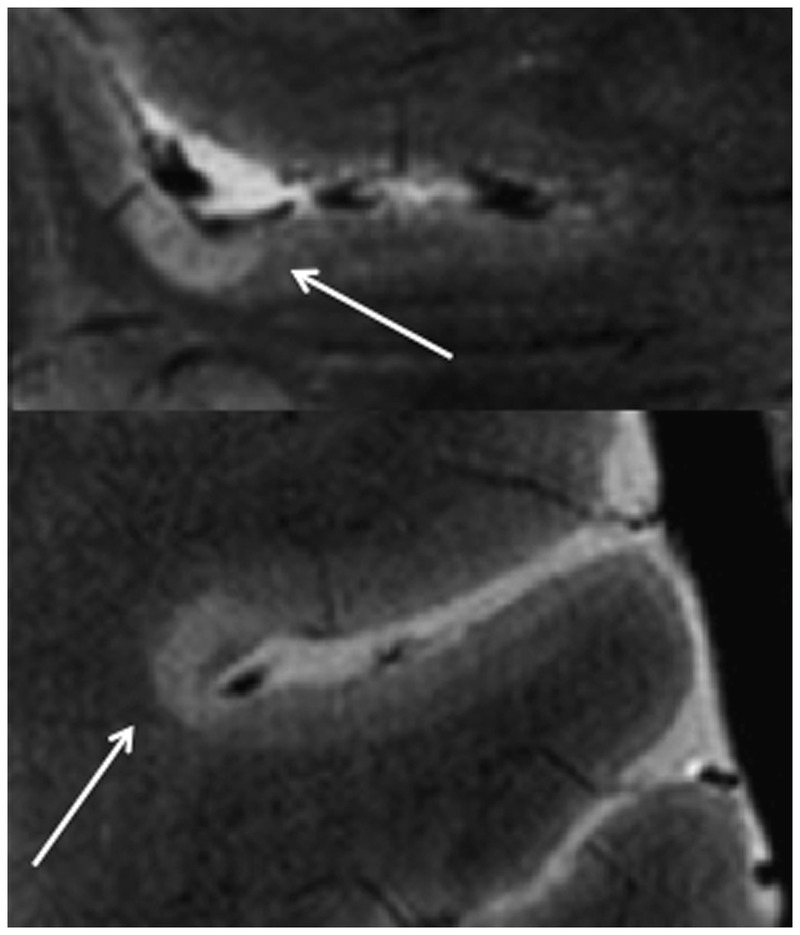
On fast low-angle shot (FLASH) T2 images, cortical lesions (arrows) are demonstrated in a patient with multiple sclerosis. Figure courtesy of Caterina Mainero, MD, PhD.
Functional MRI
Functional MRI offers the advantage over other discussed imaging techniques by providing evidence for plasticity in MS. A recent application of fMRI is the discovery of a highly and specifically organized spontaneous component ofblood oxygen level–dependent (BOLD) signal that is present while the brain is at rest.46 The correlation of regions of spontaneous resting-state BOLD fluctuations has been termed “functional connectivity.” These low-frequency (less than 0.1 Hz) fluctuations in BOLD occurring in synchrony in multiple regions are believed to reflect monosynaptic or polysynaptic anatomical connections and distributed neuronal networks (Figure 9-13). Several studies have demonstrated decreased functional connectivity in transcallosal sensorimotor pathways in MS compared to control subjects.47 Evidence shows increased connectivity in networks ofpatients with a CIS.48 Conversely, decreased functional connectivity in the default mode network (cortical areas activated while the brain is engaged in inward tasks) is seen in progressive MS compared to control subjects.49 These results suggest an early adaptive mechanism in MS patients that is eventually overcome following increased disease burden. Resting-state functional connectivity may have future applications to elucidate the cause of cognitive dysfunction in MS.
Figure 9-13.

The default mode network is of particular interest in multiple diseases, including multiple sclerosis (MS). Averaged in 19 MS patients, this connectivity map shows components of the default mode network.
CONCLUSION
MRI is integral to making the early and accurate diagnosis of MS. It provides valuable information for monitoring patients to identify the level of treatment response. The goal of emerging techniques is to provide markers moresensitive to changes in the disease and more specific to the underlying pathology. In doing so, improved correlation with current and future levels of disability can be achieved.
KEY POINTS
The 2010 revised McDonald criteria adopt simplified Magnetic Imaging in Multiple Sclerosis (MAGNIMS) criteria for determining dissemination in space.
Dissemination in space is established by one or more lesions in at least two of the following four locations: periventricular, juxtacortical, infratentorial, and spinal cord (symptomatic brainstem and spinal cords lesions do not contribute to lesion count).
The periventricular distribution of multiple sclerosis lesions relates to the association with venules.
The corpus callosum is a common site of multiple sclerosis lesions and is optimally viewed on sagittal fluid-attenuated inversion recovery (FLAIR) images.
Contrast enhancement is less commonly seen in progressive phases of multiple sclerosis.
Recognition of tumefactive multiple sclerosis on the differential diagnosis of ring enhancing and open-ring enhancing lesions may preclude the need for tissue biopsy where the underlying diagnosis is unclear.
Persistent T1 hypointensities are correlated with greater tissue damage and increased axonal damage on histopathology.
Gray matter atrophy may correlate with physical disability to a greater extent than white matter atrophy.
Atrophy starts early in the disease and continues into progressive stages.
Subclinical inflammatory disease activity occurs commonly in multiple sclerosis and is captured to some extent by conventional MRI.
Advanced techniques that can increase the specificity for the underlying pathology in multiple sclerosis may improve evaluation of new treatments for the disease, including progressive multiple sclerosis.
Diffusion tensor imaging, magnetization transfer ratio, and magnetic resonance spectroscopy are all capable of detecting changes throughout the brain of multiple sclerosis patients, including normal-appearing white matter.
Double inversion recovery and ultrahigh-field 7-Tesla MRI detect cortical lesions, although each technique has its own limitations.
Functional MRI may have application for observing and quantifying adaptive plasticity in multiple sclerosis.
ACKNOWLEDGMENTS
The author would like to thank Sean Tobyne, MA for critical review of the manuscript and Caterina Mainero, MD, PhD for providing images for Figure 9-12.
REFERENCES
- 1. Polman CH, Reingold SC, Banwell B, et al. Diagnostic criteria for multiple sclerosis: 2010 revisions to the McDonald criteria. Ann Neurol 2011; 69 (2): 292– 302. [DOI] [PMC free article] [PubMed] [Google Scholar]
- 2. Sati P, George IC, Shea CD, et al. FLAIR*: A combined MR contrast technique for visualizing white matter lesions and parenchymal veins. Radiology 2012: 265 (3): 926– 932. [DOI] [PMC free article] [PubMed] [Google Scholar]
- 3. Tallantyre EC, Dixon JE, Donaldson I, et al. Ultra-high-field imaging distinguishes MS lesions from asymptomatic white matter lesions. Neurology 2011; 76 (6): 534– 539. [DOI] [PMC free article] [PubMed] [Google Scholar]
- 4. Sinnecker T, Dorr J, Pfueller CF, et al. Distinct lesion morphology at 7-T MRI differentiates neuromyelitis optica from multiple sclerosis. Neurology 2012; 79 (7): 708– 714. [DOI] [PubMed] [Google Scholar]
- 5. Pelletier J, Habib M, Lyon-Caen O, et al. Functional and magnetic resonance imaging correlates of callosal involvement in multiple sclerosis. Arch Neurol 1993; 50 (10): 1077– 1082. [DOI] [PubMed] [Google Scholar]
- 6. Cotton F, Weiner HL, Jolesz FA, Guttmann CR. MRI contrast uptake in new lesions in relapsing-remitting MS followed at weekly intervals. Neurology 2003; 60 (4): 640– 646. [DOI] [PubMed] [Google Scholar]
- 7. Hawker K, O’Connor P, Freedman MS, et al. Rituximab in patients with primary progressive multiple sclerosis: results of a randomized double-blind placebo-controlled multicenter trial. Ann Neurol 2009; 66 (4): 460– 471. [DOI] [PubMed] [Google Scholar]
- 8. Masdeu JC, Moreira J, Trasi S, et al. The open ring. A new imaging sign in demyelinating disease. J Neuroimaging 1996; 6 (2): 104– 107. [DOI] [PubMed] [Google Scholar]
- 9. Gaitan MI, Shea CD, Evangelou IE, et al. Evolution of the blood-brain barrier in newly forming multiple sclerosis lesions. Ann Neurol 2011; 70 (1): 22– 29. [DOI] [PMC free article] [PubMed] [Google Scholar]
- 10. Bagnato F, Jeffries N, Richert ND, et al. Evolution of T1 black holes in patients with multiple sclerosis imaged monthly for 4 years. Brain 2003; 126 (pt 8): 1782– 1789. [DOI] [PubMed] [Google Scholar]
- 11. van Walderveen MA, Kamphorst W, Scheltens P, et al. Histopathologic correlate of hypointense lesions on T1-weighted spin-echo MRI in multiple sclerosis. Neurology 1998; 50 (5): 1282– 1288. [DOI] [PubMed] [Google Scholar]
- 12. Chard DT, Griffin CM, Parker GJ, et al. Brain atrophy in clinically early relapsing-remitting multiple sclerosis. Brain 2002; 125 (pt 2): 327– 337. [DOI] [PubMed] [Google Scholar]
- 13. Ge Y, Grossman RI, Udupa JK, et al. Brain atrophy in relapsing-remitting multiple sclerosis: fractional volumetric analysis of gray matter and white matter. Radiology 2001; 220 (3): 606– 610. [DOI] [PubMed] [Google Scholar]
- 14. Rudick RA, Lee JC, Nakamura K, Fisher E. Gray matter atrophy correlates with MS disability progression measured with MSFC but not EDSS. J Neurol Sci 2009; 282 (1–2): 106– 111. [DOI] [PMC free article] [PubMed] [Google Scholar]
- 15. Shiee N, Bazin PL, Zackowski KM, et al. Revisiting brain atrophy and its relationship to disability in multiple sclerosis. PLoS One 2012; 7 (5): e37049. [DOI] [PMC free article] [PubMed] [Google Scholar]
- 16. Barkhof F, Calabresi PA, Miller DH, Reingold SC. Imaging outcomes for neuroprotection and repair in multiple sclerosis trials. Nat Rev Neurol 2009; 5 (5): 256– 266. [DOI] [PubMed] [Google Scholar]
- 17. Yaldizli O, Atefy R, Gass A, et al. Corpus callosum index and long-term disability in multiple sclerosis patients. J Neurol 2010; 257 (8): 1256– 1264. [DOI] [PubMed] [Google Scholar]
- 18. Houtchens MK, Benedict RH, Killiany R, et al. Thalamic atrophy and cognition in multiple sclerosis. Neurology 2007; 69 (12): 1213– 1223. [DOI] [PubMed] [Google Scholar]
- 19. Rocca MA, Mesaros S, Pagani E, et al. Thalamic damage and long-term progression of disability in multiple sclerosis. Radiology 2010; 257 (2): 463– 469. [DOI] [PubMed] [Google Scholar]
- 20. Calabrese M, Rinaldi F, Mattisi I, et al. The predictive value of gray matter atrophy in clinically isolated syndromes. Neurology 2011; 77 (3): 257– 263. [DOI] [PubMed] [Google Scholar]
- 21. Sicotte NL, Kern KC, Giesser BS, et al. Regional hippocampal atrophy in multiple sclerosis. Brain 2008; 131 (pt 14): 1134– 1141. [DOI] [PubMed] [Google Scholar]
- 22. Bot JC, Barkhof F, Polman CH, et al. Spinal cord abnormalities in recently diagnosed MS patients: added value of spinal MRI examination. Neurology 2004; 62 (2): 226– 233. [DOI] [PubMed] [Google Scholar]
- 23. Cassinotto C, Deramond H, Olindo S, et al. MRI of the spinal cord in neuromyelitis optica and recurrent longitudinal extensive myelitis. J Neuroradiol 2009; 36 (4): 199– 205. [DOI] [PubMed] [Google Scholar]
- 24. Romeo M, Martinelli V, Perego M, et al. Brain MRI activity after disease-modifying treatment may predict disability progression after 5 years in relapsing remitting multiple sclerosis patients [abstract]. Amsterdam, The Netherlands: Proceedings of the 5th Joint Triennial Congress of the European and Americas Committees for Treatment and Research in Multiple Sclerosis, 2011; 30; Abstract nr 29. [Google Scholar]
- 25. Song SK, Sun SW, Ramsbottom MJ, et al. Dysmyelination revealed through MRI as increased radial (but unchanged axial) diffusion of water. Neuroimage 2002; 17 (3): 1429– 1436. [DOI] [PubMed] [Google Scholar]
- 26. Naismith RT, Xu J, Tutlam NT, et al. Increased diffusivity in acute multiple sclerosis lesions predicts risk of black hole. Neurology 2010; 74 (21): 1694– 1701. [DOI] [PMC free article] [PubMed] [Google Scholar]
- 27. Moll NM, Rietsch AM, Thomas S, et al. Multiple sclerosis normal-appearing white matter: pathology-imaging correlations. Ann Neurol 2011; 70 (5): 764– 773. [DOI] [PMC free article] [PubMed] [Google Scholar]
- 28. Fox RJ, Sakaie K, Lee JC, et al. A validation study of multicenter diffusion tensor imaging: reliability of fractional anisotropy and diffusivity values. AJNR Am J Neuroradiol 2012; 33 (4): 695– 700. [DOI] [PMC free article] [PubMed] [Google Scholar]
- 29. Schmierer K, Scaravilli F, Altmann DR, et al. Magnetization transfer ratio and myelin in postmortem multiple sclerosis brain. Ann Neurol 2004; 56 (3): 407– 415. [DOI] [PubMed] [Google Scholar]
- 30. Chen JT, Collins DL, Atkins HL, et al. Magnetization transfer ratio evolution with demyelination and remyelination in multiple sclerosis lesions. Ann Neurol 2008; 63 (2): 254– 262. [DOI] [PubMed] [Google Scholar]
- 31. van den Elskamp IJ, Knol DL, Vrenken H, et al. Lesional magnetization transfer ratio: a feasible outcome for remyelinating treatment trials in multiple sclerosis. Mult Scler 2010; 16 (6): 660– 669. [DOI] [PubMed] [Google Scholar]
- 32. Abdel-Fahim R, Mistry N, Mougin O, et al. Improved detection of cortical lesions using 7T magentisation transfer imaging in patients with multiple sclerosis [abstract]. Lyon, France: Proceedings of the 28th Congress of the European Committee for Treatment and Research in Multiple Sclerosis, 2012; 50. Abstract nr 146. [Google Scholar]
- 33. Rigotti DJ, Inglese M, Kirov II, et al. Two-year serial whole-brain N-acetyl-L-aspartate in patients with relapsing-remitting multiple sclerosis. Neurology 2012; 78 (18): 1383– 1389. [DOI] [PMC free article] [PubMed] [Google Scholar]
- 34. Llufriu S, Kornak J, Ratinev H, et al. MR spectroscopy markers of disease progression in multiple sclerosis: a clinical validation study. Neurology 2012; 78: PL01.002. [Google Scholar]
- 35. Wood ET, Ronen I, Techawiboonwong A, et al. Investigating axonal damage in multiple sclerosis by diffusion tensor spectroscopy. J Neurosci 2012; 32 (19): 6665– 6669. [DOI] [PMC free article] [PubMed] [Google Scholar]
- 36. Cohen AB, Neema M, Arora A, et al. The relationships among MRI-defined spinal cord involvement, brain involvement, and disability in multiple sclerosis. J Neuroimaging 2012; 22 (2): 122– 128. [DOI] [PMC free article] [PubMed] [Google Scholar]
- 37. Klawiter EC, Xu J, Naismith RT, et al. Increased radial diffusivity in spinal cord lesions in neuromyelitis optica compared with multiple sclerosis. Mult Scler 2012; 18 (9): 1259– 1268. [DOI] [PMC free article] [PubMed] [Google Scholar]
- 38. Oh J, Zackowski K, Chen M, et al. Multiparametric MRI correlates of sensorimotor function in the spinal cord in multiple sclerosis [published online ahead of print August 13, 2013. Mult Scler. 10.1177/1352458512456614. [DOI] [PMC free article] [PubMed] [Google Scholar]
- 39. Kutzelnigg A, Lucchinetti CF, Stadelmann C, et al. Cortical demyelination and diffuse white matter injury in multiple sclerosis. Brain 2005; 128 (pt 11): 2705– 2712. [DOI] [PubMed] [Google Scholar]
- 40. Nelson F, Datta S, Garcia N, et al. Intracortical lesions by 3T magnetic resonance imaging and correlation with cognitive impairment in multiple sclerosis. Mult Scler 2011; 17 (9): 1122– 1129. [DOI] [PMC free article] [PubMed] [Google Scholar]
- 41. Geurts JJ, Roosendaal SD, Calabrese M, et al. Consensus recommendations for MS cortical lesion scoring using double inversion recovery MRI. Neurology 2011; 76 (5): 418– 424. [DOI] [PubMed] [Google Scholar]
- 42. de Graaf WL, Kilsdonk ID, Lopez-Soriano A, et al. Clinical application of multi-contrast 7-T MR imaging in multiple sclerosis: increased lesion detection compared to 3 T confined to grey matter. Eur Radiol 2012; 23 (2): 528– 540. [DOI] [PubMed] [Google Scholar]
- 43. Mainero C, Benner T, Radding A, et al. In vivo imaging of cortical pathology in multiple sclerosis using ultra-high field MRI. Neurology 2009; 73 (12): 941– 948. [DOI] [PMC free article] [PubMed] [Google Scholar]
- 44. Cohen-Adad J, Benner T, Greve D, et al. In vivo evidence of disseminated subpial T2* signal changes in multiple sclerosis at 7 T: a surface-based analysis. Neuroimage 2011; 57 (1): 55– 62. [DOI] [PMC free article] [PubMed] [Google Scholar]
- 45. Pitt D, Boster A, Pei W, et al. Imaging cortical lesions in multiple sclerosis with ultra-high-field magnetic resonance imaging. Arch Neurol 2010; 67 (7): 812– 818. [DOI] [PubMed] [Google Scholar]
- 46. Raichle ME, Mintun MA. Brain work and brain imaging. Annu Rev Neurosci 2006; 29: 449– 476. [DOI] [PubMed] [Google Scholar]
- 47. Wahl M, Hubers A, Lauterbach-Soon B, et al. Motor callosal disconnection in early relapsing-remitting multiple sclerosis. Hum Brain Mapp 2011; 32 (6): 846– 855. [DOI] [PMC free article] [PubMed] [Google Scholar]
- 48. Roosendaal SD, Schoonheim MM, Hulst HE, et al. Resting state networks change in clinically isolated syndrome. Brain 2010; 133 (pt 6): 1612– 1621. [DOI] [PubMed] [Google Scholar]
- 49. Rocca MA, Valsasina P, Absinta M, et al. Default-mode network dysfunction and cognitive impairment in progressive MS. Neurology 2010; 74 (16): 1252– 1259. [DOI] [PubMed] [Google Scholar]


