Abstract
In Part I of the paper, we demonstrated through simulation the potential of volumetric Short-lag Spatial Coherence (SLSC) imaging to improve visualization of hypoechoic targets in three dimensions. Here, we demonstrate the application of volumetric SLSC imaging in phantom and in vivo experiments using a clinical 3-D ultrasound scanner and matrix array. Using a custom single-channel acquisition tool, we collected partially beamformed channel data from the fully sampled matrix array at high speeds and created matched B-mode and SLSC volumes of a vessel phantom and in vivo liver vasculature. 2-D and 3-D images rendered from the SLSC volumes display reduced clutter and improved visibility of the vessels when compared to their B-mode counterparts. We use concurrently acquired color Doppler volumes to confirm the presence of the vessels of interest and to define the regions inside the vessels used in contrast and CNR calculations. SLSC volumes show higher CNR values than their matched B-mode volumes while the contrast values appear to be similar between the two imaging methods.
I. Introduction
High-speed volumetric ultrasound has a unique ability to provide real-time and non-invasive visualization of anatomy and pathology in three dimensions [1]. However, there are challenges associated with the small element size of typical 2-D arrays and the use of broad transmit beams that can lead to suboptimal image quality and decreased diagnostic utility of the modality. In particular, small 2-D array elements have relatively high impedance (compared to 1-D array elements) making them more susceptible to parasitic capacitance [2-5]. The small element size also limits the area over which an element can receive the signal compromising that element’s sensitivity to weak echoes in a noisy in vivo environment. System sensitivity is further reduced due to the use of broad transmit beams needed to achieve real-time frame rates [6].
In a companion paper [7], we extended the use of a recently developed beamforming method, short-lag spatial coherence (SLSC) imaging [8], to volumetric data in an attempt to improve image quality in clinical 3-D ultrasound. We presented a theoretical model for applying SLSC imaging to 2-D arrays as well as simulations showing that volumetric SLSC imaging improves lesion detectability compared to conventional 3-D delay-and-sum imaging [7]. Here, we demonstrate the feasibility of volumetric SLSC imaging in vivo on a modified commercial 3-D ultrasound system.
System architecture of most clinical ultrasound scanners makes implementation of advanced beamforming methods difficult. These systems provide limited programmability of transmit waveforms and lack access to the channel echo data. In addition, for the high element-count 2-D arrays for modern 3-D ultrasound systems, partial beamforming of the subaperture data is implemented in the handle of the array in order to limit losses in sensitivity (due to impedance mismatching or parasitic capacitance), as well as to reduce cable weights and system cost [3]. The resultant inability to access radio-frequency (RF) data for each element limits the realization of many techniques requiring custom transmit sequences or advanced aperture-domain signal processing, including phase aberration correction and adaptive beamforming. Such methods have seen limited or no usage on commercial real-time 3-D systems and are difficult to evaluate in off-line studies without access to individual channel data.
Noteworthy are several implementations of phase-aberration correction algorithms on clinical 3-D ultrasound scanners using single channel data of partially beamformed subapertures [9-12]. Ivancevich et al. [10] implemented multi-lag least-squares cross-correlation and speckle brightness algorithms and compared their performance in correcting for physical aberrators using a single sparsely-sampled 2-D array. For the speckle-brightness method, no off-line processing was used; the entire method was implemented using the scanner beamforming routines. Lindsey et al. [12] implemented a least-squares cross-correlation method on a pitch-catch setup in order to correct for phase aberration in 3-D transcranial ultrasound in vivo. Here, each matrix array was used as a correction source for the opposing array thus allowing estimation of multiple arrival time maps and reducing the error in aberration correction.
A companion paper explored the performance of the SLSC method on simulated volumetric data and showed that for small 2-D subapertures, partial beamforming within subapertures does not degrade the SLSC-image quality [7]. In the following, we demonstrate the concept of volumetric SLSC imaging using phantom and in vivo liver data from a commercial matrix array and 3-D ultrasound scanner. Utilizing the system’s large-scale parallel receive processing, we collected partially-beamformed channel data from the fully-sampled matrix array at high speeds and reconstructed matched B-mode and SLSC volumes of a vessel phantom and liver vasculature off-line. Contrast and CNR are computed for the vessels of interest using complete matched volumes to compare target visibility between the two beamforming methods. Concurrently acquired 3-D Doppler data is used as a gold standard for visualizing vasculature in three dimensions.
II. Methods
A. Short-Lag Spatial Coherence Imaging on Matrix Arrays
The spatial coherence of a backscattered ultrasonic wave is a measure of how similar the echo is at any two points in space. It can be predicted by the Van Cittert-Zernike (VCZ) theorem as the Fourier transform of the square of transmit beam amplitude if the imaging target is diffuse scatterers [13]. Spatial coherence can be expressed as spatial correlation and further simplified to a product of two triangle functions when the diffuse scatterers are insonified with a narrowband pulse from an unapodized rectangular aperture. The spatial correlation for this case (of diffuse scatterers) has been derived in Part I [7] and is given here again:
| (1) |
In 1, Δx and Δy denote the distance between two points in the aperture plane, and Dx and Dy denote the transmit aperture size in the x and y dimensions, respectively. The spatial correlation of the pressure field can be estimated from the signals of the individual elements of a matrix array as
| (2) |
where i and j are two elements on the 2-D aperture, si(n) and sj(n) are the signals sampled by those elements, n is a sample number in the time dimension, and the difference n2 – n1 represents the axial kernel length used to calculate interelement correlation and is typically on the order of a wavelength. Note that the signals si(n) and sj(n) in equation 2 are already delayed to achieve focusing at the desired location.
To create an SLSC volume, first, a region of short lags is defined on the 2-D aperture to include all element pairs whose signals would have a correlation coefficient above some value P for the theoretical case of diffuse scatterers. In other words, for every element i, a set of elements j is defined such that RDS(xi – xj, yi – xj) ≥ P , 0 < P < 1. Then, to obtain a single SLSC voxel, is computed (by applying equation 2 to the individual-element signals) and summed over all short-lag pairs of i and j. For a complete SLSC volume, the last step is repeated at each depth for every received individual-element data set [7].
To implement volumetric SLSC imaging on a clinical matrix array, we applied the above procedure on the partially-beamformed channel data as the signals from the individual elements were not accessible.
B. Rapid Single Channel Acquisition
Single channel data was acquired from a 4z1c matrix array (Siemens Medical Solutions USA, Inc.). This high-element-count 2-D array has both an azimuthal pitch and an elevational pitch of 0.4 mm. Array elements are grouped in rectangular subapertures that are beamformed in the handle of the transducer. In our previous implementations [14], each channel corresponded to a single array element. Herein, data from an individual channel refers to data beamformed within a rectangular subaperture. The array was connected to a modified Siemens Acuson SC2000 scanner (Siemens Medical Solutions USA, Inc., Mountain View, CA) that has a 64:1 parallel-receive capability; i.e. it can use the channel data from one transmit event to create up to 64 receive beams in parallel.
The complex data of the individual channels were collected using a full-synthetic receive sequence, similar to the one described by Dahl et al [14]. With this method, the full aperture is used for transmit, while the signal from a subset of individual channels is collected on receive. The same transmit event is repeatedly fired until the signals for each of the channels (i.e. beamformed subapertures) are collected. Integrating this approach with parallel receive beamforming on the scanner allows for multiple channels to be acquired at one time, thus reducing the number of transmits needed to acquire a complete channel-data-set.
For the experiments described herein, a 30:1 parallel receive configuration was used to collect the data for 180 channels (total of six transmit pulses per image line) at 2.5 volumes per second. 0.4 seconds was required to obtain a complete single channel data set needed to reconstruct a full (B-mode or SLSC) volume. The complex I/Q data collected for each channel was sampled at a rate of 2.5 MHz, which was sufficient to obtain high-resolution ultrasound images.
C. Flow Phantom Experiment
The individual-channel data needed to reconstruct complete B-mode and SLSC volumes was acquired on an ATS Laboratories model 523A Doppler phantom (ATS Laboratories, Bridgeport, CT) with a 4 mm vessel, using the sequences described in the section II-B. The data was acquired using a transmit frequency of 2.5 MHz and a transmit focus of 60 mm. The field of view spanned 38° in azimuth and 19.2° in elevation and was interrogated with 330 transmits that were fired sequentially to populate a 22 by 15 transmit-beam grid. The dense transmit-beam configuration was used to ensure that the spatial sampling was sufficient to reconstruct high-resolution B-mode and SLSC volumes.
A water-based corn-starch solution (10 g/l) was constantly flowing through the vessel while the phantom was scanned, and the conventional 3-D color Doppler volume was acquired concurrently with the individual channel data to be used as a gold standard for visualizing the vessel lumen. Because a default Doppler sequence was used on the scanner, the Doppler data was collected over a different field of view than the channel data. The Doppler field of view spanned 32° in azimuth and 26° in elevation and was sampled with 90 Doppler lines using a transmit frequency of 2.5 MHz. Doppler data was processed by the scanner before acquisition.
D. In Vivo Experiments
Individual-channel data was also collected in vivo on the liver vasculature of four human volunteers, ages 29 to 58. Written consent was obtained from all participants, and the study protocol was approved by the local Institutional Review Board. The same data acquisition sequences and imaging configuration were used as for the flow-phantom experiment (section II-C). Conventional 3-D color Doppler was used for guidance and targeting of blood vessels. Color Doppler volumes were acquired concurrently with the single-channel-acquisition sequence as a gold standard for visualizing the vasculature in the region of interest (ROI).
E. Data processing
From the single-channel data, matched B-mode and SLSC volumes were reconstructed off-line. SLSC volumes were reconstructed following the procedure outlined in section II-A (for a more detailed description of the reconstruction methods reader is referred to the Methods section of Part I [7]). Contrast and CNR values were computed for the vessels of interest for complete matched volumes according to the equations below:
| (3) |
| (4) |
In equations 3 and 4, Si and So are the mean signal magnitudes of the regions inside and outside of the vessel, respectively, and and are corresponding signal variances. The regions outside of the vessels were selected to have the same average speckle brightness as the vessel walls. The regions inside of the vessels were selected using a Doppler mask. To create the mask, a general region containing the vessel of interest in the Doppler volume was manually selected. The dynamic range of the Doppler signal within that region was then limited to remove the noise and obtain a clean and continuous mask of the vessel lumen. To minimize the spillage of Doppler signal (mask) outside of the vessel lumen, the cutoff value for amplitude was calibrated on the vessel-phantom with the known vessel diameter. The mask was then applied to the matched B-mode and SLSC volumes.
III. Results
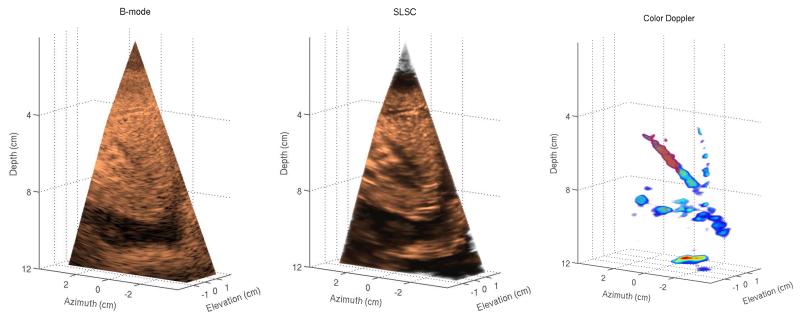
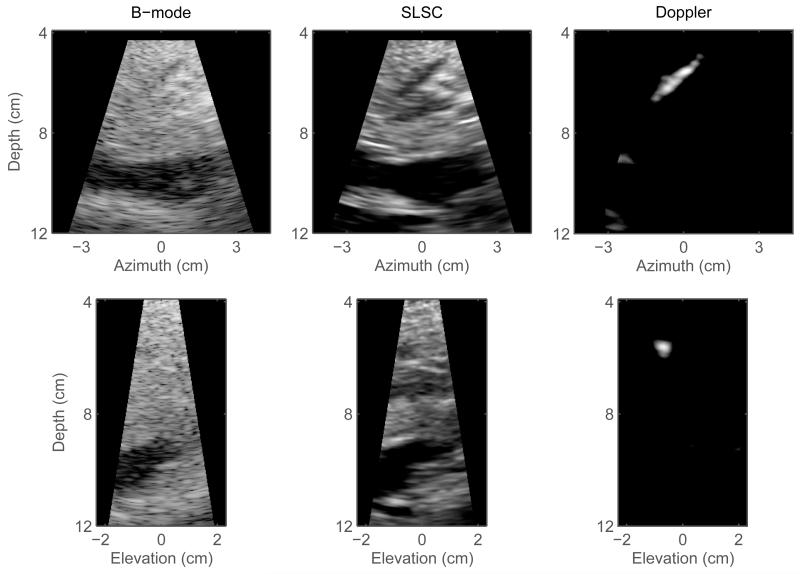
Examples of 2-D and 3-D images generated from matched B-mode, SLSC, and color-Doppler volumes are presented in the following figures. The B-mode images are displayed on the decibel scale with the dynamic range that allows for the clearest view of the vessels of interest for a given acquisition. The SLSC images are displayed using a linear color-map with a dynamic range that has been scaled to match the background brightness of the B-mode images. The Doppler images are also displayed using a linear map but with the dynamic range and transparency adjusted (independently of the B-mode and SLSC images) to show clear and continuous Doppler signal from the vessels of interest. The red contour lines in the 3-D Doppler images highlight the regions of the vessel lumen used to calculate contrast and CNR for the B-mode and SLSC volumes.
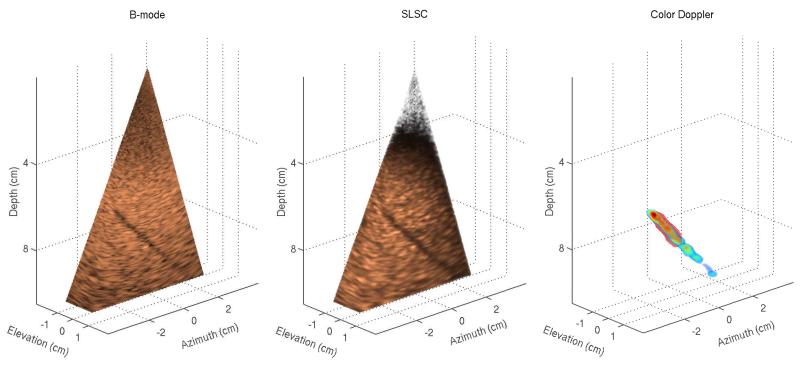
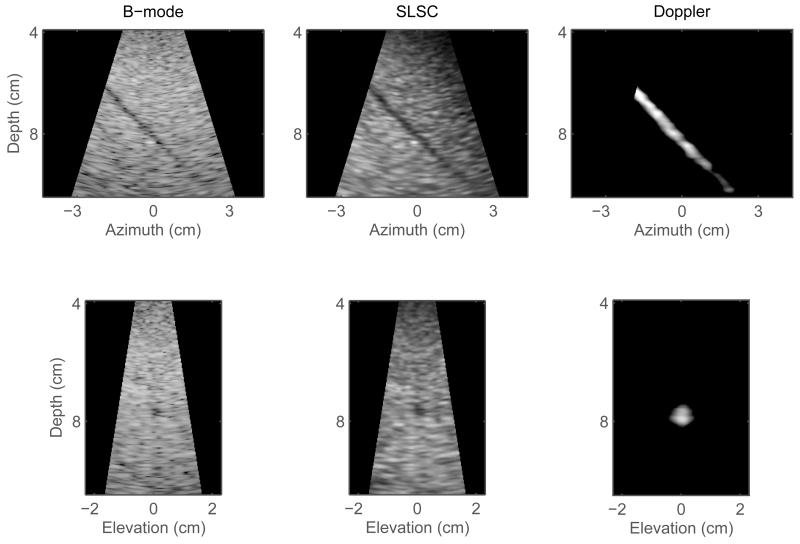
Figure 1 shows matched B-mode, SLSC, and color-Doppler volumes reconstructed from a phantom data set. For the 3-D B-mode and SLSC volumes, cutaway views are displayed (at 48° azimuth and 22° elevation angle) in order to expose a 4 mm vessel that spans the azimuth dimension of the volumes. Orthogonal slices of the volumes in Figure 1 are shown in Figure 2 and are selected to optimally display different cross-sections of the vessel. The vessel can be observed in all 2-D and 3-D images. The SLSC images demonstrate reduced acoustic noise inside the vessel lumen when compared to the corresponding B-mode images. The SLSC images also display reduced background brightness in the upper part of the field of view, which can be attributed to suppression of reverberant clutter in that region.1 Reverberant clutter appeared as parts of the aperture were not in full contact with the phantom due to the shape of the phantom and the scanning geometry employed to obtain optimal Doppler signal. The Doppler images show the vessel lumen fully populated by color-Doppler signal and the lumen boundaries can be clearly visualized. Using Doppler signal to select a 3-D region inside the blood vessel, the contrast and CNR values are calculated to be 2.27 dB and 0.34 for the B-mode volume, and 4.73 dB and 1.58 for the SLSC volume.
Fig. 1.
Left to right: B-mode, SLSC, and color-Doppler 3-D images generated from a phantom. The B-mode and SLSC images show only a part of the acquired field of view in order to expose a 4 mm vessel spanning the elevation dimension of the volumes. The SLSC image demonstrates improved visualization of the vessel cross-section compared to the matched B-mode image. The Doppler image confirms the extent of the vessel and shows clear and continuous color-Doppler signal at the location of the vessel lumen.
Fig. 2.
Orthogonal slices created from the volumes shown in Figure 1. Left to right: matched B-mode, SLSC, and color-Doppler slices in azimuth plane (top row) and elevation plane (bottom row). The SLSC slices display less clutter inside the vessel lumen and better delineation of the vessel walls than the corresponding B-mode slices. In the Doppler slices, the boundaries of the vessel lumen are clearly visualized.
Examples of matching B-mode, SLSC, and color-Doppler images of in vivo liver vasculature are shown in Figures 3,4,5, and 6. 2-D and 3-D images are created from two volumetric data-sets, both acquired from a 29 year old male volunteer, in the same general region of the liver, but at slightly different angles to demonstrate spatial stability of volumetric SLSC imaging. In order to make the vasculature fully visible in the 3-D B-mode and SLSC images, Figures 3 and 5 display cutaway views of the volume.
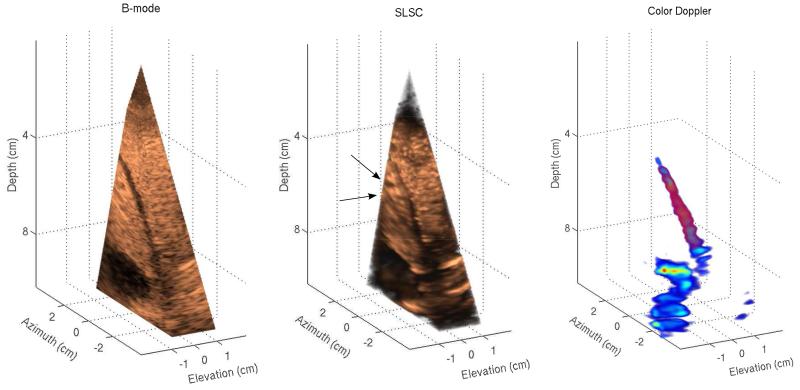
Fig. 3.
Left to right: B-mode, SLSC, and color-Doppler volumes of in vivo liver vasculature. B-mode and SLSC volumes display cutaway views of the acquired volume in order to show the full extent of vessels in three dimensions. A narrow vessel spanning 6 to 9 cm depth appears in both B-mode and SLSC volumes as well as a large vessel located at the lower part of the field of view. While the SLSC volume shows reduced acoustic noise inside of the vessels compared to the B-mode volume, parts of the narrow vessel in the SLSC volume are difficult to distinguish from the surrounding tissue. The SLSC volume also indicates the presence of two small vessels at 6 cm depth (denoted by black arrows) that do not appear in B-mode and color-Doppler volumes. These structures are more clearly visualized in the azimuth SLSC slice in Figure 4.
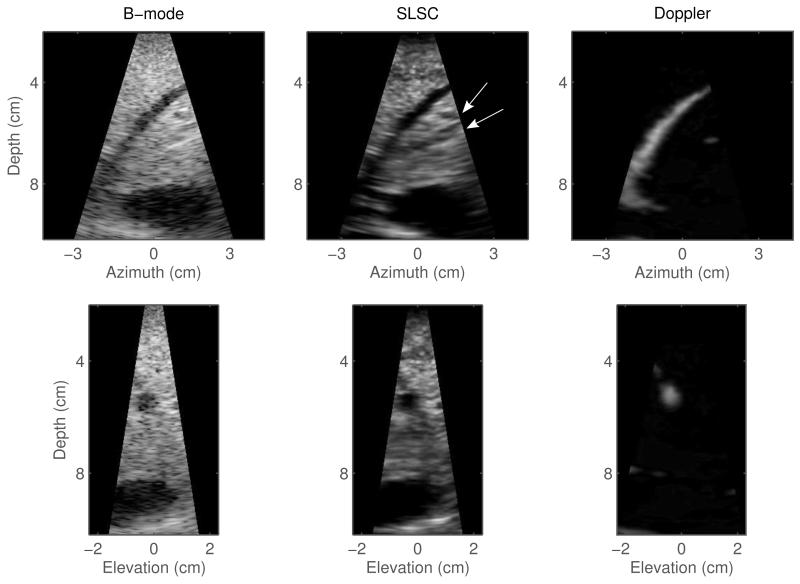
Fig. 4.
2-D scans created from the volumes shown in Figure 3. Left to right: matched B-mode, SLSC, and color Doppler scans in azimuth orientation (top row) and elevation orientation (bottom row). The SLSC images show improved visualization of the vessel cross-sections compared to the corresponding B-mode scans. In particular, cross-sections of two small vessels can be clearly observed at 6 cm depth in the azimuth SLSC slice (denoted by white arrows); these vessels are not well visualized in the corresponding B-mode image. The Doppler slices fail to confirm the presence of the small vessels but they outline the narrow vessel located at 4 to 8 cm depth.
Fig. 5.
Left to right: B-mode, SLSC, and color-Doppler volumes created from the second in vivo data-set. The 3-D images offer a different view of the same hepatic structures shown in Figures 3 and 4, but contain a significant amount of clutter. The 3-D SLSC image demonstrates reduced clutter and improved visualization of blood vessels compared to the matched B-mode image. Specifically, two narrow blood vessels spanning 6 to 8 cm depth cannot be visualized in the B-mode image, but the structures are clearly shown in the SLSC image. The shape and size of one of these vessels can also be seen in the 3-D Doppler image.
Fig. 6.
Orthogonal slices created from the volumes shown in Figure 5. Left to right: matched B-mode, SLSC, and color-Doppler slices in azimuth orientation (top row) and elevation orientation (bottom row). The azimuth and elevation slices indicate improved visualization of hepatic vasculature achieved by volumetric SLSC imaging compared to conventional 3-D B-mode. In particular, cross-sections of the narrow blood vessels located around 6 cm depth do not appear in the B-mode images but are clearly visible in their SLSC counterparts. The presence of one of these vessels is confirmed in the matching Doppler slices.
3-D and 2-D images created from the first in vivo acquisition are presented in Figures 3 and 4, respectively. In both the B-mode and SLSC volumes of Figure 3, a narrow vessel spanning 6 to 9 cm depth is observed as well as a large vessel in the lower part of the field of view. In the B-mode volume, the lumen of these vessels contains low level acoustic noise. In the SLSC volume, clutter inside the large vessel is suppressed and the surrounding tissue appears smoother. Part of the narrow vessel in the SLSC volume also shows reduced clutter, but the upper region of the vessel lumen is difficult to distinguish from the surrounding tissue; this is probably because of the 3-D rendering which makes the far wall of the vessel appear like clutter. 2-D SLSC slices in Figure 4 indeed show that the clutter in this part of the vessel vessel is suppressed. Using the Doppler signal to define the region inside of the narrow vessel, thecontrast is calculated to be 15.32 dB and 10 dB, and the CNR is calculated to be 1.6 and 2.3 for the B-mode and SLSC volumes, respectively. The signal from the large vessel has not been captured in the Doppler volume as the clinical system used to collect the data was designed primarily for cardiac application and had difficulties detecting slower hepatic flow. The SLSC volume also shows two potential small blood vessels (denoted by black arrows) that do not appear in the B-mode and Doppler volumes. These structures can be more clearly visualized in the azimuth SLSC slice in Figure 4.
Figure 4 shows azimuth and elevation (2-D) slices of the volumes displayed in Figure 3. Cross-sections of the same blood vessels that are observed in both B-mode and SLSC volumes are observed in the B-mode and SLSC slices, with SLSC slices showing reduced noise inside of the vessels and improved edge definition of the vessel walls. 2-D SLSC images also displaydetails that are not visible in their B-mode counterparts. As suggested, two potential small blood vessels are located at about 6 cm depth in the azimuth SLSC scan and are marked by white arrows for clarity. In the corresponding B-mode image, these strucutres are not visible due to high acoustic noise. The Doppler scans fail to confirm the presence of the small vessels but they do show the full extent of the narrow vessel located at 4 to 8 cm depth.
Matched B-mode, SLSC, and color-Doppler volumes of in vivo liver vasculature, reconstructed from the second sample acquisition, are displayed in Figure 5. The acquired field of view captures the same blood vessels shown in Figures 3 and 4, but in the presence of high acoustic noise. In the B-mode image, the noise obscures visibility of the vessels while in the SLSC image, the noise is suppressed and the vessels are clearly visualized. For example, two narrow vessels spanning between 6 and 8 cm depth are difficult to observe in the B-mode image, but are easy to detect in the SLSC image. The Doppler image conveys the full size and shape of one of these vessels but, for the reasons mentioned previously, it does not contain the signal from other vasculature that appears in the B-mode or SLSC images. The contrast and CNR are computed for the narrow vessel whose presence is confirmed in the Doppler image. The Doppler signal is used to define the region inside the vessel. The contrast is 7.91 dB and 8.90 dB and CNR is 1.01 and 1.51 for the B-mode and SLSC volumes, respectively.
Azimuth and elevation cross sections of the volumes in Figure 5 are shown in Figure 6. Both B-mode scans are of poor quality as the tissue structures are overwritten by acoustic noise. SLSC scans reduce noise and show improved visualization of the hepatic vasculature. Specifically, cross-sections of the narrow vessels located around 6 cm depth are difficult to detect in the B-mode images but are well observed in their SLSC counterparts. The presence of one of these vessels is confirmed in the matching Doppler scans.
Image quality metrics for B-mode and SLSC volumes in Figures 2 through 6 are summarized in Table I. In all examples, the SLSC volumes show higher CNR values than the matching B-mode volumes. In addition, the B-mode contrast values are in agreement with of our previous in vivo measurements of clutter magnitude in anechoic/hypoechoic regions (which range from about 25 dB to about 5 dB below the mean brightness of the surrounding tissue) [16].2 For the B-mode volumes created from the phantom and second in vivo acquisitions, clutter levels are high and the matching SLSC volumes demonstrate improvements in vessel contrast. For the first in vivo data-set, the B-mode volume yields higher contrast than the matched SLSC volume with contrast values being large (clutter being low) for both modalities.
TABLE I.
Image Quality Metrics for Sample Phantom and In Vivo Acquisitions.
| Acquisition | Phantom | 1st in vivo | 2nd in vivo | |||
|---|---|---|---|---|---|---|
| B-mode | SLSC | B-mode | SLSC | B-mode | SLSC | |
| Contrast (dB) | 2.27 | 4.73 | 15.32 | 10.00 | 7.91 | 8.90 |
| CNR | 0.34 | 1.58 | 1.60 | 2.30 | 1.01 | 1.51 |
IV. Discussion
Phantom and in vivo results demonstrate the feasibility of SLSC imaging on a commercial matrix array and 3-D ultrasound scanner. SLSC images of the vessel phantom (Figures 1 and 2) convey the extent of the vessel in three dimensions, without significant artifacts, and using the data from a single volumetric acquisition. The in vivo data-sets (acquired in the same general region of the liver) demonstrate the stability and consistency of SLSC imaging on a matrix array; the shape and size of the blood vessels look comparable between the two SLSC volumes despite different scanning orientation used at each acquisition (Figures 3 and 5). In all examples, the SLSC volumes are reconstructed from the partially beamformed data. Delaying-and-summing the signals with subapertures prior to constructing the spatial coherence curves provides averaging of the channel-noise and ensures that the coherence function is sufficiently sampled in both azimuth and elevation dimensions. The improvements in contrast and CNR achieved by this hybrid SLSC imaging technique are consistent with the results demonstrated from noisy and noise-free simulations [7].
Sample 2-D and 3-D images reconstructed from the SLSC volumes show improved visibility of the vessels when compared to their B-mode counterparts (Figures 1-6). The SLSC imaging on a matrix array integrates the coherence function strictly over the short-lag region (in both azimuth and elevation dimensions), thus leaving out the incoherent signals present in the long-lag region [7]. Via this mechanism, the SLSC imaging suppresses incoherent echoes (and thus clutter) inside the vessels that come from the off-axis scatterers or reverberation, which enhances definition of the vessel walls [8, 17]. In a B-mode volume, the echo amplitude is displayed instead of coherence, so the incoherent echoes tend to overwrite and obscure the structures of interest. The rate of acquisition of single channel data listed in section II-B and low echoegenecity of blood ensure that the observed improvements in vessel visualization in the SLSC images are not biased by the motion of blood/corn-starch solution inside of vessel during the acquisition.3
The liver tissue appears smoother and more uniform in the in vivo SLSC images than in the corresponding B-mode images (Figures 3-6). This smooth texture is not associated with the loss of resolution (or information in the image) but it is rather due to reduction in variance of SLSC pixels.4 We have demonstrated that the variance of the speckle brightness in the SLSC images is lower (than in the corresponding B-mode images) because the spatial-coherence function exhibits high uniformity (and thus low variance) in the region of short lags [20]. In addition, the hybrid SLSC imaging technique implemented on the clinical matrix array averages noise within the subapertures of the array (prior to computing the coherence curves), which further reduces the variance of SLSC speckle. As shown in the simulation results [7], subaperture averaging can effectively reduce speckle noise in the SLSC images even for small subaperture sizes.
Improvements in vessel visualization between B-mode and SLSC images are supported by contrast and CNR values computed for the complete B-mode and SLSC volumes (Table I). Observed CNR values are in agreement with the simulation results of the previous paper [7]. For example, the plots in Figure 10 (in part I of the manuscript) show that CNR of a −12 dB lesion in the presence of low and medium acoustic noise (up to element SNR of −20 dB) is between 2.8 and 3.0 for the SLSC volumes formed using 8 × 8 element subapertures; CNR values for the corresponding B-mode volumes are about 1.5. These values are comparable to CNR values obtained for the B-mode and SLSC volumes from the first in vivo acquisition (1.6 and 2.3, respectively). Further, CNR values obtained from the second in vivo acquisition (1.01 and 1.51 for the B-mode and SLSC volumes, respectively) are within the range of values shown in plots in Figure 10, part I, at high noise levels. In particular, at −20 dB element SNR, simulations predict CNR of a −12 dB lesion to be about 1.0 for B-mode and about 1.8 for hybrid SLSC imaging (implemented on 8 × 8 element subapertures).
The analysis presented in this paper faces several limitations. First, the data was collected using a phased matrix array which was designed primarily for cardiac imaging and had a relatively small aperture. With this setup, we were unable to create B-mode images that had high-resolution displays similar to those obtained with large linear arrays that are typically used in abdominal imaging. Second, the Doppler confirmation is lacking for some vessels in the in vivo acquisitions because the cardiac system used to collect the Doppler data was not calibrated to capture slower hepatic flow and acquisitions were not synchronized with the cardiac cycle (the latter causing significant discontinuities in the Doppler signal in the presence of pulsatile flow). Because contrast and CNR could be only computed for those vessels that were detected with Doppler, a more quantitative comparison between the corresponding B-mode and SLSC volumes could not be performed. Finally, visualizing the differences between the complete B-mode and SLSC volumes is limited due to the lack of an efficient way to display volumetric data. Nevertheless, the results indicate that the hybrid SLSC imaging technique as implemented on the clinical matrix array improves visualization of blood vessels in three-dimensions and they encourage its use for imaging other structures.
V. Conclusion
We have successfully demonstrated the concept of volumetric SLSC imaging on the clinical 3-D ultrasound scanner and matrix array. Through a series of phantom and in vivo liver experiments, we showed that 3-D and 2-D images generated from the SLSC volumes exhibit improved visualization of the vessels compared to their matched B-mode images. We used the color Doppler signal to confirm the presence of the vessels of interest and to define the 3-D regions used in contrast and CNR calculations. SLSC volumes yielded higher CNR values than the matched B-mode volumes while the contrast values were comparable between the two modalities. Our finding also showed that delaying-and-summing the signals with subapertures (of the 2-D array) prior to constructing the spatial coherence curves did not compromise the quality of SLSC images; this is in agreement with the simulation results of the companion paper. In the future, we hope to expand our single-channel-acquisition tool to matrix arrays with larger apertures thatare more suitable to abdominal imaging but also further improve data acquisition rates which would allow us to extend volumetric SLSC imaging to cardiac application.
Acknowledgments
This work is supported by the National Institute of Biomedical Imaging and Bioengineering through grants R01-EB015506 and R01-EB013661, and by the National Institutes of Health through grant R37-HL096023. The authors wish to thank the Ultrasound Division at Siemens Medical Solutions USA, Inc. for their in-kind and technical support. The authors would also like to thank Dr. Mark Palmeri and Dr. Brooks Lindsey for their useful insights as well as to Stephen Rosenzweig and Dr. Michael Wang for their help on the development of the data acquisition tool.
Footnotes
We previously showed [8] that the coherence curves for diffuse targets exhibit lower values in the presence of acoustic noise resulting in darker SLSC pixels/voxels. This is in contrast to B-mode images where average speckle brightness is proportional to signal variance [15] and the regions of diffuse scatterers can appear bright in the presence of clutter.
In [16], the magnitude of clutter was measured at different points inside of anechoic/hypoechoic regions in units of dB relative to the mean brightness of the surrounding tissue. Assuming the echogenicity of blood is significantly lower than the echogenicity of the surrounding tissue, vessel contrast can be used to approximate mean clutter magnitude inside of the vessel.
Given the data acquisition rates presented in section II-B the estimated motion of blood/corn-starch solution during the acquisition of a single imaging line was 0.1 - 0.2 mm, which was unlikely to result in a substantial decorrelation of the echoes from the moving scatterers across the aperture [18]. In addition, due to low echogenecity of blood compared to the surrounding tissue (up −30 dB [19]), contribution of these echoes to the signal received from the vessel lumen is very small compared to the off-axis scattering and reverberation from the surrounding medium. Any fluctuation in correlation of these weak echoes alone would therefore not be sufficient to cause a significant change in vessel visualization. Finally, with the single channel acquisition sequence described in section II-B data is collected on 30 channels simultaneously, which means that for majority of channels comprising the region of short lags there is no decorrelation of signal due to flow. The last statement would hold true even for the cases of high flow and high echoegenecity of scatterers inside of vessel.
Our previous measurements of resolution in the SLSC images (defined as width of a point target or distance between two point targets), indicate that it is highly dependent on the level of noise and that it is not directly related to the texture size.
References
- [1].Fenster A, Downey DB, Cardinal HN. Three-dimensional ultrasound imaging. Phys Med Biol. 2001;46:R67–R99. doi: 10.1088/0031-9155/46/5/201. [DOI] [PubMed] [Google Scholar]
- [2].Goldberg RL, Smith SW. Multilayer piezoelectric ceramics for two-dimensional array transducers. IEEE Trans Ultrason Ferroelect Freq Contr. 1994;41(5):761–771. doi: 10.1109/58.308512. [DOI] [PubMed] [Google Scholar]
- [3].Lu XM. Comprehensive design considerations for 2d matrix arays; Proc IEEE Ultrason Symp; 2008.pp. 1134–1137. [Google Scholar]
- [4].Smith SW, Trahey GE, von Ramm OT. Two-dimensional arrays for medical ultrasound. Ultrasonic Imaging. 1992;14(3):213–233. doi: 10.1177/016173469201400301. [DOI] [PubMed] [Google Scholar]
- [5].Savord B, Solomon R. Fully sampled matrix transducer for real time 3D ultrasonic imaging; Proc IEEE Ultrason Symp; 2003.pp. 945–953. [Google Scholar]
- [6].von Ramm OT, Smith SW, Pavy HG., Jr. High-speed ultrasound volumetric imaging system - part II: Parallel processing and image display. IEEE Trans Ultrason Ferroelect Freq Contr. 1991;38(2):109–115. doi: 10.1109/58.68467. [DOI] [PubMed] [Google Scholar]
- [7].Hyun D, Trahey GE, Jakovljevic M, Dahl JJ. Short-lag spatial coherence imaging on matrix arrays part I: Beamforming methods and simulation study. 2013 doi: 10.1109/TUFFC.2014.3010. submitted for review to UFFC. [DOI] [PMC free article] [PubMed] [Google Scholar]
- [8].Lediju M, Byram BC, Trahey GE, Dahl JJ. Short-lag spatial coherence of backscattered echoes: Imaging characteristics. IEEE Trans Ultrason Ferroelect Freq Contr. 2011;58(7):1377–1388. doi: 10.1109/TUFFC.2011.1957. [DOI] [PMC free article] [PubMed] [Google Scholar]
- [9].Ivancevich N, Dahl JJ, Trahey GE, Smith SW. Phase-aberration correction with a 3D ultrasound scanner: Feasibility study. IEEE Trans Ultrason Ferroelect Freq Contr. 2006;53(8):1432–1439. doi: 10.1109/tuffc.2006.1665100. [DOI] [PubMed] [Google Scholar]
- [10].Ivancevich N, Dahl JJ, Smith SW. Comparison of 3-D multi-lag cross-correlation and speckle brightness aberration correction algorithms on static and moving targets. IEEE Trans Ultrason Ferroelect Freq Contr. 2009;56(10):2157–2166. doi: 10.1109/TUFFC.2009.1298. [DOI] [PMC free article] [PubMed] [Google Scholar]
- [11].Ivancevich N, Pinton GF, Nicoletto HA, Bennett E, Laskowitz DT, Smith SW. Real-time 3-D contrast-enhanced transcranial ultrasound and aberration correction. Ultrasound Med Biol. 2008;34(9):1387–1395. doi: 10.1016/j.ultrasmedbio.2008.01.015. [DOI] [PMC free article] [PubMed] [Google Scholar]
- [12].Lindsey BD, Smith SW. Pitch-catch phase aberration correction of multiple isoplanatic patches for 3-D transcranial ultrasound imaging. IEEE Trans Ultrason Ferroelect Freq Contr. 2013;60(3):463–480. doi: 10.1109/TUFFC.2013.2590. [DOI] [PMC free article] [PubMed] [Google Scholar]
- [13].Mallart R, Fink M. The van Cittert-Zernike theorem in pulse echo measurements. J Acoust Soc Am. 1991;90(5):2718–2727. [Google Scholar]
- [14].Dahl JJ, Soo MS, Trahey GE. Spatial and temporal aberrator stability for real-time adaptive imaging. IEEE Trans Ultrason Ferroelect Freq Contr. 2005;52(9):1504–1517. doi: 10.1109/tuffc.2005.1516023. [DOI] [PubMed] [Google Scholar]
- [15].Wagner RF, Smith SW, Sandrik JM, Lopez H. Statistics of speckle in ultrasound b-scans. IEEE Trans Sonics Ultrason. 1983;30(3):156–163. [Google Scholar]
- [16].Lediju M, Pihl MJ, Dahl JJ, Trahey GE. Quantitative assessment of the magnitude, impact, and spatial extent of ultrasonic clutter. Ultrasonic Imaging. 2008;30(3):151–168. doi: 10.1177/016173460803000302. [DOI] [PMC free article] [PubMed] [Google Scholar]
- [17].Dahl JJ, Hyun D, Lediju M, Trahey GE. Lesion detectability in diagnostic ultrasound with short-lag spatial coherence imaging. Ultrasonic Imaging. 2011;33:119–133. doi: 10.1177/016173461103300203. [DOI] [PMC free article] [PubMed] [Google Scholar]
- [18].Trahey GE, Hubbard SM, Ramm OTV. Angle independent ultrasonic blood flow detection by frame-to-frame correlation of b-mode images. Ultrasonic Imaging. 1988;26(5):271–276. doi: 10.1016/0041-624x(88)90016-9. [DOI] [PubMed] [Google Scholar]
- [19].Cobbold RSC. Foundations of biomedical ultrasound. Oxford University Press; New York: 2007. [Google Scholar]
- [20].Walker WF, Trahey GE. Speckle coherence and implications for adaptive imaging. J Acoust Soc Am. 1997;101(4):1847–1858. doi: 10.1121/1.418235. [DOI] [PubMed] [Google Scholar]


