

Abstract
Aims/Introduction
Sphingosine-1-phosphate (S1P), a multifunctional bioactive lipid mediator, is involved in various diseases. Apolipoprotein M (ApoM) carries S1P on high-density lipoprotein and modulates S1P metabolism to increase the total S1P mass in the body. Both S1P and ApoM are involved in diabetes.
Materials and Methods
The present study examined the modulation of S1P and ApoM levels in the plasma, liver and kidneys in streptozotocin-induced diabetes (STZ) mice, and the effects of insulin on the S1P and ApoM levels in the plasma and liver in STZ mice and normal mice. We also examined the effects of insulin and glucose on the ApoM levels in HepG2 cells.
Results
In STZ mice, both the plasma S1P and ApoM levels were higher than those in control mice. The hepatic S1P and ApoM contents were also elevated. The hepatic S1P and ApoM contents were reduced by insulin treatment, whereas high-dose insulin decreased the plasma S1P and ApoM levels. In mice without streptozotocin treatment, the administration of insulin decreased the plasma S1P and ApoM levels, and the hepatic content of ApoM, whereas the hepatic level of S1P was not altered. Treatment with insulin and incubation under a low glucose level decreased the ApoM levels in HepG2 cells. Regarding the kidney, the renal levels of S1P and ApoM were increased in STZ mice, and insulin treatment partially restored this increment.
Conclusions
In STZ mice, the levels of S1P and ApoM in the plasma, liver, and kidneys were increased. Insulin treatment somehow reversed this modulation in STZ mice.
Keywords: Apolipoprotein M, Sphingosine-1-phosphate, Streptozotocin-induced diabetes mice
Introduction
The prevalence of diabetes is now increasing worldwide. β-Cell death and insufficient β-cell function are the pathogenetic causes of type 1 and type 2 diabetes, respectively1–3. The physiological regulators of β-cell function, however, have not yet been completely elucidated.
Sphingosine-1-phosphate (S1P), a bioactive lipid mediator, is known to be involved in various diseases, such as cardiovascular diseases, cancers and congenital disorders4,5. Among these diseases, the involvement of S1P in diabetes, especially β-cell function, has been proposed based on in vitro experiments. For example, sphingosine kinase (SphK), a limiting enzyme for S1P synthesis, reportedly has significant roles in both β-cell function and survival6–8. Therefore, S1P might be deeply involved in the pathogenesis of diabetes.
Regarding the modulation of S1P metabolism in a diabetic state, diabetes reportedly influences the plasma S1P level and the S1P contents in several tissues; the plasma S1P level was higher in streptozotocin-induced diabetic rats and Akita mice, whereas the S1P content in the heart of Ins2Akita mice was also increased9. Furthermore, insulin treatment restored the elevated S1P level in Akita mice9, suggesting that insulin plays an important role in controlling the S1P level, although the underlying mechanism has not yet been elucidated.
Regarding the dynamics of S1P, approximately 65% of circulating S1P is carried on apolipoprotein M (ApoM)10. ApoM is one of the apolipoproteins riding on high-density lipoprotein, and its expression is confined to the liver and kidneys11. We recently showed that ApoM is not a mere carrier of S1P, but a potent modulator of S1P in both the plasma and liver, with ApoM increasing S1P, at least in part, by retarding the degradation of S1P12. Despite this crucial influence on S1P, the ApoM levels were reported to be relatively low in some diabetes animals; in alloxan-induced diabetic mice, in which the glucose levels are elevated as a result of the impairment of β-cell function by alloxan, the plasma ApoM level and the messenger ribonucleic acid levels of ApoM in the liver and kidney were reduced, but were partially restored by insulin treatment13.
This disagreement between the modulation of S1P and ApoM in diabetic mice suggests that a link between S1P and ApoM might not exist in diabetic mice; however, no study has measured the S1P and ApoM levels simultaneously or even in the same animal models. Furthermore, in contrast to the results of animal experiments, ApoM expression was reportedly reduced by treatment with insulin in HepG2 cells14. Considering the important roles of S1P in the biology of β-cells, the elucidation of the modulation of ApoM and S1P levels in an insulin-insufficient state is an important task from the aspect of the possible cross-talk between β-cells and the liver, which is the major source of circulating ApoM.
In the present study, we investigated the modulation of S1P and ApoM levels in the plasma, liver, and kidney of STZ mice simultaneously to elucidate whether the modulation of ApoM might be correlated with the dynamics of S1P in diabetic mice.
Materials and Methods
Animal Experiments
C57BL/6 mice were purchased from CLEA Japan (Tokyo, Japan). Ten-week-old male C57BL/6 mice were intraperitoneally injected with streptozotocin (150 mg/kg bodyweight), whereas control mice were injected with the same amount of saline. On the third day, the blood glucose levels under ad libitum feeding were measured, and mice with blood glucose levels of over 300 mg/dL were deemed as streptozotocin mice (STZ). Eight weeks after the administration, the mice were subjected to 6-h fast, and a plasma sample was collected from the postorbicullar capillary; liver and kidney samples were obtained after perfusion with ice-chilled phosphate-buffered saline (PBS) through a needle inserted into the left ventricle. The basic characteristics of the STZ and control mice are described in Table1.
Table 1.
Characteristics of mice analyzed
| Vehicle | STZ group 1‡ | STZ group 2‡ | |
|---|---|---|---|
| FBG (mg/dL) | 155.6 ± 12.2 | 541.0 ± 10.9‡ | 533.8 ± 20.4‡ |
| BW (g) | 31.4 ± 0.9 | 22.5 ± 0.7‡ | 21.9 ± 1.6‡ |
| Liver weight (g) | 1.59 ± 0.05 | 1.68 ± 0.02 | 1.54 ± 0.09 |
| EP fat weight (g) | 0.88 ± 0.08 | 0.09 ± 0.02‡ | 0.06 ± 0.02‡ |
P < 0.01 vs vehicle;
Streptozotocin-induced diabetes (STZ) group 1 was subjected to analyses with the vehicle, while STZ group 2 was injected with insulin (Humulin R at a dose of 0.75 U/kg of bodyweight); the analyses were carried out 2 h later. BW, bodyweight; EP, epididymal; FBG, fasting blood glucose.
To investigate the effects of insulin on the S1P and ApoM levels in STZ mice, STZ mice (STZ mice [group 2] in Table1) were injected intraperitoneally with Humulin R (Ely Lilly, Indianapolis, IN, USA) at a dose of 0.75 IU/kg bodyweight. To investigate the effects of various doses and types of insulin, 12-week-old male STZ mice prepared as aforementioned were injected intraperitoneally with Humulin R at a dose of 2 IU/kg bodyweight, or injected subcutaneously with Humulin N (Ely Lilly) at a dose of 80 IU/kg bodyweight. Plasma samples were then collected at 2 and 16 h after the insulin administration. To investigate the effects of insulin and glucose in mice without STZ treatment, 11-week-old male mice were treated with 0.5 IU/kg bodyweight of Humulin R, 2 g/kg bodyweight of glucose, or PBS (as a control). Plasma samples were collected before injection, and plasma, liver and kidney samples were collected at 2 h after injection. To investigate the effects of insulin in ApoM-overexpressing mice, we infected 10-week-old male mice with human ApoM-coding adenovirus through the tail vein at a dose of 2.5 × 10⁸ pfu/g of bodyweight, as described previously12, then on the fifth day, the effects of insulin on the plasma S1P levels were examined with 0.5 IU/kg bodyweight of Humulin R, as aforementioned. All the animal experiments were carried out in accordance with the guidelines for animal care at the Graduate School of Medicine, The University of Tokyo, Tokyo, Japan, and were approved by the animal committee of the University of Tokyo.
Cell Experiments
HepG2 cells were obtained from American Type Culture Collection (Manassas, VA, USA). The cells were cultured in Dulbecco's modified Eagle's medium (DMEM; Sigma-Aldrich Co., St. Louis, MO, USA) supplemented with 10% fetal bovine serum (FBS; Gibco BRL, Eggstein, Germany) and 1% penicillin/streptomycin (Gibco BRL). At approximately 70% confluence, the cells were washed twice with PBS and replaced for FBS-free DMEM containing various doses of glucose and human insulin solution (Sigma-Aldrich Co.), and after 8 h the media and cellular components were collected.
Sphingosine Kinase Activity Assay
We measured the sphingosine kinase (SphK) activity levels as described previously15, with some modification. We homogenized liver tissues in 20 mmol/L Tris-HCl (pH 7.4), 20% glycerol, 1 μmol/L β-mercaptoethanol, 15 mmol/L NaF, 1 mmol/L ethylenediaminetetraacetic acid, 1 mmol/L Na3VO4, 1 mmol/L phenylmethyl sulfonyl fluoride and protease inhibitor cocktail (Roche, Mannheim, Germany). The reaction was initiated by adding 25 mL of 200 mmol/L C17-sphingosine (C17-Sph; Avanti Polar Lipids, Alabaster, AL, USA) and 25 μL of 20 mmol/L adenosine triphosphate (Sigma Aldrich Co.) to 300 mg of protein in a final volume of 500 μL. After incubation at 37°C for 20 min, we terminated the reaction by adding 50 μL of 1 mol/L HCl and 3 mL of methanol and chloroform (v/v 2:1). Then, the C17-S1P levels were measured as described later.
Measurement of S1P, Dihydrosphingosine-1-Phosphate and C17-S1P
The contents of S1P and dihydrosphingosine-1-phosphate (dhS1P) in the plasma, liver and kidneys were determined using two-step lipid extraction followed by high-performance liquid chromatography separation, as described previously16. Briefly, samples were sonicated in 3 mL of methanol/chloroform (2:1) with an internal standard for 30 min. After adding 2 mL of chloroform, 2.1 mL of 1 mmol/L KCl, and 100 μL of 3 N NaOH, the samples were centrifuged and the alkaline upper phase (3.8 mL) was collected into new tubes, to which 4 mL of chloroform and 200 μL of concentrated HCl were added. The resultant lower chloroform phases (3.5 mL) that were formed under these new acidic conditions were collected and evaporated under nitrogen gas, and resolved in methanol, followed by high-performance liquid chromatography separation using a TSKgel ODS-80TM column (Tosoh, Tokyo, Japan). For the measurement of the S1P contents, we used C17-S1P (Avanti Polar Lipids) as an internal standard, whereas for the C17-S1P contents, we used FTY720(S)-phosphate (Cayman Chemical, Ann Arbor, MI, USA).
Western Blotting
Liver and kidney proteins were extracted using radioimmunoprecipitation assay lysis buffer (25 mmol/L Tris HCL [pH 7.6], 1% NP-40, 0.1% sodium dodecylsulfate, 150 mmol/L NaCl, 0.02% sodium deoxycholate, 1 mmol/L orthovanadate, 1 mmol/L phenylmethyl sulfonyl fluoride and protease inhibitor cocktail [Roche]). Western blotting was carried out with 30 μg of the liver, kidney or cellular proteins using a standard method. For the plasma analysis, a volume corresponding to 0.5 μL of plasma was subjected to the western blotting analysis. When western blotting was carried out for the analysis of the proteins in the media, the amount of medium applied was adjusted by the cellular protein level. The following antibodies were used: anti-mouse ApoM antibody (GenScript Co, Piskataway, NJ, USA), anti-human ApoM serum (developed in a previously reported paper12) and anti-β-actin antibody (MBL, Nagoya, Japan).
Statistical Analysis
The results are expressed as the mean ± SEM. Differences between two independent groups were evaluated using the Student's t-test, and differences among more than two independent groups were assessed using a one-way anova, followed by multiple comparison tests. The differences in the means between before and after treatment with reagents within a given group were assessed by paired t-test. P-values <0.05 were deemed statistically significant.
Results
Plasma and Liver S1P Levels Increased in STZ Mice
To investigate the modulation of the S1P level in STZ mice, we measured the S1P levels in plasma and liver samples from STZ mice. In agreement with a previous paper9, the plasma S1P level was significantly elevated in STZ mice (Figure1a). In our experiment, the plasma dhS1P concentration was also higher (Figure1a). Because insulin secretion from β-cells was disturbed in STZ mice, we investigated the effects of insulin on the plasma S1P level. The changes in the blood glucose level before and at 2 h after administration are shown in Figure1b. With insulin treatment at a dose of 0.75 IU/kg bodyweight, we found that no modulation was observed (Figure1c). Regarding the modulation of the liver S1P content, the content was remarkably increased in STZ mice and tended to be decreased by insulin treatment (Figure1d).
Figure 1.
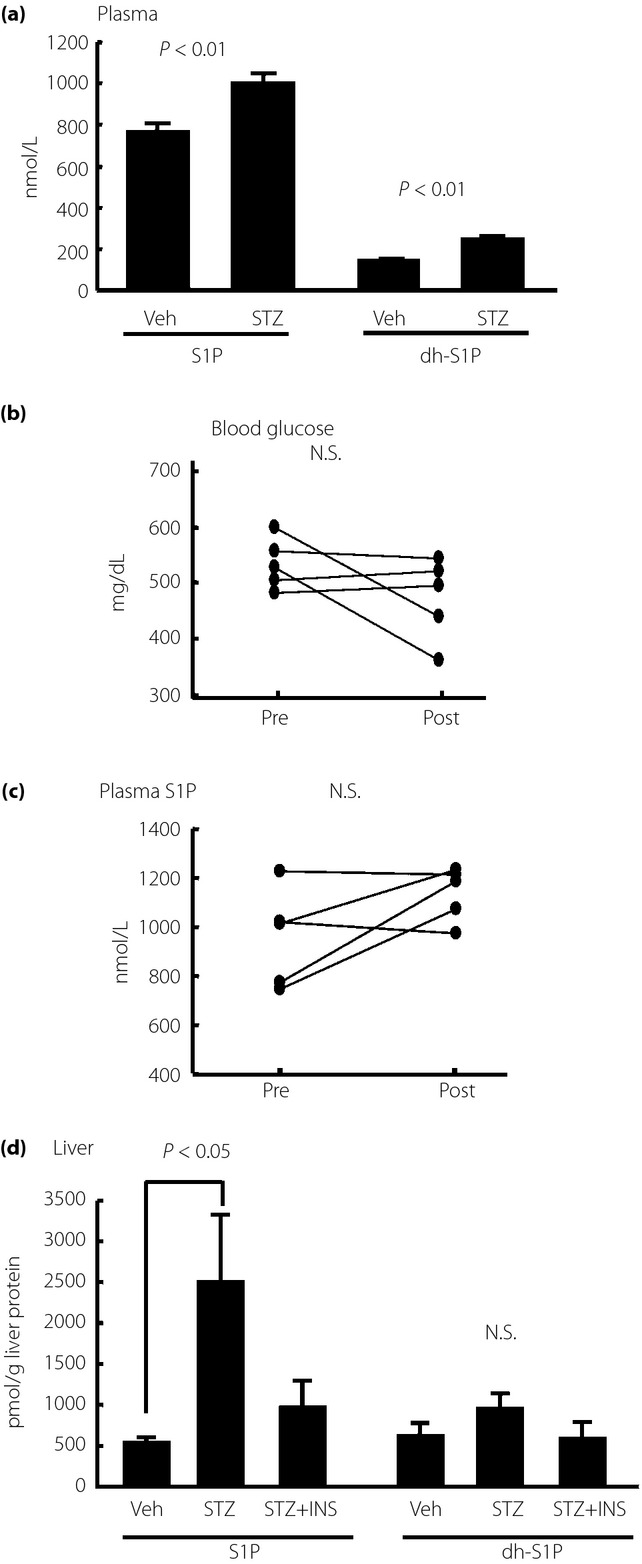
Modulation of plasma and hepatic sphingosine-1-phosphate (S1P) level in streptozotocin-induced diabetes (STZ) mice. Fourteen-week-old STZ mice or control mice were analyzed after they were subjected to a 6-h fast (n = 5/each group). To investigate the effects of insulin (INS), we administered Humulin R at a dose of 0.75 IU/kg bodyweight; plasma samples were collected before and at 2 h after injection (n = 5). (a) Plasma S1P and dihydrosphingosine (dh)S1P levels in STZ mice. (b) Blood glucose and (c) plasma S1P levels before and at 2 h after insulin administration. (d) Liver S1P and dhS1P levels adjusted according to the liver protein level. N.S., not significant; Veh, vehicle.
Plasma and Liver ApoM Levels Increased in STZ Mice
Next, we investigated whether the ApoM level was modulated in STZ mice. Contrary to a previous report describing alloxan-induced diabetic mice13, the plasma ApoM level was higher in the STZ mice (Figure2a), while the hepatic ApoM level was also elevated (Figure2c). Although insulin treatment did not restore the increased plasma ApoM level significantly (Figure2b), the hepatic ApoM content was decreased with insulin treatment (Figure2c). We also measured the activity of SphK in the liver, and found that SphK activity was almost unchanged in the STZ mice or by insulin treatment (Figure2d).
Figure 2.
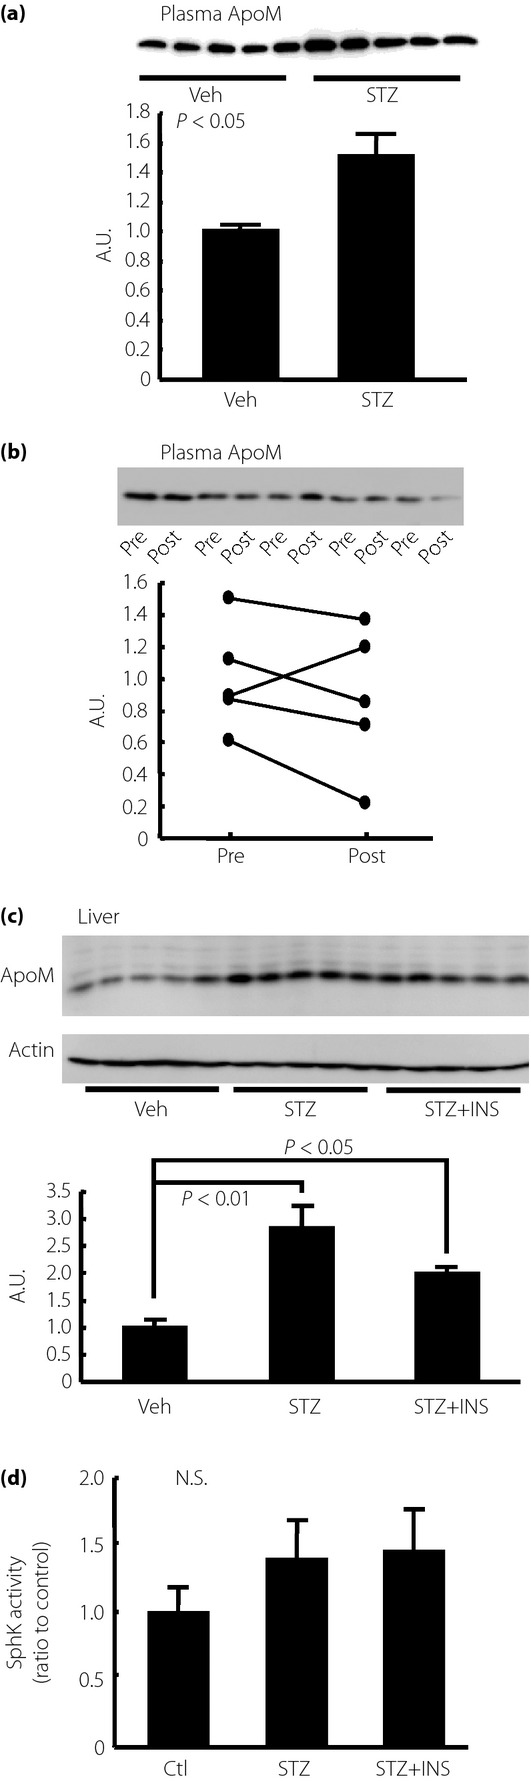
Modulation of plasma and hepatic apolipoprotein M (ApoM) level in streptozotocin-induced diabetes (STZ) mice. Fourteen-week-old STZ mice or control (Ctl) mice were analyzed after they were subjected to a 6-h fast (n = 5/each group). To investigate the effects of insulin (INS), we administered Humulin R at a dose of 0.75 IU/kg bodyweight; plasma samples were collected before and at 2 h after injection (n = 5). (a) Plasma ApoM level and (b) plasma ApoM level before and at 2 h after insulin administration. (c) Liver ApoM level adjusted to the β-actin level. (d) Sphingosine kinase (SphK) activity in the liver. Veh, vehicle; Ctl, control.
Insulin Treatment at a High Dose Decreased Plasma S1P and ApoM Levels in STZ Mice
As treatment with Humulin R at a dose of 0.75 IU/kg bodyweight did not significantly decrease the blood glucose levels, we next treated STZ mice intraperitoneally with Humulin R at a dose of 2 IU/kg bodyweight, or injected subcutaneously with Humulin N at a dose of 80 IU/kg bodyweight. As shown in Figure3, although Humulin R at a dose of 2 IU/kg bodyweight did not decrease the plasma S1P or ApoM levels (Figure3b,c), Humulin N at a dose of 80 IU/kg bodyweight significantly decreased both the plasma S1P and ApoM levels (Figure3e,f), maybe because only Humulin N at 80 IU/kg bodyweight decreased blood glucose sufficiently (Figure3d).
Figure 3.
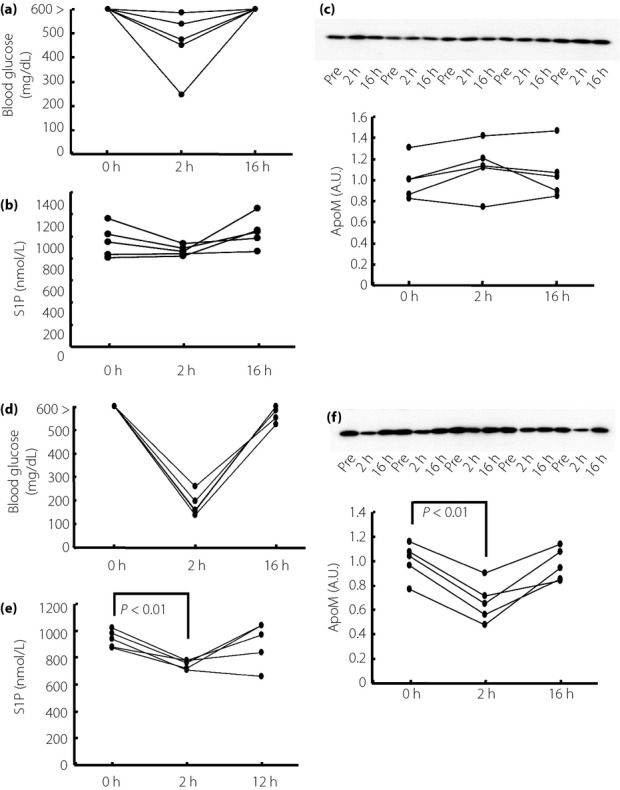
Treatment with insulin at a high dose decreased plasma sphingosine-1-phosphate (S1P) and apolipoprotein M (ApoM) levels in streptozotocin-induced diabetes (STZ) mice. Twelve-week-old STZ mice were treated with Humulin R (2 IU/kg of bodyweight) or Humulin N (80 IU/kg of bodyweight; n = 5/group). Before and at 2 and 16 h after the administration, the plasma samples were collected and used to measure the S1P and ApoM levels. (a,d) Changes in the blood glucose level, (b,e) changes in the plasma S1P level and (c,f) changes in the plasma ApoM level. A.U., arbitrary unit.
Plasma ApoM Level was Decreased by Insulin Administration in Normal Mice
We have shown, so far, that both S1P and ApoM levels in the plasma and liver were elevated in STZ mice; however, insulin supplementation only restored the elevated S1P and ApoM levels in the plasma when we treated STZ mice with a rather high dose of insulin. To reconfirm the effects of insulin on the plasma S1P and ApoM levels, we next investigated whether insulin treatment might modulate the S1P and ApoM levels in mice with normal blood glucose levels. We also investigated the effects of glucose on the S1P and ApoM levels, as the ApoM level is reportedly decreased under high glucose conditions in vitro14. The changes in the blood glucose levels are shown in Figure4a–c. As shown in Figure4d–f, the plasma S1P level was reduced significantly by the administration of glucose and the administration of insulin, with the decrease in the insulin-treated group being more apparent. The plasma ApoM level was reduced significantly only in the insulin-treated group (Figure4g–i). The hepatic ApoM content was also decreased in the insulin-treated group, although the hepatic S1P content was not altered (Figure5a,b).
Figure 4.
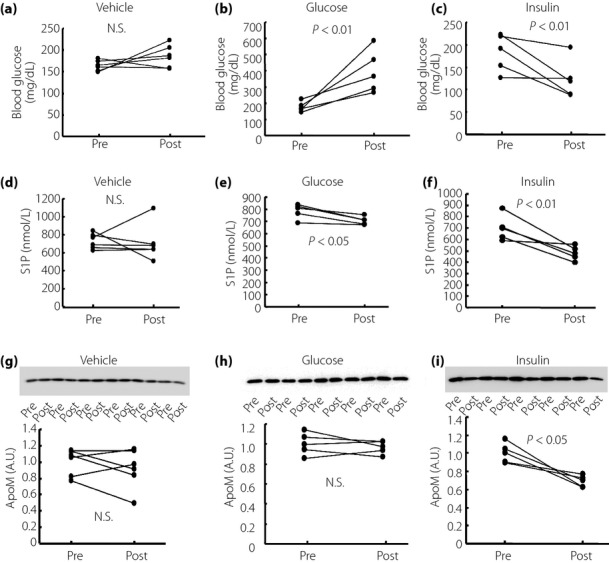
The effects of insulin and glucose on plasma sphingosine-1-phosphate (S1P) and apolipoprotein M (ApoM) levels in normal mice. Ten-week-old normal mice were treated with Humulin R (0.5 IU/kg of bodyweight), glucose (2 g/kg of bodyweight) or phosphate-buffered saline (n = 5–6/group). Before and at 2 h after the administration, the plasma and liver samples were collected and used to measure the S1P and ApoM levels. (a–c) Changes in the blood glucose level, (d–f) changes in the plasma S1P level and (g–i) changes in the plasma ApoM level. A.U., arbitrary unit; N.S., not significant.
Figure 5.
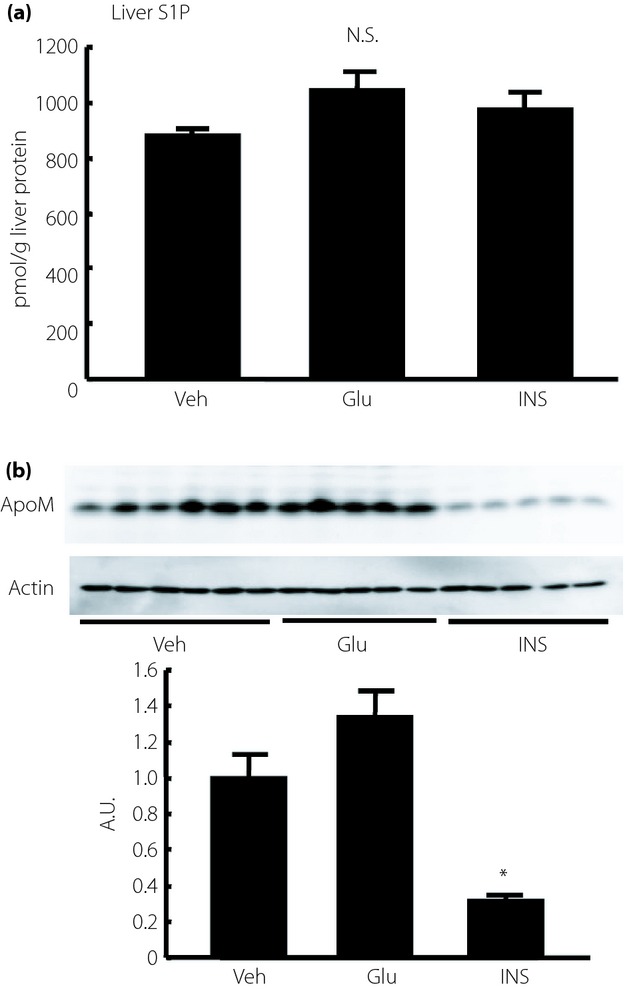
The effects of insulin (INS) and glucose (GLU) on liver sphingosine-1-phosphate (S1P) and apolipoprotein M (ApoM) levels in normal mice. Ten-week-old normal mice were treated with Humulin R (0.5 IU/kg of bodyweight), glucose (2 g/kg of bodyweight) or phosphate-buffered saline (n = 5–6/group). Before and at 2 h after the administration, the plasma and liver samples were collected and used to measure the S1P and ApoM levels. (a) Liver S1P level adjusted according to the liver protein level, and (b) liver ApoM level adjusted according to the β-actin level. *P < 0.01 vs the other groups. A.U., arbitrary unit; N.S., not significant; Veh, vehicle.
Insulin Treatment Did Not Decrease Plasma S1P Levels in ApoM-Overexpressing Mice
To further investigate the role of ApoM in the modulation of S1P by insulin, we used mice overexpressing ApoM by exogenous adenovirus gene transfer (Figure6a,b). Although insulin treatment with 0.5 IU/kg bodyweight of Humulin R decreased the blood glucose levels significantly, insulin did not decrease the plasma S1P levels (Figure6c–e). These results suggest that the modulation by insulin of the plasma S1P levels can be observed under the changes of the plasma ApoM levels within the physiological range.
Figure 6.
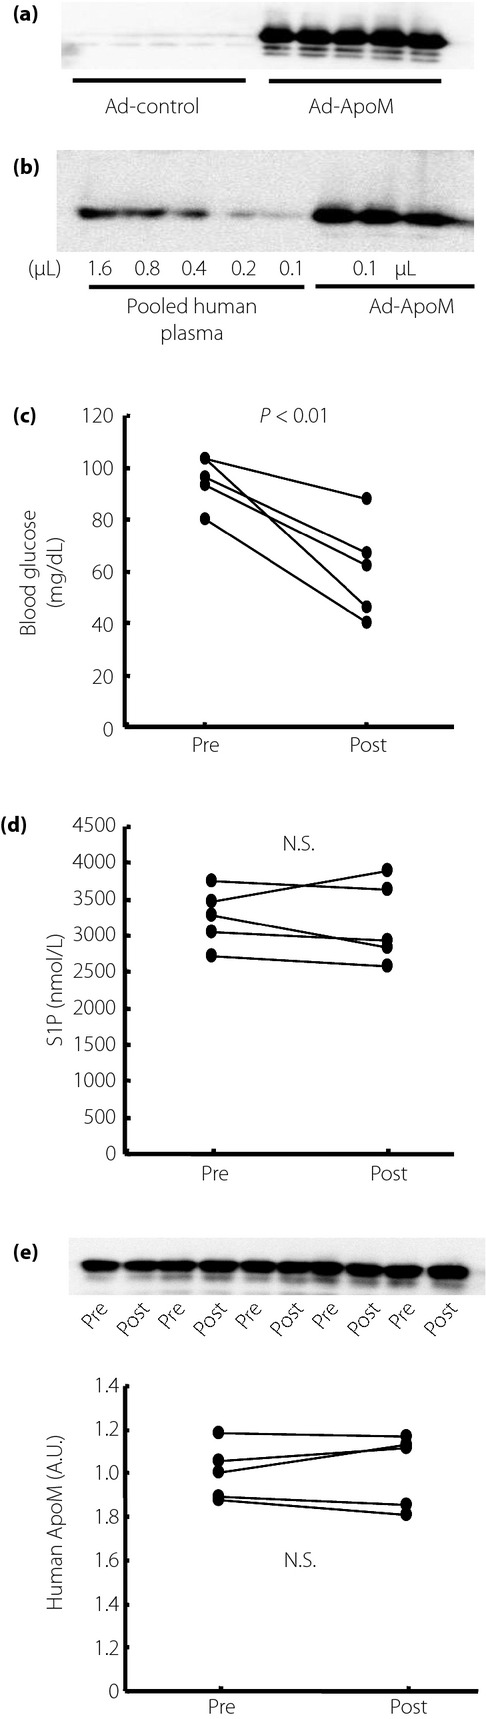
The effects of insulin on plasma sphingosine-1-phosphate (S1P) and apolipoprotein M (ApoM) levels in ApoM-overexpressing mice. Ten-week-old normal mice were infected with adenovirus coding human ApoM (Ad-ApoM; n = 5). At 5 days after the administration, they were treated with Humulin R (0.5 IU/kg of bodyweight). (a) ApoM levels in mice infected with Ad-ApoM and mice infected with control blank adenovirus (Ad-control), (b) the expression level of ApoM in ApoM-overexpressing mice, compared with pooled human plasma. (c) Changes in the blood glucose level, (d) changes in the plasma S1P level and (e) changes in the plasma human ApoM level. A.U., arbitrary unit; N.S., not significant.
Incubation with Insulin or in a Low-Glucose Medium Decreased ApoM Levels in HepG2 Cells
We next investigated the effects of insulin, high glucose or low glucose in vitro with HepG2 cells, human hepatoma cell line. As shown in Figure7a,b, insulin decreased both cellular and medium ApoM levels, whereas high glucose did not exert apparent effects on ApoM. As shown in Figure7c,d, incubation in a low-glucose medium decreased both cellular and medium ApoM levels.
Figure 7.
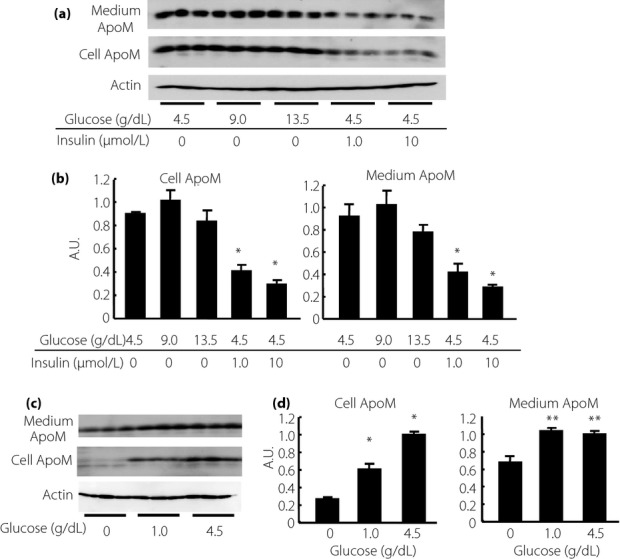
Modulation of apolipoprotein M (ApoM) levels by insulin and glucose in HepG2 cells. At approximately 70% confluence, HepG2 cells were incubated in fetal bovine serum-free Dulbecco's modified Eagle's medium containing various doses of glucose with or without human insulin solution for 8 h, then the media and cellular components were collected, and medium ApoM and cellular ApoM levels were analyzed. (a,b) The effects of insulin on the ApoM levels in HepG2 cells. *P < 0.01 vs HepG2 cells incubated without insulin. (c,d) The effects of the depletion of glucose on the ApoM levels in HepG2 cells. *P < 0.01 vs the other groups. *P < 0.05 vs HepG2 cells incubated without glucose. A.U., arbitrary unit.
Kidney S1P and ApoM Levels Increased in STZ Mice
ApoM is expressed in the kidney as well as the liver, although plasma ApoM is derived mainly from the liver. Therefore, we next investigated the kidney levels of S1P and ApoM in STZ mice. As shown in Figure8a, the kidney S1P levels were significantly increased in the STZ mice and tended to be reduced by insulin treatment. The ApoM content in the kidney was also increased in the STZ mice, and this increment was restored by insulin treatment (Figure8b). These results showed that a similar modulation of S1P and ApoM in the liver might also exist in the kidney.
Figure 8.
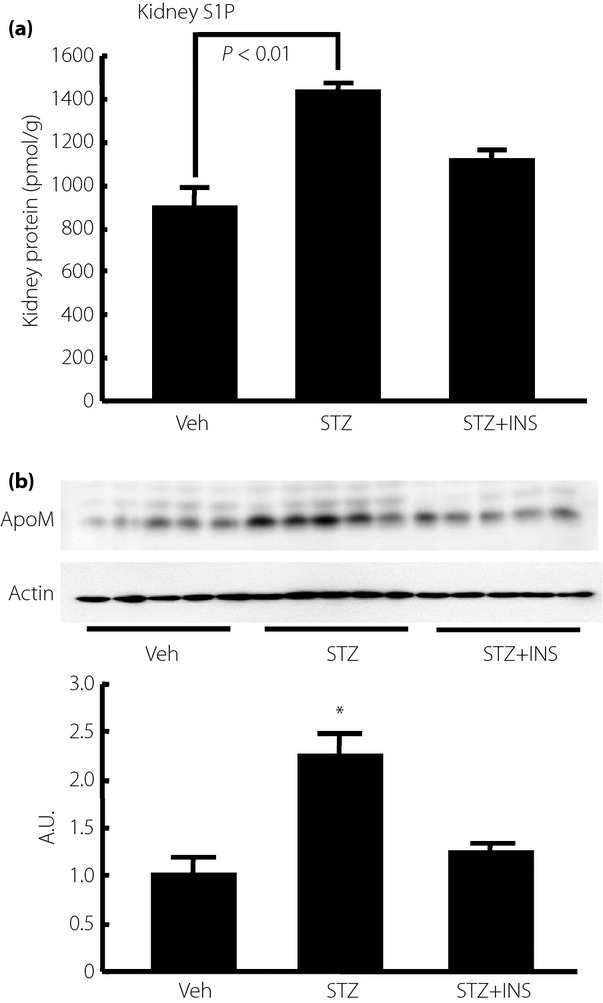
Modulation of kidney sphingosine-1-phosphate (S1P) and apolipoprotein M (ApoM) contents in streptozotocin-induced diabetes (STZ) mice. Fourteen-week-old STZ mice were analyzed after being subjected to a 6-h fast. To investigate the effects of insulin (INS), we administered Humulin R at a dose of 0.75 U/kg bodyweight; samples were collected at 2 h after the administration (n = 5/group). (a) Kidney S1P level adjusted according to the kidney protein level, and (b) kidney ApoM level adjusted according to the β-actin level. *P < 0.01 vs the other groups. A.U., arbitrary unit; Veh, vehicle.
Discussion
S1P is a bioactive lipid mediator that is involved in many diseases5. Among these diseases, S1P has been shown to be involved in the pathogenesis of diabetes, as S1P has protective properties for β-cell functions. Recently, ApoM, a minor apolipoprotein riding on high-density lipoprotein11, was shown to be a carrier and a modulator of S1P10,12. Clinical studies have also shown that single-nucleotide polymorphisms of ApoM are related to diabetes17–19. Furthermore, the diabetic condition itself might influence S1P and ApoM. In the present study, we investigated the S1P and ApoM levels in the plasma and liver of STZ mice, and found that both the S1P and ApoM levels were elevated in both the plasma and liver. Although the source of increased S1P was unclear, we showed that ApoM retards the degradation of S1P, and that ApoM increases the total S1P mass in the body in a previous study12, and this result suggests that the increase in the ApoM level might be deeply involved in the elevation of both the plasma and liver S1P levels in the present study.
Regarding the regulation of ApoM, the involvement of several factors has been proposed: leptin increased ApoM13, whereas glucose14, lipopolysaccharides20 and an liver X receptor agonist21 decreased ApoM. In the present study, although the underlying mechanism responsible for the modulation of ApoM remains to be elucidated, from the results that S1P and ApoM increased in STZ mice and that insulin treatment restored the increased levels of S1P and ApoM levels, insulin might have a negative regulatory effect on S1P and ApoM. Although these results are consistent with a report describing the effects in HepG2 cells14, which was reproduced in the present report (Figure7a,b), our results conflict with those of a previous report describing alloxan-induced diabetic mice13. While β-cell insufficiency is also involved in the pathogenesis of diabetes in alloxan-induced diabetic mice, as well as in STZ mice, there might be two major differences between our mouse model and the previously reported mice. The first difference is that the mice showed a more apparent insulin insufficiency phenotype in the present study; the STZ mice exhibited a reduced bodyweight, reflecting the loss of fat tissue because of increased lipolysis (Table1). However, in alloxan-induced diabetic mice, no difference in bodyweight was observed. Therefore, the extent of the insulin insufficiency and the resultant augmentation of lipolysis were more obvious in our STZ mice. The second difference is that the term of exposure to the diabetic conditions was 8 weeks in the present study, but just 3 days in the previous study, which might not have been long enough time to induce an insulin-deficient condition, such as severe lipolysis. Another interesting finding regarding the regulation of ApoM was that the depletion of glucose decreased ApoM protein levels (Figure7c,d). Although this result apparently conflicts with the previous report, which showed that glucose decreased the ApoM messenger ribonucleic acid levels in HepG2 cells14, the present study showed that the ApoM protein levels were decreased when glucose in the media was depleted. Furthermore, close observation of the band of cellular ApoM in Figure7c showed that the ApoM band in glucose-depleted medium appeared at a lower molecular weight. As human ApoM is highly glycosylated, while murine ApoM is not22, glucose as well as insulin could have important roles in regulating ApoM through increasing the susceptibility of ApoM to glycosylation. Further studies on the effects of other diabetic factors, such as free fatty acids, on ApoM and S1P are required.
The negative regulation of ApoM and S1P by insulin in the present study suggests that the liver might have some roles in maintaining the homeostasis of glucose metabolism. Considering the protective properties of S1P on β-cells, the results from the present study suggested that when β-cell functions were disturbed and insulin levels in the circulation were lowered, ApoM levels in the liver increased, and this compensatory modulation of ApoM results in an increased S1P level, leading to the protection of β-cell functions.
Another interesting result of the present study was that the kidney S1P and ApoM levels were also elevated in STZ mice, and insulin treatment restored this elevation. In the kidney, ApoM is expressed in tubular cells23, and ApoM is excreted into the urine and reabsorbed at the proximal tubule with megalin as receptors24. Although the mechanism by which ApoM in the kidney contributes to the renal S1P content is unclear, the changes in the renal ApoM and S1P contents observed in STZ mice might be one of the compensatory pathways to protect the kidney against injuries caused by diabetes, as S1P has been shown to protect the kidney in recent studies25.
In conclusion, both ApoM and S1P in the plasma, liver and kidney were increased in STZ mice, possibly because of insulin deficiency. ApoM, which is produced in the liver, might have an important role in maintaining the homeostasis of β-cell functions by increasing the S1P level.
Acknowledgments
This work was supported by JSPS KAKENHI Grant Number 22249017 and 25253040 (YY), and Grant Number 25860740 (MK). No conflicts of interest, financial or otherwise, are declared by the authors.
References
- Johnson JD, Luciani DS. Mechanisms of pancreatic beta-cell apoptosis in diabetes and its therapies. Adv Exp Med Biol. 2010;654:447–462. doi: 10.1007/978-90-481-3271-3_19. [DOI] [PubMed] [Google Scholar]
- Marchetti P, Bugliani M, Boggi U, et al. The pancreatic beta cells in human type 2 diabetes. Adv Exp Med Biol. 2012;771:288–309. doi: 10.1007/978-1-4614-5441-0_22. [DOI] [PubMed] [Google Scholar]
- Cnop M, Welsh N, Jonas JC, et al. Mechanisms of pancreatic beta-cell death in type 1 and type 2 diabetes: many differences, few similarities. Diabetes. 2005;54(Suppl 2):S97–S107. doi: 10.2337/diabetes.54.suppl_2.s97. [DOI] [PubMed] [Google Scholar]
- Yatomi Y. Sphingosine 1-phosphate in vascular biology: possible therapeutic strategies to control vascular diseases. Curr Pharm Des. 2006;12:575–587. doi: 10.2174/138161206775474404. [DOI] [PubMed] [Google Scholar]
- Maceyka M, Harikumar KB, Milstien S, et al. Sphingosine-1-phosphate signaling and its role in disease. Trends Cell Biol. 2012;22:50–60. doi: 10.1016/j.tcb.2011.09.003. [DOI] [PMC free article] [PubMed] [Google Scholar]
- Cantrell Stanford J, Morris AJ, Sunkara M, et al. Sphingosine 1-phosphate (S1P) regulates glucose-stimulated insulin secretion in pancreatic beta cells. J Biol Chem. 2012;287:13457–13464. doi: 10.1074/jbc.M111.268185. [DOI] [PMC free article] [PubMed] [Google Scholar]
- Qi Y, Chen J, Lay A, et al. Loss of sphingosine kinase 1 predisposes to the onset of diabetes via promoting pancreatic beta-cell death in diet-induced obese mice. FASEB J. 2013;10:4294–4304. doi: 10.1096/fj.13-230052. [DOI] [PubMed] [Google Scholar]
- Jessup CF, Bonder CS, Pitson SM, et al. The sphingolipid rheostat: a potential target for improving pancreatic islet survival and function. Endocr Metab Immune Disord Drug Targets. 2011;11:262–272. doi: 10.2174/187153011797881201. [DOI] [PubMed] [Google Scholar]
- Fox TE, Bewley MC, Unrath KA, et al. Circulating sphingolipid biomarkers in models of type 1 diabetes. J Lipid Res. 2011;52:509–517. doi: 10.1194/jlr.M010595. [DOI] [PMC free article] [PubMed] [Google Scholar]
- Christoffersen C, Obinata H, Kumaraswamy SB, et al. Endothelium-protective sphingosine-1-phosphate provided by HDL-associated apolipoprotein M. Proc Natl Acad Sci USA. 2011;108:9613–9618. doi: 10.1073/pnas.1103187108. [DOI] [PMC free article] [PubMed] [Google Scholar]
- Xu N, Dahlback B. A novel human apolipoprotein (ApoM) J Biol Chem. 1999;274:31286–31290. doi: 10.1074/jbc.274.44.31286. [DOI] [PubMed] [Google Scholar]
- Kurano M, Tsukamoto K, Ohkawa R, et al. Liver involvement in sphingosine 1-phosphate dynamism revealed by adenoviral hepatic overexpression of apolipoprotein M. Atherosclerosis. 2013;229:102–109. doi: 10.1016/j.atherosclerosis.2013.04.024. [DOI] [PubMed] [Google Scholar]
- Xu N, Nilsson-Ehle P, Ahren B. Suppression of apolipoprotein M expression and secretion in alloxan-diabetic mouse: partial reversal by insulin. Biochem Biophys Res Commun. 2006;342:1174–1177. doi: 10.1016/j.bbrc.2006.02.022. [DOI] [PubMed] [Google Scholar]
- Zhang X, Jiang B, Luo G, et al. Hyperglycemia down-regulates apolipoprotein M expression in vivo and in vitro. Biochim Biophys Acta. 2007;1771:879–882. doi: 10.1016/j.bbalip.2007.04.020. [DOI] [PubMed] [Google Scholar]
- Lan T, Bi H, Xu S, et al. Determination of sphingosine kinase activity in biological samples by liquid chromatography-tandem mass spectrometry. Biomed Chromatogr. 2010;24:1075–1083. doi: 10.1002/bmc.1407. [DOI] [PubMed] [Google Scholar]
- Yatomi Y. Plasma sphingosine 1-phosphate metabolism and analysis. Biochim Biophys Acta. 2008;1780:606–611. doi: 10.1016/j.bbagen.2007.10.006. [DOI] [PubMed] [Google Scholar]
- Niu N, Zhu X, Liu Y, et al. Single nucleotide polymorphisms in the proximal promoter region of apolipoprotein M gene (ApoM) confer the susceptibility to development of type 2 diabetes in Han Chinese. Diabetes Metab Res Rev. 2007;23:21–25. doi: 10.1002/dmrr.641. [DOI] [PubMed] [Google Scholar]
- Wu X, Niu N, Brismar K, et al. Apolipoprotein M promoter polymorphisms alter promoter activity and confer the susceptibility to the development of type 1 diabetes. Clin Biochem. 2009;42:17–21. doi: 10.1016/j.clinbiochem.2008.10.008. [DOI] [PubMed] [Google Scholar]
- Zhou JW, Tsui SK, Ng MC, et al. Apolipoprotein M gene (APOM) polymorphism modifies metabolic and disease traits in type 2 diabetes. PLoS ONE. 2011;6:e17324. doi: 10.1371/journal.pone.0017324. [DOI] [PMC free article] [PubMed] [Google Scholar]
- Feingold KR, Shigenaga JK, Chui LG, et al. Infection and inflammation decrease apolipoprotein M expression. Atherosclerosis. 2008;199:19–26. doi: 10.1016/j.atherosclerosis.2007.10.007. [DOI] [PubMed] [Google Scholar]
- Zhang X, Zhu Z, Luo G, et al. Liver X receptor agonist downregulates hepatic ApoM expression in vivo and in vitro. Biochem Biophys Res Commun. 2008;371:114–117. doi: 10.1016/j.bbrc.2008.04.017. [DOI] [PubMed] [Google Scholar]
- Faber K, Axler O, Dahlback B, et al. Characterization of ApoM in normal and genetically modified mice. J Lipid Res. 2004;45:1272–1278. doi: 10.1194/jlr.M300451-JLR200. [DOI] [PubMed] [Google Scholar]
- Zhang XY, Dong X, Zheng L, et al. Specific tissue expression and cellular localization of human apolipoprotein M as determined by in situ hybridization. Acta Histochem. 2003;105:67–72. doi: 10.1078/0065-1281-00687. [DOI] [PubMed] [Google Scholar]
- Faber K, Hvidberg V, Moestrup SK, et al. Megalin is a receptor for apolipoprotein M, and kidney-specific megalin-deficiency confers urinary excretion of apolipoprotein M. Mol Endocrinol. 2006;20:212–218. doi: 10.1210/me.2005-0209. [DOI] [PubMed] [Google Scholar]
- Koch A, Pfeilschifter J, Huwiler A. Sphingosine 1-phosphate in renal diseases. Cell Physiol Biochem. 2013;31:745–760. doi: 10.1159/000350093. [DOI] [PubMed] [Google Scholar]