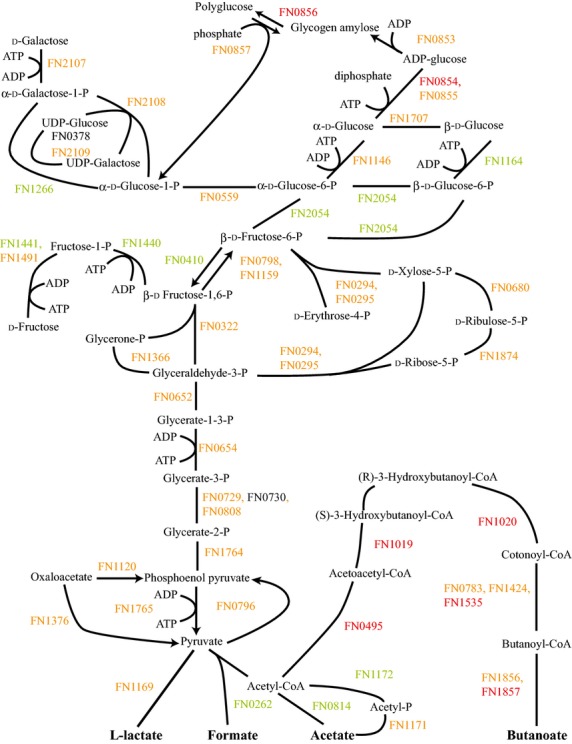
Figure 3.

FnPg versus Fn energy metabolism and end products. The diagram shows a schematic of the glycolysis and pentose phosphate pathways for Fn including the end products of the metabolism, formate, acetate, l-lactate, and butanoate, for the Fusobacterium nucleatum with Porphyromonas gingivalis sample compared to F. nucleatum. Labels and color coding as described for Figure1.
