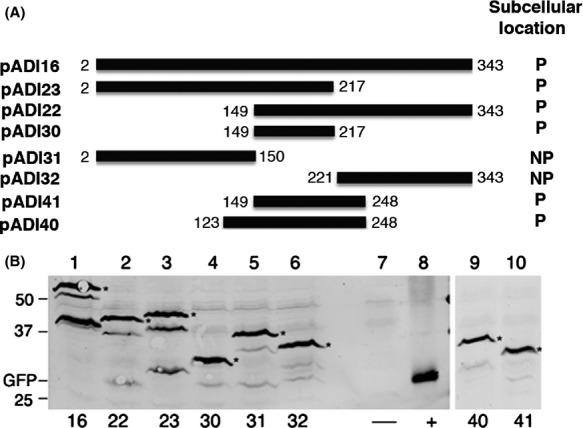
Figure 5.

Analysis of GFP-VirB11 and its derivatives. (A) The gfp-virB11 fusions constructed in this study and subcellular locations of the encoded fusion proteins are shown. P, polar; NP, nonpolar. (B) Accumulation of fusion proteins was analyzed by western blot assays as described in legend to Figure3. Numbers below the figure identify the pADI plasmid in the strain analyzed. The lower band(s) seen in some lanes are degradation products (*, fusion protein). −, no GFP; +, GFP alone.
