

Abstract
Objectives
Pediatric bipolar disorder is currently diagnosed based on signs and symptoms, and without objective diagnostic biomarkers. In this study, we investigated the utility of structural neuroanatomical signatures of the amygdala to objectively differentiate individual subjects with pediatric bipolar disorder from matched healthy controls.
Methods
Structural T1-weighted neuroimaging scans were obtained from 16 children and adolescents with unmedicated DSM-IV bipolar disorder (11 males, five females) and 16 matched healthy controls (11 males, five females). Voxel-based gray matter morphometric features extracted from a bilateral region-of-interest within the amygdala were used to develop a multivariate pattern analysis model which was utilized in predicting novel or ‘unseen’ individual subjects as either bipolar disorder or healthy controls.
Results
The model assigned 25 out of 32 subjects the correct label (bipolar disorder/healthy) translating to a 78.12% diagnostic accuracy, 81.25% sensitivity, 75.00% specificity, 76.47% positive predictive value, and 80.00% negative predictive value and an area under the receiver operating characteristic curve (ROC) of 0.81. The predictions were significant at p = 0.0014 (χ2 test p-value).
Conclusions
These results reaffirm previous reports on the existence of neuroanatomical abnormalities in the amygdala of pediatric patients with bipolar disorder. Remarkably, this study also demonstrates that neuroanatomical signatures of the amygdala can predict individual subjects with bipolar disorder with a relatively high specificity and sensitivity. To the best of our knowledge, this is the first study to present a proof-of-concept diagnostic marker of pediatric bipolar disorder based on structural neuroimaging scans of largely medication naïve patients.
Keywords: amygdala, machine learning, multivariate pattern analysis, neuroimaging, pediatric bipolar disorder
Epidemiological studies have previously established that pediatric bipolar disorder (PBD) has a prevalence rate of approximately 1.0–1.5% in the general population (1-3). Family, twin, and adoption studies have also reported that PBD is highly heritable, with families of bipolar probands having an elevated risk of developing the disorder (4, 5). In addition, nearly one-third of patients with PBD attempt suicide at least once (6), with previous reports indicating that early onset bipolar disorder appears to follow a more severe course with poorer long-term prognosis as compared to late onset bipolar disorder (7, 8). Overall, these facts translate to elevated treatment costs and a high socio-economic burden which underscores the need to elucidate the pathophysiological mechanism of the disorder (6).
Converging evidence from both structural and functional neuroimaging studies has consistently implicated the dysfunction of the anterior-limbic system in the pathophysiology of PBD (3, 9-13). The anterior-limbic system consists of heavily interconnected regions which include the amygdala, prefrontal cortex, thalamus, and striatum, which are involved in mood, cognition, and emotion regulation (3, 9, 14-18). Interestingly, experiments from both functional neuroimaging and lesion studies have also established that the amygdala is principally responsible for emotion modulation, such as recognizing fear and anger from facial expressions (3, 10, 19-24). Remarkably, there is also consensus from multiple group-level structural neuroimaging studies on the existence of volumetric reductions in the amygdala of patients with PBD as compared to their typically developing peers (9, 11-13, 17, 25-28). Indeed, this is by far the most replicated finding in PBD structural neuroimaging studies (29). This finding is further highlighted in these subsequent reviews and meta-analyses (3, 10, 30).
However, despite these noteworthy advancements in our understanding of PBD, diagnosis, prognosis, and treatment planning still remain subjective—based on signs and symptoms and without any pathognomonic tests. Markedly, an important first step in achieving the goal of deploying pathognomonic tests in diagnosis and prognosis of PBD is being able to predict subjects with PBD at an individual subject level. A majority of previous studies have only been able to identify average group-level neuroanatomical differences between subjects with PBD and healthy controls. As a result, in this study we set out to investigate whether neuroanatomical signatures of the amygdala from T1-weighted neuroimaging scans can objectively predict PBD diagnosis at an individual subject level.
Multivariate pattern analysis techniques also known as machine learning techniques have recently been applied in clinical neuroimaging studies to make predictions at an individual subject level with success (22, 31-37). In general, these techniques are implemented in three key stages. First, neuroimaging scan data from several subjects with corresponding diagnostic labels (e.g., 1 = PBD and 2 = healthy controls) are used to train or develop a statistical model. Second, the accuracy of the learnt model is evaluated using novel data not used during the training stage. Third, the model's ability to generalize from novel or unseen data is reported using several statistical measurements such as diagnostic accuracy, specificity, sensitivity, positive predictive value (PPV), negative predictive value (NPV), and a receiver operating characteristic (ROC) curve. Detailed discussions of these methods with respect to clinical neuroimaging data are given elsewhere (22, 31-35, 38, 39). However, in this study, the Elastic Net pattern analysis method (40, 41) was ‘trained’ to make novel predictions on individual subjects.
In summary, the main objective of this study was to examine the utility of voxel-based gray matter values from the amygdala to objectively predict individual subjects with PBD or healthy controls. This hypothesis was primarily motivated by the emerging consensus from multiple neuroimaging studies on volumetric reductions in the amygdala of patients with PBD as compared to healthy controls (9, 11-13, 17, 25, 26, 42) as summarized in Table 1.
Table 1. A summary of previous studies highlighting structural neuroanatomical abnormalities in the amygdala of patients with pediatric bipolar disorder.
| Study | Study groups | PBD age Mean (SD) | Controls age Mean (SD) | Amygdala abnormalities reported |
|---|---|---|---|---|
| Chang et al. 2005 (11) | PBD/controls | 14.6 (2.8) | 14.1 (2.8) | Reduced volume in PBD |
| Dickstein et al. 2005 (12) | PBD/controls | 13.5 (2.5) | 13.3 (2.3) | Reduced volume in PBD (left amygdala) |
| Blumberg et al. 2003 (13) | PBD/controls | 15.0 (4.0) | 15.3 (2.8) | Reduced volume in PBD |
| Chen et al. 2004 (25) | PBD/controls | 16.0 (3.0) | 17.0 (4.0) | Reduced volume in PBD (left amygdala) |
| DelBello et al. 2004 (26) | PBD/controls | 16.3 (2.4) | 17.2 (1.9) | Smaller amygdala in PBD |
SD = standard deviation; PBD = pediatric bipolar disorder.
Methods
Subjects
This study was approved by the local Institutional review board at The University of Texas Health Science Center at San Antonio. Written informed assent and consent was obtained from all subjects and their guardians. The study participants included 16 children and adolescents with DSM-IV diagnosis of bipolar disorder and 16 healthy controls matched based on age, gender, ethnicity, and pubertal status as shown in Table 2. Inclusion criteria was a DSM-IV diagnosis of bipolar disorder [bipolar I disorder, bipolar II disorder, or bipolar disorder not otherwise specified (NOS)] through a structured clinical interview of Diagnostic and Statistical Manual of Mental Disorders-IV (DSM-IV). Patients' inclusion criteria included: (i) being free of any psychotropic drugs for at least two weeks, (ii) no substance abuse within past six months, and (iii) being without current medical problems. Exclusion criteria was any history of substance abuse with the exception of attention-deficit hyperactivity disorder (ADHD) or conduct disorder. Healthy controls inclusion criteria included no history of any psychiatric disorders and substance abuse or neurologic disorders. Healthy controls with a history of any Axis I psychiatric disorders in first-degree relatives were also excluded. Subjects using any psychoactive medication within two weeks of the study or with current medical problems were excluded. Only three patients had past medication history (beyond the two-week cutoff period) while all other patients were completely medication naïve. In both the patient and healthy control groups, additional exclusion criteria was: pregnancy, neurologic disorders, head injury with loss of consciousness, family history of hereditary neurologic disorders, and presence of metallic objects in the body.
Table 2. Study demographic details.
| Characteristics | Bipolar disorder (n = 16) |
Healthy controls (n = 16) |
p-value |
|---|---|---|---|
| Age, years, mean (SD) | 14.39 (2.41) | 14.61 (2.48) | 0.808a |
| Sex, female, n | 5 | 5 | 1.00b |
| Education, years, mean (SD) | 8.31 (2.62) | 8.62 (2.45) | 0.73a |
| YMRS score, mean (SD) | 9.27 (5.99) | 1.00 (1.67) | < 0.0001a |
| CDRS score, mean (SD) | 34.50 (15.29) | 18.19 (1.64) | < 0.0001a |
| Ethnicity, n | 0.220b | ||
| White | 7 | 3 | |
| Hispanic | 9 | 12 | |
| Other | 0 | 1 | |
| Petersen development scores, mean (SD) | 2.63 (0.94) | 2.47 (0.92) | 0.642a |
| Handedness, left, n | 1 | 2 | 0.964 |
| Illness duration, years, mean (SD) | 4.46 (2.54) | – | – |
| Bipolar type, n | – | – | |
| Bipolar II disorder | 9 | ||
| Bipolar I disorder | 6 | ||
| Bipolar disorder NOS | 1 | ||
| Comorbidities | – | – | |
| SAD | 5 | ||
| OCD | 2 | ||
| Simple/specific phobia | 3 | ||
| GAD | 5 | ||
| PTSD | 1 | ||
| Social phobia | 1 | ||
| Enuresis | 3 | ||
| Conduct disorder | 1 | ||
| ODD | 7 | ||
| ADHD | 3 |
SD = standard deviation; NOS = not otherwise specified; YMRS = Young Mania rating Scale; CDRS = Children's Depression Rating Scale; SAD = seasonal affective disorder; OCD = obsessive compulsive disorder; GAD = generalized anxiety disorder; PTSD = posttraumatic stress disorder; ODD = oppositional defiant disorder; ADHD = attention-deficit hyperactivity disorder.
Independent sample t-test.
Chi-square test.
Magnetic resonance imaging (MRI) protocol
Structural MRI images were acquired using a 1.5T GE Imaging System (General Electric Medical Systems, Milwaukee, WI, USA) with a 3-D spoiled gradient recalled acquisition (SPGR) protocol with the following parameters: repetition time (TR) = 25 msed, echo time (TE) = 5 msed, flip angle = 40°, field of view (FOV) = 24 cm, slice thickness = 1.5 mm, and a matrix size = 256 × 192.
Image pre-processing
All T1-weighted MR scans were visually inspected to rule out artefacts and then spatially normalized into a common anatomical template to allow inter-subject statistical comparisons (34, 43). The spatial normalization step as implemented in statistical parametric mapping (SPM8) toolbox (43) was executed as follows. First, the T1-weighted MR scans were segmented into different tissue types (e.g., gray matter, white matter, and cerebrospinal fluid) (43). Second, a study-specific brain anatomical template was created based on average tissue probability maps from all subjects using the diffeomorphic anatomical registration through exponential lie algebra (DARTEL) method as implemented in SPM8 (43). Third, segmented images from the first step were aligned into the study-specific template but with an additional tissue modulation step to control for tissue ‘stretching’ and ‘compression’ effects sustained in the previous step (34, 43). Lastly, the spatially normalized scans were resampled into a 2 × 2 × 2 voxel size and smoothed with an isotropic 8-mm Gaussian full-width at half-maximum (FWHM) smoothing kernel.
In view of the above, a bilateral region-of-interest (ROI) was defined within the amygdala and voxel-based gray matter probability values extracted from the pre-processed gray matter tissue volumes in an automated manner using the Wake Forest University ‘Pickatlas’ toolbox (wfu_pickatlas) (44). Notably, both SPM8 and wfu_pickatlas were running under Matlab Ver. 8.0.0.783 (R2012b) (The Mathworks, Inc.). Gray matter probability values from 319 voxels lying bilaterally within the amygdala were extracted and used as predictor variables in the subsequent statistical data analyses steps. Previous studies have utilized the wfu_pickatlas toolbox in a similar manner to delineate the amygdala from spatially normalized neuroimaging scans (45-47). Notably, a two-dimensional snapshot of the resulting bilateral amygdala region-of-interest is shown in Figure 1. A multi-slice view of the same is given in the Supplementary Materials.
Fig. 1.
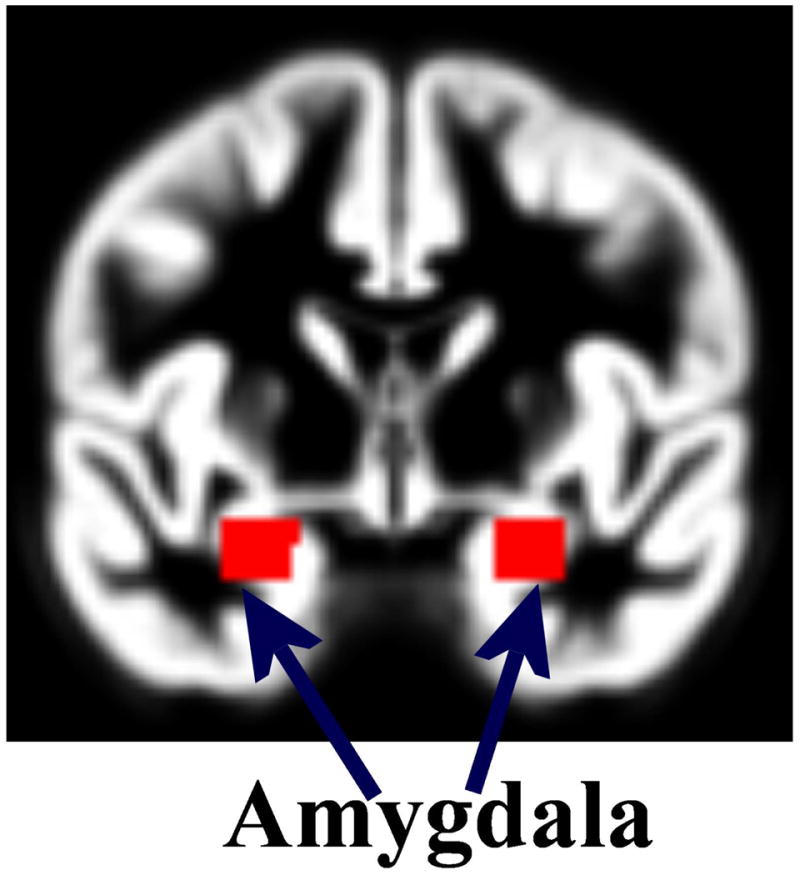
A two-dimensional snapshot of the bilateral amygdala region-of-interest from the WFU_Pickatlas toolbox and used to extract the predictor variables. A multi-slice view is given in the Supplementary Materials.
Data analysis
Predictor variables obtained during the pre-processing stage were used to develop a statistical multivariate pattern analysis model. Specifically, the predictor variables were transformed to have zero mean and unit length by dividing with the mean and subtracting the standard deviation and together with their corresponding categorical labels (1 = PBD, 2 = healthy controls) input into the Elastic Net pattern analysis algorithm (40). Specifically, we assume y and x represent our target categorical labels and predictor variables respectively, while N represents number of subjects (observations). The Elastic Net computed model coefficients β̂ by minimizing an objective function (39, 40, 48).
Where, λ1 is a parameter used to promote sparsity in the solution- meaning ‘less’ relevant predictor variables (39, 40, 49). In contrast, λ2 is a parameter used to encourage stability in the solution and limits the number of relevant predictor variables selected (39, 40, 49). The two parameters (λ1 and λ2) were selected using a leave-one-out cross-validation (LOOCV) process which selected the most optimal parameters leading to a high predictive accuracy. The model parameters were derived objectively using the training data only to avoid circularity or ‘double-dipping’ (32). The Elastic Net objective function was solved using the ‘coordinate descent algorithm’ whose MATLAB (The Mathworks, Inc) implementation is freely provided elsewhere (41). There are notable benefits of using the Elastic Net algorithm as compared to equivalent machine learning algorithms such as support vector machines (SVMs) or relevance vector machines (RVMs). First, the Elastic Net combines both machine learning and feature subset selection steps thus not requiring an additional feature reduction step (39). Feature reduction is relevant in a machine learning framework to remove noise and redundant variables (39). Second, unlike the least absolute shrinkage and selection operator (LASSO) algorithm, in the Elastic Net the number of predictor variables may exceed the number of observations without the model beginning to saturate (40). Lastly, as compared to other algorithms which provide ‘hard’ binary (1 or 0) outputs (e.g., SVMs), the Elastic Net provides probabilistic outputs which are clinically relevant.
The model was implemented using ‘nested’ LOOCV procedures. The first or ‘inner’ LOOCV iteration was used to select ‘optimal’ model parameters using training data only. The second or ‘outer’ LOOCV iteration was used to train the model with identified parameters and tested using the ‘left-out’ subject. Notably, LOOCV involves training the model with all subjects but one while the ‘left-out’ subject is used for testing. This process is repeated until all subjects have been ‘left-out’ of the training process once (32-35). A schematic flow diagram of the model training and testing process is shown in the Supplementary Materials. The validity of the model was evaluated using accuracy, sensitivity, specificity, PPV, and NPV. Sensitivity refers to the number of patients with the disorder predicted correctly by the model and specificity the number of healthy controls predicted correctly. Accuracy refers to the sum of true positives and true negatives which is divided by the total number of samples and multiplied by 100. PPV is the percentage of positive predicted subjects that are actually positive (true positives) and conversely, NPV is the percentage of negative predicted subjects that are actually negative (true negatives) (50).
A post-hoc statistical analysis comparing amygdala average gray matter probability values between healthy controls and patients was performed. A similar analysis comparing amygdala gray matter volume between healthy controls and patients was undertaken using a univariate statistical analysis method.
Results
As shown in Table 2, the patient and healthy control groups did not differ significantly in terms of age, gender, ethnicity, and years of education.
The multivariate pattern analysis statistical model assigned 25 out of all 32 subjects the correct label (PBD or healthy control). This translates to a diagnostic accuracy of 78.12%, sensitivity = 81.25%, specificity = 75%, PPV = 76.47%, NPV = 80%, and an area under ROC curve of 0.81. To assess the model's significance level, a chi-square test between actual categorical labels and the model's predicted labels was computed and found to be significant at p = 0.0014. The model's probabilistic predictions were used to generate the ROC curve which was graphed using Matlab (The Mathworks, Inc) as shown in Figure 2. A confusion matrix which was used to calculate the model accuracy, specificity, and sensitivity is shown in Figure 2. A detailed table showing per subject prediction results is also given in the Supplementary Materials. The model's ability to make predictions based on wholebrain gray matter probability values resulted in poor predictions accuracy = 51%, specificity = 50%, and sensitivity = 52% which is equivalent to a random predictor. In addition, we evaluated the model's ability to classify subjects using left and right amygdala separately. In agreement with the univariate test (Fig. 2), the model did not predict better than chance (50%) while trained with the left amygdala alone but results from the right amygdala alone were better than chance (59%) and area under ROC curve (0.64).
Fig. 2.
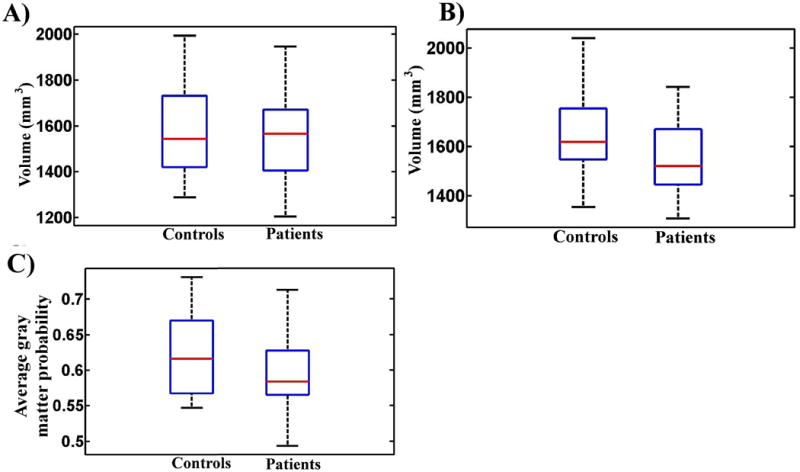
Box-plots comparing amygdala neuroanatomical features between patients and controls. (A) Control and patient groups did not differ significantly in the left amygdala (controls > patients, p = 0.2344; patients > controls, p = 0.7656). (B) Control group had significantly larger volumes in the right amygdala (p = 0.0452) based on a two group independent t-test. Volumetric measurements were extracted using the Freesurfer version 4.5 (http://surfer.nmr.mgh.harvard.edu/). (C) Controls had significantly higher average gray matter probability values in the bilateral amygdala as compared to patients (p < 0.0001).
Figure 3 shows box plots of amygdala gray matter probability values in both patient and control groups. Controls had significantly higher gray matter probability values as compared to patients (independent t-test p = 0.0452).
Fig. 3.
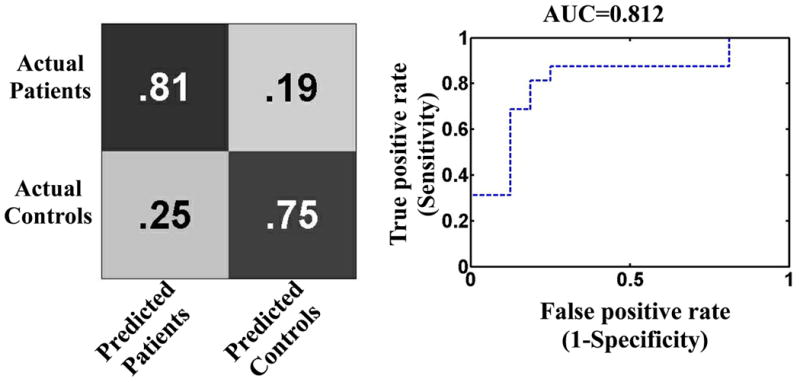
A confusion matrix and a receiver operating characteristic curve (ROC) which were used to compute the model accuracy, sensitivity, specificity, and area under the ROC (AUC). The accuracy, sensitivity, specificity, positive predictive value, and negative predictive value were 78.12%, 81.25%, 75.0%, 76.47%, and 80.0%, respectively. Predictions were significant at p = 0.0014.
Discussion
In this study, we investigated the utility of neuroanatomical signatures of the amygdala to objectively categorize children and adolescents with bipolar disorder and healthy controls at an individual subject level. The model diagnostic accuracy (78.12%) was statistically significant and covering an area under receiver characteristic curve of 0.81. Similarly, our post-hoc findings agreed with previous published literature that there may exist volumetric reductions in the amygdala of children and adolescents with bipolar disorder (3). In addition, our diagnostic accuracy, specificity and sensitivity are comparable to other machine learning studies in neuropsychiatry which have reported similar predictive accuracies ranging from (70-90%) (32, 37, 51). To the best of our knowledge this is the first study to present a proof-of-concept structural diagnostic neuroanatomical marker in largely medication naïve patients with PBD. This is a noteworthy addition to existing studies given that previous structural neuroimaging studies in PBD have largely reported average group-level differences.
Specific benefits of using a multivariate pattern analysis approach as explored in this study should be noted. First, multivariate pattern analysis techniques are said to be more sensitive and specific as compared to conventional mass univariate techniques (52). Second, a number of multivariate pattern analysis techniques such as Elastic Net provide probabilistic outputs at an individual subject level which is potentially useful in clinical decision making (32). Third, previous group-level studies have often separated the left and right amygdala, here though bilateral neuroanatomical signatures of the amygdala were used to train a multivariate model which was used in making individual subjects predictions. Notably, the decision to select the amygdala was motivated by the existence of multiple replicated structural neuroimaging studies reporting that there exist neuroanatomical abnormalities in the amygdala of PBD. Attempts to train the model using wholebrain gray matter images were not successful as the model returned a poor diagnostic accuracy of 51%. The poor diagnostic accuracy with whole brain data can be attributed to a small sample size given that Chu and colleagues (53) have recently demonstrated that the model accuracy can be hampered by a small sample size. Similarly, this finding is in line with previous studies which have shown that a model trained with features extracted through a domain-knowledge driven process, (e.g., amygdala in PBD or hippocampus in Alzheimer's disease) may perform better as compared to a model trained using whole brain data or features extracted through a data-driven process (53, 54). In addition, this finding demonstrates that a majority of cortical and subcortical regions are non-relevant in separating PBD and healthy controls and may have introduced noise and redundancy to the model leading to a poor diagnostic accuracy. Remarkably, this is in agreement with previous evidence that neuroanatomical abnormalities in PBD are localized in particular regions especially those that play a central role in emotion regulation such as the amygdala. Notably, while postmortem studies of children with PBD are scarce, there is some evidence that volumetric reductions in amygdala may be driven by reductions in glial cell density (55, 56). In addition, postmortem studies from adult bipolar patients have reported decreased neuronal size in the amygdala (57). A recent study reported that smaller amygdala volumes may predict risk of converting to bipolar disorder in high-risk youth (58). Notably, previous studies examining high risk offspring of bipolar disorder patients did not find significant amygdala volumetric abnormalities (59-61).
Potential limitations of this study should be noted. First, our sample size was relatively small as we only considered patients free of any psychotropic medications for at least two weeks before scanning. Notably, this consideration was to allow us to ascertain that the abnormalities observed were illness related and not driven by any psychotropic medications. There is emerging evidence that some psychotropic medications such as lithium may induce gray matter volume increases in bipolar disorder (62). Second, our sample size included subjects with comorbid psychiatric conditions (e.g., generalized anxiety disorder) which somewhat limits our ability to draw definite conclusions that our observations are only restricted to bipolar disorder. Third, while there is a wide consensus on the existence of volumetric abnormalities in the amygdala of child onset bipolar disorder, this is not the case with adult bipolar disorder (56). Consequently, it is not guaranteed that the hypothesis evaluated in this study is applicable in adult bipolar disorder. Indeed, there are suggestions that child and adult onset bipolar disorders may have different etiologies (3, 56). In addition, our model does not assess the predictive utility of the amygdala in differentiating PBD from other neurodevelopmental disorders and work is ongoing in our group to investigate this hypothesis. Our sample contained equal number of males and females in each group in order to avoid gender related effects but future studies will also focus on elucidating these effects and laterality differences in PBD. Lastly, our sample consisted of all three subtypes of PBD (I, II, and NOS) while there is emerging evidence on patients with PBD type I being more impaired as compared to other subtypes (63), but future studies will investigate similar hypotheses across PBD subtypes. In addition, having a first-degree relative with an Axis I disorder was not an exclusion criteria for our patients and future studies will investigate whether this factor may influence primary outcome measures.
In conclusion, we report highly accurate predictions of individual subjects with PBD using neuroanatomical signatures of the amygdala. Further work is needed to replicate the technique in a larger sample size and also improve the prediction accuracy before this technique can be applied in a clinical setting. We envisage that techniques such as discussed in this study may in the future play an important role in making clinically relevant predictions (e.g., predict treatment responders versus non-responders) leading to better targeted therapies and improved patient care. However, being able to separate patient and healthy control groups or multiple clinical groups (e.g., unipolar and bipolar disorders) at an individual subject level as explored here is an important first step.
Supplementary Material
Acknowledgments
Supported in part by the National Institute of Mental Health grant R01 085667, and the Pat Rutherford, Jr. Endowed Chair in Psychiatry (JCS).
Disclosures: JCS has participated in research funded by Forest, Merck, Bristol-Myers Squibb, and GlaxoSmithKline; and has been a speaker for Pfizer and Abbott.
Footnotes
BM, DS, and GBZS do not have any conflicts of interest to report.
References
- 1.Jonas B, Brody D, Roper M, Narrow W. Prevalence of mood disorders in a national sample of young American adults. Soc Psychiatry Psychiatr Epidemiology. 2003;38:618–624. doi: 10.1007/s00127-003-0682-8. [DOI] [PubMed] [Google Scholar]
- 2.Kupfer D. The increasing medical burden in bipolar disorder. JAMA. 2005;293:2528–2530. doi: 10.1001/jama.293.20.2528. [DOI] [PubMed] [Google Scholar]
- 3.Pfeifer JC, Welge J, Strakowski SM, Adler C, Delbello MP. Meta-analysis of amygdala volumes in children and adolescents with bipolar disorder. J Am Acad Child Adolesc Psychiatry. 2008;47:1289–1298. doi: 10.1097/CHI.0b013e318185d299. [DOI] [PubMed] [Google Scholar]
- 4.McGuffin P, Rijsdijk F, Andrew M, Sham P, Katz R, Cardno A. The heritability of bipolar affective disorder and the genetic relationship to unipolar depression. Archiv Gen Psychiatry. 2003;60:497–502. doi: 10.1001/archpsyc.60.5.497. [DOI] [PubMed] [Google Scholar]
- 5.Smoller JW, Finn CT. Family, twin, and adoption studies of bipolar disorder. American Journal of Medical Genetics Part C: Seminars in Medical Genetics: Wiley Online Library. 2003:48–58. doi: 10.1002/ajmg.c.20013. [DOI] [PubMed] [Google Scholar]
- 6.Goldstein TR, Birmaher B, Axelson D, et al. History of suicide attempts in pediatric bipolar disorder: factors associated with increased risk. Bipolar Disord. 2005;7:525–535. doi: 10.1111/j.1399-5618.2005.00263.x. [DOI] [PMC free article] [PubMed] [Google Scholar]
- 7.Bearden CE, Soares JC, Klunder AD, et al. Three-dimensional mapping of hippocampal anatomy in adolescents with bipolar disorder. J Am Acad Child Adolesc Psychiatry. 2008;47:515–525. doi: 10.1097/CHI.0b013e31816765ab. [DOI] [PMC free article] [PubMed] [Google Scholar]
- 8.Post RM, Leverich GS, Kupka RW, et al. Early-onset bipolar disorder and treatment delay are risk factors for poor outcome in adulthood. J Clin Psychiatry. 2010;71:864–872. doi: 10.4088/JCP.08m04994yel. [DOI] [PubMed] [Google Scholar]
- 9.Frazier JA, Chiu S, Breeze JL, et al. Structural brain magnetic resonance imaging of limbic and thalamic volumes in pediatric bipolar disorder. Am J Psychiatry. 2005;162:1256–1265. doi: 10.1176/appi.ajp.162.7.1256. [DOI] [PubMed] [Google Scholar]
- 10.Caetano SC, Olvera RL, Glahn D, Fonseca M, Pliszka S, Soares JC. Frontolimbic brain abnormalities in juvenile onset bipolar disorder. Biol Psychiatry. 2005;58:525–531. doi: 10.1016/j.biopsych.2005.04.027. [DOI] [PubMed] [Google Scholar]
- 11.Chang K, Karchemskiy A, Barnea-Goraly N, Garrett A, Simeonova DI, Reiss A. Reduced amygdalar gray matter volume in familial pediatric bipolar disorder. J Am Acad Child Adolesc Psychiatry. 2005;44:565–573. doi: 10.1097/01.chi.0000159948.75136.0d. [DOI] [PubMed] [Google Scholar]
- 12.Dickstein DPMM, Nugent AC, et al. Frontotemporal alterations in pediatric bipolar disorder: Results of a voxel-based morphometry study. Arch Gen Psychiatry. 2005;62:734–741. doi: 10.1001/archpsyc.62.7.734. [DOI] [PubMed] [Google Scholar]
- 13.Blumberg HP, Kaufman J, Martin A, et al. Amygdala and hippocampal volumes in adolescents and adults with bipolar disorder. Arch Gen psychiatry. 2003;60:1201–1208. doi: 10.1001/archpsyc.60.12.1201. [DOI] [PubMed] [Google Scholar]
- 14.Drevets WC, Price JL, Furey ML. Brain structural and functional abnormalities in mood disorders: implications for neurocircuitry models of depression. Brain Structure Funct. 2008;213:93–118. doi: 10.1007/s00429-008-0189-x. [DOI] [PMC free article] [PubMed] [Google Scholar]
- 15.Brambilla P, Glahn D, Balestrieri M, Soares J. Magnetic resonance findings in bipolar disorder. Psychiatr Clin North Am. 2005;28:443–467. doi: 10.1016/j.psc.2005.01.006. [DOI] [PubMed] [Google Scholar]
- 16.Chiu S, Widjaja F, Bates ME, et al. Anterior cingulate volume in pediatric bipolar disorder and autism. J Affect Disord. 2008;105:93–99. doi: 10.1016/j.jad.2007.04.019. [DOI] [PubMed] [Google Scholar]
- 17.Blumberg HP, Fredericks C, Wang F, et al. Preliminary evidence for persistent abnormalities in amygdala volumes in adolescents and young adults with bipolar disorder. Bipolar Disord. 2005;7:570–576. doi: 10.1111/j.1399-5618.2005.00264.x. [DOI] [PMC free article] [PubMed] [Google Scholar]
- 18.Soares JC, Mann JJ. The anatomy of mood disorders- a review of structural neuroimaging studies. Biol Psychiatry. 1997;41:86–106. doi: 10.1016/s0006-3223(96)00006-6. [DOI] [PubMed] [Google Scholar]
- 19.Buchanan TW, Adolphs R. The role of the human amygdala in emotional modulation of long-term declarative memory. Ad Consciousness Res. 2002;44:9–34. [Google Scholar]
- 20.McClure EB, Pope K, Hoberman AJ, Pine DS, Leibenluft E. Facial expression recognition in adolescents with mood and anxiety disorders. Am J Psychiatry. 2003;160:1172–1174. doi: 10.1176/appi.ajp.160.6.1172. [DOI] [PubMed] [Google Scholar]
- 21.Brotman MA, Rich BA, Guyer AE, et al. Amygdala activation during emotion processing of neutral faces in children with severe mood dysregulation versus ADHD or bipolar disorder. Am J Psychiatry. 2010;167:61–69. doi: 10.1176/appi.ajp.2009.09010043. [DOI] [PMC free article] [PubMed] [Google Scholar]
- 22.Mourão-Miranda J, Almeida JR, Hassel S, et al. Pattern recognition analyses of brain activation elicited by happy and neutral faces in unipolar and bipolar depression. Bipolar Disord. 2012;14:451–460. doi: 10.1111/j.1399-5618.2012.01019.x. [DOI] [PMC free article] [PubMed] [Google Scholar]
- 23.Fu CH, Mourão-Miranda J, Costafreda SG, et al. Pattern classification of sad facial processing: toward the development of neurobiological markers in depression. Biol Psychiatry. 2008;63:656–662. doi: 10.1016/j.biopsych.2007.08.020. [DOI] [PubMed] [Google Scholar]
- 24.Chang K, Adleman NE, Dienes K, Simeonova DI, Menon V, Reiss A. Anomalous prefrontal-subcortical activation in familial pediatric bipolar disorder: a functional magnetic resonance imaging investigation. Arch Gen Psychiatry. 2004;61:781–792. doi: 10.1001/archpsyc.61.8.781. [DOI] [PubMed] [Google Scholar]
- 25.Chen BK, Sassi R, Axelson D, et al. Cross-sectional study of abnormal amygdala development in adolescents and young adults with bipolar disorder. Biol Psychiatry. 2004;56:399–405. doi: 10.1016/j.biopsych.2004.06.024. [DOI] [PubMed] [Google Scholar]
- 26.DelBello MP, Zimmerman ME, Mills NP, Getz GE, Strakowski SM. Magnetic resonance imaging analysis of amygdala and other subcortical brain regions in adolescents with bipolar disorder. Bipolar Disord. 2004;6:43–52. doi: 10.1046/j.1399-5618.2003.00087.x. [DOI] [PubMed] [Google Scholar]
- 27.Wilke M, Kowatch RA, DelBello MP, Mills NP, Holland SK. Voxel-based morphometry in adolescents with bipolar disorder: first results. Psychiatry Res. 2004;131:57–69. doi: 10.1016/j.pscychresns.2004.01.004. [DOI] [PubMed] [Google Scholar]
- 28.Strakowski SM, DelBello MP, Sax KW, et al. BRain magnetic resonance imaging of structural abnormalities in bipolar disorder. Arch Gen Psychiatry. 1999;56:254–260. doi: 10.1001/archpsyc.56.3.254. [DOI] [PubMed] [Google Scholar]
- 29.Gao W, Jiao Q, Qi R, et al. Combined analyses of gray matter voxel-based morphometry and white matter tract-based spatial statistics in pediatric bipolar mania. J Affect Disord. 2013;150:70–76. doi: 10.1016/j.jad.2013.02.021. [DOI] [PubMed] [Google Scholar]
- 30.Pavuluri MN, Birmaher B, Naylor MW. Pediatric bipolar disorder: a review of the past 10 years. J Am Acad Child Adolesc Psychiatry. 2005;44:846–871. doi: 10.1097/01.chi.0000170554.23422.c1. [DOI] [PubMed] [Google Scholar]
- 31.Mourao-Miranda J, Oliveira L, Ladouceur CD, et al. Pattern recognition and functional neuroimaging help to discriminate healthy adolescents at risk for mood disorders from low risk adolescents. PloS One. 2012;7:e29482. doi: 10.1371/journal.pone.0029482. [DOI] [PMC free article] [PubMed] [Google Scholar]
- 32.Mwangi B, Ebmeier KP, Matthews K, Steele JD. Multi-centre diagnostic classification of individual structural neuroimaging scans from patients with major depressive disorder. Brain. 2012;135:1508–1521. doi: 10.1093/brain/aws084. [DOI] [PubMed] [Google Scholar]
- 33.Mwangi B, Matthews K, Steele JD. Prediction of illness severity in patients with major depression using structural MR brain scans. J Magnet Resonance Imaging. 2011;35:64–71. doi: 10.1002/jmri.22806. [DOI] [PubMed] [Google Scholar]
- 34.Johnston BA, Mwangi B, Matthews K, Coghill D, Steele JD. Predictive classification of individual magnetic resonance imaging scans from children and adolescents. Eur Child Adolesc Psychiatry. 2013;22:733–744. doi: 10.1007/s00787-012-0319-0. [DOI] [PubMed] [Google Scholar]
- 35.Mwangi B, Hasan KM, Soares JC. Prediction of individual subject's age across the human lifespan using diffusion tensor imaging: a machine learning approach. Neuroimage. 2013;75:58–67. doi: 10.1016/j.neuroimage.2013.02.055. [DOI] [PubMed] [Google Scholar]
- 36.Hahn T, Marquand AF, Ehlis AC, et al. Integrating neurobiological markers of depression. Arch Gen Psychiatry. 2011;68:361–368. doi: 10.1001/archgenpsychiatry.2010.178. [DOI] [PubMed] [Google Scholar]
- 37.Rocha-Rego V, Jogia J, Marquand A, Mourao-Miranda J, Simmons A, Frangou S. Examination of the predictive value of structural magnetic resonance scans in bipolar disorder: a pattern classification approach. Psychol Med. 2014;44:519–532. doi: 10.1017/S0033291713001013. [DOI] [PMC free article] [PubMed] [Google Scholar]
- 38.Misaki M, Kim Y, Bandettini PA, Kriegeskorte N. Comparison of multivariate classifiers and response normalizations for pattern-information fMRI. Neuroimage. 2010;53:103–118. doi: 10.1016/j.neuroimage.2010.05.051. [DOI] [PMC free article] [PubMed] [Google Scholar]
- 39.Mwangi B, Tian TS, Soares JC. A review of feature reduction techniques in neuroimaging. Neuroinformatics. 2014;12:229–244. doi: 10.1007/s12021-013-9204-3. [DOI] [PMC free article] [PubMed] [Google Scholar]
- 40.Zou H, Hastie T. Regularization and variable selection via the elastic net. J Roy Statistic Soc B. 2005;67:301–320. [Google Scholar]
- 41.Friedman J, Hastie T, Tibshirani R. Regularization paths for generalized linear models via coordinate descent. J Stat Softw. 2010;33:1–22. [PMC free article] [PubMed] [Google Scholar]
- 42.Bitter SM, Mills NP, Adler CM, Strakowski SM, DelBello MP. Progression of amygdala volumetric abnormalities in adolescents after their first manic episode. J Am Acad Child Adolesc Psychiatry. 2011;50:1017–1026. doi: 10.1016/j.jaac.2011.07.001. [DOI] [PMC free article] [PubMed] [Google Scholar]
- 43.Ashburner J. A fast diffeomorphic image registration algorithm. Neuroimage. 2007;38:95–113. doi: 10.1016/j.neuroimage.2007.07.007. [DOI] [PubMed] [Google Scholar]
- 44.Maldjian JA, Laurienti PJ, Kraft RA, Burdette JH. An automated method for neuroanatomic and cytoarchitectonic atlas-based interrogation of fMRI data sets. Neuroimage. 2003;19:1233–1239. doi: 10.1016/s1053-8119(03)00169-1. [DOI] [PubMed] [Google Scholar]
- 45.Cremers H, van Tol MJ, Roelofs K, et al. Extraversion is linked to volume of the orbitofrontal cortex and amygdala. PloS One. 2011;6:e28421. doi: 10.1371/journal.pone.0028421. [DOI] [PMC free article] [PubMed] [Google Scholar]
- 46.Dannlowski U, Stuhrmann A, Beutelmann V, et al. Limbic scars: long-term consequences of childhood maltreatment revealed by functional and structural magnetic resonance imaging. Biol Psychiatry. 2012;71:286–293. doi: 10.1016/j.biopsych.2011.10.021. [DOI] [PubMed] [Google Scholar]
- 47.Asami T, Bouix S, Whitford TJ, Shenton ME, Salisbury DF, McCarley RW. Longitudinal loss of gray matter volume in patients with first-episode schizophrenia: DARTEL automated analysis and ROI validation. Neuroimage. 2012;59:986–996. doi: 10.1016/j.neuroimage.2011.08.066. [DOI] [PMC free article] [PubMed] [Google Scholar]
- 48.Bunea F, She Y, Ombao H, Gongvatana A, Devlin K, Cohen R. Penalized least squares regression methods and applications to neuroimaging. Neuroimage. 2011;55:1519–1527. doi: 10.1016/j.neuroimage.2010.12.028. [DOI] [PMC free article] [PubMed] [Google Scholar]
- 49.Kohannim O, Hibar DP, Jahanshad N, et al. Predicting temporal lobe volume on MRI from genotypes using L(1)-L(2) regularized regression. Proc IEEEE Int Symp Biomed Imaging. 2012:1160–1163. doi: 10.1109/ISBI.2012.6235766. [DOI] [PMC free article] [PubMed] [Google Scholar]
- 50.Savitz JB, Rauch SV, Drevets WC. Clinical application of brain imaging for the diagnosis of mood disorders: the current state of play. Mol Psychiatry. 2013;18:528–539. doi: 10.1038/mp.2013.25. [DOI] [PMC free article] [PubMed] [Google Scholar]
- 51.Sun D, van Erp TGM, Thompson PM, et al. Elucidating a magnetic resonance imaging-based neuroanatomic biomarker for psychosis: classification analysis using probabilistic brain atlas and machine learning algorithms. Biol Psychiatry. 2009;66:1055–1060. doi: 10.1016/j.biopsych.2009.07.019. [DOI] [PMC free article] [PubMed] [Google Scholar]
- 52.Habeck C, Stern Y. Alzheimer's Disease Neuroimaging Initiative. Multivariate data analysis for neuroimaging data: overview and application to Alzheimer's disease. Cell Biochem Biophys. 2010;58:53–67. doi: 10.1007/s12013-010-9093-0. [DOI] [PMC free article] [PubMed] [Google Scholar]
- 53.Chu C, Hsu AL, Chou KH, Bandettini P, Lin C. Does feature selection improve classification accuracy? Impact of sample size and feature selection on classification using anatomical magnetic resonance images. Neuroimage. 2012;60:59–70. doi: 10.1016/j.neuroimage.2011.11.066. [DOI] [PubMed] [Google Scholar]
- 54.Dosenbach NU, Nardos B, Cohen AL, et al. Prediction of individual brain maturity using fMRI. Science. 2010;329:1358–1361. doi: 10.1126/science.1194144. [DOI] [PMC free article] [PubMed] [Google Scholar]
- 55.Bowley MP, Drevets WC, Ongür D, Price JL. Low glial numbers in the amygdala in major depressive disorder. Biol Psychiatry. 2002;52:404–412. doi: 10.1016/s0006-3223(02)01404-x. [DOI] [PubMed] [Google Scholar]
- 56.Schumann CM, Bauman MD, Amaral DG. Abnormal structure or function of the amygdala is a common component of neurodevelopmental disorders. Neuropsychologia. 2011;49:745–759. doi: 10.1016/j.neuropsychologia.2010.09.028. [DOI] [PMC free article] [PubMed] [Google Scholar]
- 57.Bezchlibnyk YB, Sun X, Wang JF, MacQueen GM, McEwen BS, Young LT. Neuron somal size is decreased in the lateral amygdalar nucleus of subjects with bipolar disorder. J Psychiatry Neurosci. 2007;32:203–210. [PMC free article] [PubMed] [Google Scholar]
- 58.Bechdolf A, Wood SJ, Nelson B, et al. Amygdala and insula volumes prior to illness onset in bipolar disorder: a magnetic resonance imaging study. Psychiatry Res. 2012;201:34–39. doi: 10.1016/j.pscychresns.2011.06.010. [DOI] [PubMed] [Google Scholar]
- 59.Karchemskiy A, Garrett A, Howe M, et al. Amygdalar, hippocampal, and thalamic volumes in youth at high risk for development of bipolar disorder. Psychiatry Res. 2011;194:319–325. doi: 10.1016/j.pscychresns.2011.03.006. [DOI] [PMC free article] [PubMed] [Google Scholar]
- 60.Ladouceur CD, Almeida JR, Birmaher B, et al. Subcortical gray matter volume abnormalities in healthy bipolar offspring: potential neuroanatomical risk marker for bipolar disorder? J Am Acad Child Adolesc Psychiatry. 2008;47:532–539. doi: 10.1097/CHI.0b013e318167656e. [DOI] [PMC free article] [PubMed] [Google Scholar]
- 61.Singh MK, DelBello MP, Adler CM, Stanford KE, Strakowski SM. Neuroanatomical characterization of child offspring of bipolar parents. J Am Acad Child Adolescent Psychiatry. 2008;47:526–531. doi: 10.1097/CHI.0b013e318167655a. [DOI] [PMC free article] [PubMed] [Google Scholar]
- 62.Lyoo IK, Dager SR, Kim JE, et al. Lithium-induced gray matter volume increase as a neural correlate of treatment response in bipolar disorder: a longitudinal brain imaging study. Neuropsychopharmacology. 2010;35:1743–1750. doi: 10.1038/npp.2010.41. [DOI] [PMC free article] [PubMed] [Google Scholar]
- 63.Glahn DC, Bearden CE, Caetano S, et al. Declarative memory impairment in pediatric bipolar disorder. Bipolar Disord. 2005;7:546–554. doi: 10.1111/j.1399-5618.2005.00267.x. [DOI] [PubMed] [Google Scholar]
Associated Data
This section collects any data citations, data availability statements, or supplementary materials included in this article.