

Abstract

The purpose of this study was to examine whether the substitution of the Lys linker with the β-Ala could reduce the renal uptake of 99mTc-labeled Arg-X-Asp-conjugated and X-Ala-Asp-conjugated α-melanocyte stimulating hormone (α-MSH) peptides. RSD-β-Ala-(Arg11)CCMSH (1) {c[Arg-Ser-Asp-dTyr-Asp]-β-Ala-Cys-Cys-Glu-His-dPhe-Arg-Trp-Cys-Arg-Pro-Val-NH2}, RTD-β-Ala-(Arg11)CCMSH (2), RVD-β-Ala-(Arg11)CCMSH (3), RAD-β-Ala-(Arg11)CCMSH (4), NAD-β-Ala-(Arg11)CCMSH (5), and EAD-β-Ala-(Arg11)CCMSH (6) peptides were synthesized and evaluated for their melanocortin 1 (MC1) receptor binding affinities in B16/F1 melanoma cells. The biodistribution of their 99mTc-conjugates were determined in B16/F1 melanoma-bearing C57 mice. The substitution of the Lys linker with β-Ala linker dramatically reduced the renal uptake of all six 99mTc-peptides. 99mTc-4 exhibited the highest melanoma uptake (15.66 ± 6.19% ID/g) and the lowest kidney uptake (20.18 ± 3.86% ID/g) among these 99mTc-peptides at 2 h postinjection. The B16/F1 melanoma lesions could be clearly visualized by single photon emission computed tomography (SPECT)/CT using 99mTc-4 as an imaging probe.
Introduction
Melanocortin 1 (MC1) receptor is an attractive molecular target for melanoma imaging because of its overexpression on both murine and human melanoma cells.1−16 Recently, we have identified a class of 99mTc-labeled α-melanocyte stimulating hormone (α-MSH) peptides to target MC1 receptors for melanoma imaging. Specifically, the cyclic RXD motifs {Arg-X-Asp-dTyr-Asp, X = Gly, Ala, Val, Thr, Ser, Nle, Phe, and dPhe} were attached to [Cys3,4,10,d-Phe7,Arg11]α-MSH3–13 via a lysine linker to yield RXD-Lys-(Arg11)CCMSH peptides. Interestingly, single amino acid at the X position yielded a profound impact on the melanoma targeting and clearance properties of 99mTc-RXD-Lys-(Arg11)CCMSH peptides. For instance, the substitution of Gly in 99mTc-RGD-Lys-(Arg11)CCMSH with Ala, Thr, Val, and Ser improved the MC1 receptor binding affinities and enhanced the melanoma uptake in B16/F1 melanoma-bearing C57 mice.17−19 On the other hand, the substitution of Gly in 99mTc-RGD-Lys-(Arg11)CCMSH with Nle decreased the MC1 receptor binding affinity. Although the substitution of Gly in 99mTc-RGD-Lys-(Arg11)CCMSH with Phe and dPhe increased the MC1 receptor binding affinities, both 99mTc-RFD-Lys-(Arg11)CCMSH and 99mTc-RfD-Lys-(Arg11)CCMSH exhibited much higher liver uptake as compared to 99mTc-RGD-Lys-(Arg11)CCMSH.18
Despite the promising melanoma targeting results, extremely high renal uptake (67–135% ID/g at 2 h postinjection) is a common issue associated with 99mTc-RXD-Lys-(Arg11)CCMSH peptides.17−19 Thus, it is desirable to reduce the nonspecific renal uptake of 99mTc-RXD-Lys-(Arg11)CCMSH peptides to facilitate their potential therapeutic applications. In our previous reports, l-lysine co-injection significantly reduced the renal uptake of 99mTc-RXD-Lys-(Arg11)CCMSH peptides by 37%–51% at 2 h postinjection without affecting their tumor uptake.17−19l-Lysine is a positively charged amino acid. The effect of l-lysine co-injection in reducing the renal uptake indicated that the overall positive charges of 99mTc-RXD-Lys-(Arg11)CCMSH peptides contributed to their nonspecific renal uptake. Obviously, the substitution of the positively charged Lys linker with a neutral amino acid can decrease the overall charges of 99mTc-RXD-Lys-(Arg11)CCMSH peptides. According to the effect of l-lysine co-injection in decreasing the renal uptake, we hypothesized that the substitution of the Lys linker with a neutral β-Ala linker would decrease the renal uptake of 99mTc-RXD-Lys-(Arg11)CCMSH peptides. To examine our hypothesis, we synthesized six peptides with β-Ala linkers, namely, peptides 1–6. The MC1 receptor binding affinities of these six peptides were examined in B16/F1 melanoma cells. The peptides were readily radiolabeled with 99mTc using SnCl2 as a reducing agent. We further determined the biodistribution properties in B16/F1 melanoma-bearing C57 mice for these six 99mTc-peptides. Thereafter, we determined the imaging property of 99mTc-4 in B16/F1 melanoma-bearing C57 mice.
Results
The schematic structures of six new peptides are presented in Figure 1. The peptides were synthesized and purified by reverse phase-high performance liquid chromatography (RP-HPLC) according to our previously published procedures.17,18 The overall synthetic yields were 25–30% for all six peptides. The chemical purities of the peptides were greater than 95% after the HPLC purification (Table 1). The peptide identities were confirmed by electrospray mass spectrometry. The measured molecular weight was 2123 Da for peptide 1, 2137 Da for peptide 2, 2135 Da for peptide 3, 2107 Da for peptide 4, 2064 Da for peptide 5, and 2080 Da for peptide 6 (Table 1). The competitive binding curves of the peptides are shown in Figure 2. The IC50 value was 2.76 ± 0.51 nM for peptide 1, 1.56 ± 0.63 nM for peptide 2, 1.99 ± 0.16 nM for peptide 3, 0.35 ± 0.01 nM for peptide 4, 3.34 ± 0.28 nM for peptide 5, and 3.84 ± 0.71 nM for peptide 6 in B16/F1 melanoma cells, respectively.
Figure 1.

Schematic structures of RXD-β-Ala-(Arg11)CCMSH and XAD-β-Ala-(Arg11)CCMSH peptides.
Table 1. Capacity Factors, Chemical/Radiochemical Purities, and Measured Molecular Weights of the RXD-β-Ala-(Arg11)CCMSH and XAD-β-Ala-(Arg11)CCMSH Peptides and Their 99mTc-Conjugatesa.
| peptide and 99mTc-peptide | capacity factor (k′) | chemical/radiochemical purity (%) | measured molecular weight (Da) |
|---|---|---|---|
| 1 | 1.35 | 95 | 2123 |
| 2 | 0.98 | 95 | 2137 |
| 3 | 1.94 | 96 | 2135 |
| 4 | 3.32 | 97 | 2107 |
| 5 | 3.17 | 96 | 2064 |
| 6 | 2.28 | 96 | 2080 |
| 99mTc-1 | 3.34 | 99 | ND |
| 99mTc-2 | 3.29 | 98 | ND |
| 99mTc-3 | 3.40 | 99 | ND |
| 99mTc-4 | 4.18 | 98 | ND |
| 99mTc-5 | 4.63 | 98 | ND |
| 99mTc-6 | 3.47 | 98 | ND |
ND = not determined.
Figure 2.
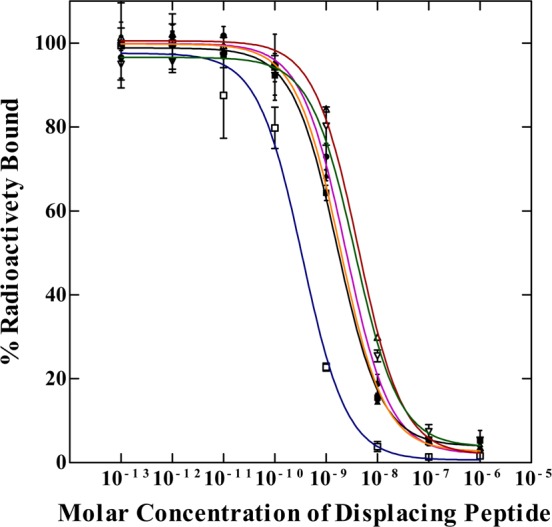
Competitive binding curves of peptide 1 (●, pink), peptide 2 (■, black), peptide 3 (▲, orange), peptide 4 (□, blue), peptide 5 (▽, green), and peptide 6 (△, red) in B16/F1 murine melanoma cells. The IC50 values were 2.76 ± 0.51 nM for peptide 1, 1.56 ± 0.63 nM for peptide 2, 1.99 ± 0.16 nM for peptide 3, 0.35 ± 0.01 nM for peptide 4, 3.34 ± 0.28 nM for peptide 5, and 3.84 ± 0.71 nM for peptide 6.
All six peptides were readily radiolabeled with 99mTc with greater than 95% radiolabeling yields. The 99mTc-peptides were separated from their excess nonlabeled peptides by RP-HPLC. The specific activities of 99mTc-1, 99mTc-2, 99mTc-3, 99mTc-4, 99mTc-5, and 99mTc-6 were 8.62 × 10⁹, 8.57 × 10⁹, 8.57 × 10⁹, 8.68 × 10⁹, 8.85 × 10⁹, 8.79 × 10⁹ MBq/g, respectively. The retention times of 99mTc-1, 99mTc-2, 99mTc-3, 99mTc-4, 99mTc-5, and 99mTc-6 were 13.1, 13.0, 14.1, 13.7, 17.0, and 14.2 min, respectively. All six 99mTc-peptides were stable in mouse serum at 37 °C for 24 h (Figure 3).
Figure 3.

Radioactive HPLC profiles of 99mTc-1 (A), 99mTc-2 (B), 99mTc-3 (C), 99mTc-4 (D), 99mTc-5 (E), and 99mTc-6 (F) in mouse serum after incubation at 37 °C for 24 h. The arrows denote the original retention times of 99mTc-1 (13.1 min), 99mTc-2 (13.0 min), 99mTc-3 (14.1 min), 99mTc-4 (13.7 min), 99mTc-5 (17.0 min), and 99mTc-6 (14.2 min), prior to the incubation in mouse serum.
The melanoma targeting and pharmacokinetic properties of 99mTc-1, 99mTc-2, 99mTc-3, 99mTc-4, 99mTc-5, and 99mTc-6 are shown in Tables 2–7. All six 99mTc-peptides exhibited similar tumor uptake pattern in B16/F1 melanoma-bearing C57 mice. The highest tumor uptake appeared either at 2 or 4 h postinjection. Among these six 99mTc-peptides, 99mTc-4 showed the highest tumor uptake of 15.66 ± 6.19% ID/g at 2 h postinjection. The tumor uptake of 99mTc-4 gradually decreased to 14.67 ± 3.81 and 7.79 ± 2.68% ID/g at 4 and 24 h postinjection. Co-injection of 10 μg (6.1 nM) of nonradiolabeled NDP-MSH with 99mTc-4 decreased the tumor uptake to 2.43 ± 0.53% ID/g at 2 h postinjection, demonstrating that the tumor uptake was MC1 receptor-mediated.
Table 2. Biodistribution of 99mTc-1 in B16/F1 Melanoma-Bearing C57 Micea.
| tissue | 0.5 h | 2 h | 4 h | 24 h | 2 h NDP |
|---|---|---|---|---|---|
| Percentage Injected Dose/Gram (% ID/g) | |||||
| tumor | 9.64 ± 1.52 | 9.62 ± 1.53 | 12.15 ± 2.36 | 3.62 ± 1.10 | 1.12 ± 0.01*b |
| brain | 0.15 ± 0.01 | 0.02 ± 0.01 | 0.02 ± 0.02 | 0.02 ± 0.01 | 0.02 ± 0.01 |
| blood | 2.66 ± 0.84 | 0.50 ± 0.14 | 0.06 ± 0.02 | 0.61 ± 0.46 | 0.03 ± 0.01 |
| heart | 1.56 ± 0.13 | 0.23 ± 0.04 | 0.10 ± 0.06 | 0.07 ± 0.03 | 0.17 ± 0.01 |
| lung | 3.85 ± 0.40 | 0.64 ± 0.15 | 0.34 ± 0.11 | 0.29 ± 0.12 | 0.48 ± 0.06 |
| liver | 1.41 ± 0.13 | 0.74 ± 0.08 | 0.86 ± 0.08 | 0.31 ± 0.08 | 0.57 ± 0.05 |
| skin | 3.07 ± 1.85 | 0.52 ± 0.40 | 0.32 ± 0.13 | 0.48 ± 0.24 | 0.29 ± 0.18 |
| spleen | 1.34 ± 0.15 | 0.32 ± 0.05 | 0.35 ± 0.05 | 0.18 ± 0.06 | 0.22 ± 0.06 |
| stomach | 1.83 ± 0.20 | 0.62 ± 0.17 | 0.77 ± 0.21 | 0.32 ± 0.16 | 0.62 ± 0.23 |
| kidneys | 30.5 ± 5.18 | 28.73 ± 3.40 | 28.70 ± 5.22 | 8.12 ± 2.34 | 13.67 ± 2.54*b |
| muscle | 0.25 ± 0.02 | 0.04 ± 0.03 | 0.02 ± 0.01 | 0.05 ± 0.02 | 0.05 ± 0.07 |
| pancreas | 0.68 ± 0.28 | 0.11 ± 0.01 | 0.04 ± 0.02 | 0.04 ± 0.01 | 0.08 ± 0.01 |
| bone | 0.93 ± 0.45 | 0.19 ± 0.06 | 0.05 ± 0.01 | 0.42 ± 0.28 | 0.16 ± 0.09 |
| Percentage Injected Dose (% ID) | |||||
| intestines | 1.71 ± 0.21 | 1.11 ± 0.60 | 1.59 ± 0.41 | 0.63 ± 0.19 | 0.76 ± 0.23 |
| urine | 53.37 ± 4.23 | 68.46 ± 9.28 | 83.96 ± 0.88 | 84.33 ± 3.37 | 90.95 ± 0.59 |
| Uptake Ratio of Tumor/Normal Tissue | |||||
| tumor/blood | 3.62 | 19.24 | 202.50 | 5.93 | 37.33 |
| tumor/kidneys | 0.32 | 0.33 | 0.42 | 0.45 | 0.08 |
| tumor/lung | 2.50 | 15.03 | 35.74 | 12.48 | 2.33 |
| tumor/liver | 6.84 | 13.00 | 14.13 | 11.68 | 1.96 |
| tumor/muscle | 38.56 | 240.50 | 607.50 | 72.40 | 22.40 |
The data are presented as percent injected dose/gram or as percent injected dose (mean ± SD, n = 4).
(∗) p < 0.05 for determining the significance of differences in tumor and kidney uptake between 99mTc-1 with or without NDP-MSH peptide blockade at 2 h postinjection.
Table 7. Biodistribution of 99mTc-6 in B16/F1 Melanoma-Bearing C57 Micea.
| tissue | 0.5 h | 2 h | 4 h | 24 h | 2 h NDP |
|---|---|---|---|---|---|
| Percentage Injected Dose/Gram (% ID/g) | |||||
| tumor | 12.25 ± 1.86 | 10.13 ± 3.60 | 13.36 ± 4.12 | 3.71 ± 1.59 | 1.20 ± 0.25*b |
| brain | 0.15 ± 0.01 | 0.02 ± 0.01 | 0.01 ± 0.01 | 0.01 ± 0.01 | 0.01 ± 0.01 |
| blood | 5.94 ± 1.42 | 0.86 ± 0.04 | 0.38 ± 0.12 | 0.08 ± 0.01 | 0.47 ± 0.01 |
| heart | 1.73 ± 0.35 | 0.44 ± 0.08 | 0.35 ± 0.03 | 0.14 ± 0.08 | 0.29 ± 0.15 |
| lung | 3.50 ± 1.96 | 2.57 ± 1.00 | 1.35 ± 0.51 | 0.35 ± 0.08 | 1.73 ± 0.74 |
| liver | 2.06 ± 0.73 | 1.08 ± 0.41 | 0.93 ± 0.16 | 0.26 ± 0.08 | 0.86 ± 0.03 |
| skin | 5.92 ± 0.76 | 0.55 ± 0.03 | 0.64 ± 0.05 | 0.24 ± 0.02 | 0.86 ± 0.15 |
| spleen | 1.95 ± 1.15 | 0.59 ± 0.25 | 0.49 ± 0.18 | 0.14 ± 0.11 | 0.26 ± 0.05 |
| stomach | 2.91 ± 1.36 | 0.70 ± 0.12 | 0.89 ± 0.06 | 0.12 ± 0.02 | 1.16 ± 0.30 |
| kidneys | 25.65 ± 8.27 | 25.25 ± 9.26 | 24.37 ± 7.66 | 4.12 ± 1.14 | 25.93 ± 1.62 |
| muscle | 0.85 ± 0.26 | 0.05 ± 0.03 | 0.03 ± 0.01 | 0.10 ± 0.08 | 0.04 ± 0.04 |
| pancreas | 0.72 ± 0.39 | 0.14 ± 0.07 | 0.06 ± 0.04 | 0.02 ± 0.01 | 0.07 ± 0.02 |
| bone | 1.43 ± 0.32 | 0.27 ± 0.12 | 0.07 ± 0.03 | 0.14 ± 0.06 | 0.10 ± 0.05 |
| Percentage Injected Dose (% ID) | |||||
| intestines | 2.19 ± 0.72 | 1.38 ± 0.92 | 2.29 ± 0.66 | 0.55 ± 0.16 | 2.51 ± 0.34 |
| urine | 42.67 ± 21.25 | 75.09 ± 11.87 | 86.51 ± 3.43 | 92.30 ± 1.33 | 85.18 ± 0.53 |
| Uptake Ratio of Tumor/Normal Tissue | |||||
| tumor/blood | 2.06 | 11.78 | 35.16 | 46.38 | 2.55 |
| tumor/kidneys | 0.48 | 0.40 | 0.55 | 0.90 | 0.05 |
| tumor/lung | 3.50 | 3.94 | 9.90 | 10.60 | 0.69 |
| tumor/liver | 5.95 | 9.38 | 14.37 | 14.27 | 1.40 |
| tumor/muscle | 14.41 | 202.60 | 445.33 | 37.10 | 30.00 |
The data are presented as percent injected dose/gram or as percent injected dose (mean ± SD, n = 4).
(∗) p < 0.05 for determining the significance of differences in tumor and kidney uptake between 99mTc-6 with or without NDP-MSH peptide blockade at 2 h postinjection.
Kidneys were the excretion routes for all six 99mTc-peptides. Among these six 99mTc-peptides, 99mTc-4 showed the lowest renal uptake of 20.18 ± 3.86% ID/g at 2 h postinjection. The renal uptake of 99mTc-4 gradually decreased to 19.83 ± 6.34 and 3.92 ± 0.99% ID/g at 4 and 24 h postinjection. Co-injection of 10 μg (6.1 nM) of nonradiolabeled NDP-MSH with 99mTc-4 did not significantly reduce the renal uptake (p > 0.05) at 2 h postinjection, indicating that the renal uptake was nonspecific. The substitution of the positively charged Lys linker with the neutral β-Ala dramatically decreased the renal uptake of 99mTc-RXD-β-Ala-(Arg11)CCMSH peptides. Interestingly, further reduction of the overall positive charges of 99mTc-5 and 99mTc-6 did not decrease the renal uptake further as compared to 99mTc-4. All six 99mTc-peptides displayed fast urinary clearance. Approximately 68–78% of 99mTc-peptides cleared through the urinary system by 2 h postinjection, whereas approximately 77–86% of 99mTc-peptides washed out through the urinary system by 4 h postinjection. The effect of l-lysine co-injection on the renal uptake of 99mTc-4 at 2 h postinjection is presented in Figure 4. Co-injection of 15 mg of l-lysine significantly (p < 0.05) reduced the renal uptake of 99mTc-4 from 20.18 ± 3.86% ID/g to 13.06 ± 3.62% ID/g without significantly affecting the tumor uptake at 2 h postinjection.
Figure 4.

Effect of l-lysine co-injection on the tumor and kidney uptake of 99mTc-4 at 2 h postinjection. The blue and green columns represent the tumor and renal uptake of 99mTc-4 without and with l-lysine co-injection: (∗) p < 0.05 for determining the significance of differences in tumor and kidney uptake between 99mTc-4 without and with l-lysine co-injection.
Table 3. Biodistribution of 99mTc-2 in B16/F1 Melanoma-Bearing C57 Micea.
| tissue | 0.5 h | 2 h | 4 h | 24 h | 2 h NDP |
|---|---|---|---|---|---|
| Percentage Injected Dose/Gram (% ID/g) | |||||
| tumor | 13.29 ± 2.36 | 13.85 ± 1.43 | 9.40 ± 2.86 | 5.23 ± 1.81 | 1.19 ± 0.30*b |
| brain | 0.20 ± 0.01 | 0.02 ± 0.01 | 0.01 ± 0.01 | 0.01 ± 0.01 | 0.01 ± 0.01 |
| blood | 7.53 ± 0.99 | 1.48 ± 0.02 | 0.27 ± 0.17 | 0.06 ± 0.05 | 3.69 ± 0.01 |
| heart | 2.38 ± 1.75 | 0.27 ± 0.07 | 0.14 ± 0.05 | 0.09 ± 0.02 | 0.22 ± 0.01 |
| lung | 4.61 ± 3.16 | 0.53 ± 0.13 | 0.30 ± 0.01 | 0.16 ± 0.03 | 0.39 ± 0.14 |
| liver | 1.36 ± 0.10 | 0.78 ± 0.02 | 0.73 ± 0.07 | 0.43 ± 0.11 | 0.61 ± 0.08 |
| skin | 6.44 ± 2.64 | 1.33 ± 0.59 | 0.22 ± 0.15 | 0.22 ± 0.04 | 0.38 ± 0.08 |
| spleen | 1.19 ± 0.58 | 0.31 ± 0.15 | 0.27 ± 0.14 | 0.23 ± 0.06 | 0.21 ± 0.07 |
| stomach | 2.01 ± 0.72 | 0.83 ± 0.23 | 0.66 ± 0.20 | 0.37 ± 0.26 | 0.92 ± 0.37 |
| kidneys | 35.79 ± 2.11 | 28.60 ± 5.14 | 26.17 ± 4.83 | 11.50 ± 2.81 | 18.09 ± 1.89*b |
| muscle | 0.46 ± 0.19 | 0.06 ± 0.05 | 0.02 ± 0.01 | 0.03 ± 0.03 | 0.04 ± 0.01 |
| pancreas | 1.25 ± 1.00 | 0.11 ± 0.09 | 0.02 ± 0.02 | 0.05 ± 0.03 | 0.07 ± 0.03 |
| bone | 0.90 ± 0.90 | 0.29 ± 0.20 | 0.09 ± 0.07 | 0.11 ± 0.06 | 0.11 ± 0.04 |
| Percentage Injected Dose (% ID) | |||||
| intestines | 2.28 ± 1.24 | 0.93 ± 0.21 | 1.29 ± 0.47 | 2.03 ± 1.42 | 0.84 ± 0.22 |
| urine | 53.46 ± 7.42 | 77.83 ± 2.83 | 84.94 ± 2.10 | 90.45 ± 3.66 | 90.63 ± 2.07 |
| Uptake Ratio of Tumor/Normal Tissue | |||||
| tumor/blood | 1.76 | 9.36 | 34.81 | 87.17 | 0.32 |
| tumor/kidneys | 0.37 | 0.48 | 0.36 | 0.45 | 0.07 |
| tumor/lung | 2.88 | 26.13 | 31.33 | 32.69 | 3.05 |
| tumor/liver | 9.77 | 17.76 | 12.88 | 12.16 | 1.95 |
| tumor/muscle | 28.89 | 230.83 | 470.00 | 174.33 | 29.75 |
The data are presented as percent injected dose/gram or as percent injected dose (mean ± SD, n = 4).
(∗) p < 0.05 for determining the significance of differences in tumor and kidney uptake between 99mTc-2 with or without NDP-MSH peptide blockade at 2 h postinjection.
Table 4. Biodistribution of 99mTc-3 in B16/F1 Melanoma-Bearing C57 Micea.
| tissue | 0.5 h | 2 h | 4 h | 24 h | 2 h NDP |
|---|---|---|---|---|---|
| Percentage Injected Dose/Gram (% ID/g) | |||||
| tumor | 12.49 ± 2.10 | 13.11 ± 4.78 | 11.18 ± 2.76 | 4.66 ± 1.92 | 1.30 ± 0.46*b |
| brain | 0.14 ± 0.01 | 0.03 ± 0.01 | 0.01 ± 0.01 | 0.03 ± 0.02 | 0.02 ± 0.01 |
| blood | 6.11 ± 0.56 | 0.78 ± 0.06 | 0.14 ± 0.08 | 0.06 ± 0.01 | 0.43 ± 0.01 |
| heart | 1.99 ± 0.11 | 0.35 ± 0.07 | 0.15 ± 0.02 | 0.08 ± 0.02 | 0.32 ± 0.06 |
| lung | 2.61 ± 0.26 | 1.13 ± 0.09 | 0.41 ± 0.13 | 0.11 ± 0.02 | 0.64 ± 0.12 |
| liver | 2.22 ± 0.05 | 1.36 ± 0.33 | 1.62 ± 0.34 | 0.50 ± 0.06 | 1.34 ± 0.23 |
| skin | 4.86 ± 2.81 | 0.98 ± 0.44 | 0.16 ± 0.07 | 0.34 ± 0.05 | 0.82 ± 0.18 |
| spleen | 1.36 ± 0.38 | 0.27 ± 0.14 | 0.31 ± 0.09 | 0.08 ± 0.02 | 0.34 ± 0.08 |
| stomach | 2.82 ± 0.60 | 1.02 ± 0.48 | 0.85 ± 0.29 | 0.39 ± 0.15 | 1.74 ± 0.27 |
| kidneys | 30.77 ± 2.40 | 30.37 ± 6.04 | 27.03 ± 0.71 | 7.58 ± 1.78 | 17.96 ± 5.92 |
| muscle | 0.44 ± 0.11 | 0.17 ± 0.05 | 0.02 ± 0.02 | 0.14 ± 0.04 | 0.12 ± 0.07 |
| pancreas | 0.76 ± 0.36 | 0.14 ± 0.01 | 0.10 ± 0.06 | 0.08 ± 0.06 | 0.10 ± 0.11 |
| bone | 0.46 ± 0.12 | 0.60 ± 0.38 | 0.09 ± 0.09 | 0.17 ± 0.15 | 0.10 ± 0.05 |
| Percentage Injected Dose (% ID) | |||||
| intestines | 1.89 ± 0.32 | 0.87 ± 0.22 | 1.33 ± 0.47 | 1.00 ± 0.59 | 0.90 ± 0.17 |
| urine | 49.29 ± 2.66 | 74.19 ± 7.90 | 84.10 ± 4.44 | 84.47 ± 6.30 | 86.59 ± 4.94 |
| Uptake Ratio of Tumor/Normal Tissue | |||||
| tumor/blood | 2.04 | 16.81 | 79.86 | 77.67 | 3.02 |
| tumor/kidneys | 0.41 | 0.43 | 0.41 | 0.61 | 0.07 |
| tumor/lung | 4.79 | 11.60 | 27.27 | 42.36 | 2.03 |
| tumor/liver | 5.63 | 9.64 | 6.90 | 9.32 | 0.97 |
| tumor/muscle | 28.39 | 77.12 | 559.00 | 33.29 | 10.83 |
The data are presented as percent injected dose/gram or as percent injected dose (mean ± SD, n = 4).
(∗) p < 0.05 for determining the significance of differences in tumor and kidney uptake between 99mTc-3 with or without NDP-MSH peptide blockade at 2 h postinjection.
Table 5. Biodistribution of 99mTc-4 in B16/F1 Melanoma-Bearing C57 Micea.
| tissue | 0.5 h | 2 h | 4 h | 24 h | 2 h NDP |
|---|---|---|---|---|---|
| Percentage Injected Dose/Gram (% ID/g) | |||||
| tumor | 12.55 ± 3.37 | 15.66 ± 6.19 | 14.67 ± 3.81 | 7.79 ± 2.68 | 2.43 ± 0.53*b |
| brain | 0.19 ± 0.04 | 0.05 ± 0.01 | 0.03 ± 0.01 | 0.05 ± 0.05 | 0.02 ± 0.02 |
| blood | 3.82 ± 0.62 | 1.01 ± 0.42 | 0.60 ± 0.29 | 0.46 ± 0.44 | 0.51 ± 0.10 |
| heart | 2.28 ± 0.29 | 0.90 ± 0.34 | 0.69 ± 0.33 | 0.31 ± 0.21 | 0.73 ± 0.23 |
| lung | 7.22 ± 1.60 | 3.15 ± 0.79 | 2.34 ± 1.19 | 1.01 ± 0.48 | 3.12 ± 1.13 |
| liver | 2.39 ± 0.62 | 1.09 ± 0.13 | 1.05 ± 0.26 | 0.56 ± 0.23 | 1.17 ± 0.33 |
| skin | 5.50 ± 0.60 | 1.38 ± 0.41 | 0.70 ± 0.13 | 0.42 ± 0.24 | 1.29 ± 0.42 |
| spleen | 1.39 ± 0.51 | 0.80 ± 0.31 | 0.55 ± 0.34 | 0.60 ± 0.38 | 0.64 ± 0.43 |
| stomach | 7.11 ± 2.20 | 2.61 ± 1.04 | 1.88 ± 0.63 | 0.44 ± 0.20 | 2.88 ± 0.65 |
| kidneys | 25.64 ± 4.06 | 20.18 ± 3.86 | 19.83 ± 6.34 | 3.92 ± 0.99 | 19.82 ± 9.39 |
| muscle | 0.90 ± 0.48 | 0.23 ± 0.14 | 0.18 ± 0.11 | 0.34 ± 0.32 | 0.17 ± 0.08 |
| pancreas | 0.84 ± 0.35 | 0.29 ± 0.09 | 0.12 ± 0.08 | 0.20 ± 0.14 | 0.14 ± 0.05 |
| bone | 1.60 ± 0.27 | 0.59 ± 0.16 | 0.24 ± 0.20 | 0.50 ± 0.42 | 0.33 ± 0.20 |
| Percentage Injected Dose (% ID) | |||||
| intestines | 2.93 ± 0.44 | 2.58 ± 1.25 | 1.90 ± 0.39 | 0.89 ± 1.10 | 1.46 ± 0.26 |
| urine | 49.54 ± 2.65 | 78.28 ± 2.36 | 83.80 ± 3.67 | 94.25 ± 1.90 | 83.61 ± 5.94 |
| Uptake Ratio of Tumor/Normal Tissue | |||||
| tumor/blood | 3.29 | 15.50 | 24.45 | 16.93 | 4.76 |
| tumor/kidneys | 0.49 | 0.78 | 0.74 | 1.99 | 0.12 |
| tumor/lung | 1.74 | 4.97 | 6.27 | 7.71 | 0.78 |
| tumor/liver | 5.25 | 14.37 | 13.97 | 13.91 | 2.08 |
| tumor/muscle | 13.94 | 68.09 | 81.50 | 22.91 | 14.29 |
The data are presented as percent injected dose/gram or as percent injected dose (mean ± SD, n = 4).
(∗) p < 0.05 for determining the significance of differences in tumor and kidney uptake between 99mTc-4 with or without NDP-MSH peptide blockade at 2 h postinjection.
Table 6. Biodistribution of 99mTc-5 in B16/F1 Melanoma-Bearing C57 Micea.
| tissue | 0.5 h | 2 h | 4 h | 24 h | 2 h NDP |
|---|---|---|---|---|---|
| Percentage Injected Dose/Gram (% ID/g) | |||||
| tumor | 9.93 ± 2.37 | 11.38 ± 1.29 | 10.81 ± 5.48 | 4.17 ± 1.14 | 2.06 ± 0.85*b |
| brain | 0.25 ± 0.04 | 0.01 ± 0.01 | 0.02 ± 0.01 | 0.01 ± 0.01 | 0.05 ± 0.01 |
| blood | 6.12 ± 2.22 | 1.02 ± 0.48 | 0.87 ± 0.43 | 0.14 ± 0.02 | 1.22 ± 0.01 |
| heart | 3.34 ± 0.47 | 0.62 ± 0.03 | 0.56 ± 0.31 | 0.11 ± 0.03 | 0.48 ± 0.25 |
| lung | 8.93 ± 0.54 | 2.31 ± 0.55 | 1.28 ± 0.27 | 0.74 ± 0.30 | 1.92 ± 0.41 |
| liver | 3.11 ± 0.82 | 1.67 ± 0.39 | 1.37 ± 0.45 | 0.50 ± 0.08 | 1.93 ± 0.77 |
| skin | 6.11 ± 1.06 | 1.14 ± 0.23 | 0.62 ± 0.10 | 0.16 ± 0.04 | 1.47 ± 0.68 |
| spleen | 2.56 ± 0.86 | 0.76 ± 0.21 | 0.55 ± 0.08 | 0.20 ± 0.13 | 0.33 ± 0.20 |
| stomach | 4.23 ± 0.38 | 1.14 ± 0.37 | 0.75 ± 0.06 | 0.25 ± 0.09 | 2.11 ± 0.84 |
| kidneys | 35.68 ± 2.10 | 37.23 ± 9.69 | 32.68 ± 6.55 | 8.39 ± 2.56 | 22.48 ± 9.23 |
| muscle | 1.37 ± 0.37 | 0.06 ± 0.06 | 0.15 ± 0.04 | 0.05 ± 0.01 | 0.39 ± 0.29 |
| pancreas | 1.43 ± 0.76 | 0.22 ± 0.08 | 0.01 ± 0.01 | 0.01 ± 0.01 | 0.25 ± 0.14 |
| bone | 2.09 ± 0.64 | 0.35 ± 0.29 | 0.03 ± 0.01 | 0.09 ± 0.07 | 0.19 ± 0.08 |
| Percentage Injected Dose (% ID) | |||||
| intestines | 2.40 ± 0.36 | 2.84 ± 1.98 | 4.77 ± 3.46 | 0.59 ± 0.18 | 2.28 ± 0.78 |
| urine | 31.78 ± 3.81 | 73.27 ± 5.41 | 77.67 ± 5.88 | 93.77 ± 1.03 | 74.78 ± 10.44 |
| Uptake Ratio of Tumor/Normal Tissue | |||||
| tumor/blood | 1.62 | 11.16 | 12.43 | 29.79 | 1.69 |
| tumor/kidneys | 0.28 | 0.31 | 0.33 | 0.50 | 0.09 |
| tumor/lung | 1.11 | 4.93 | 8.45 | 5.64 | 1.07 |
| tumor/liver | 3.19 | 6.81 | 7.89 | 8.34 | 1.07 |
| tumor/muscle | 7.25 | 189.67 | 72.07 | 83.40 | 5.28 |
The data are presented as percent injected dose/gram or as percent injected dose (mean ± SD, n = 4).
(∗) p < 0.05 for determining the significance of differences in tumor and kidney uptake between 99mTc-5 with or without NDP-MSH peptide blockade at 2 h postinjection.
Because 99mTc-4 showed the highest tumor uptake and the lowest renal uptake than the other five 99mTc-peptides at 2 h postinjection, we further determined the tumor imaging property, specificity of tumor uptake, and urinary metabolites of 99mTc-4 in B16/F1 melanoma-bearing C57 mice. Whole-body SPECT/CT image at 2 h postinjection is presented in Figure 5. Flank B16/F1 melanoma lesions were clearly visualized by SPECT using 99mTc-4 as an imaging probe. The SPECT image of tumor accurately matched its anatomical location obtained in the CT image. The SPECT image showed high contrast of tumor to normal organ except for kidneys, which was consistent with the biodistribution results. As shown in Figure 5, the tumor uptake was blocked by unlabeled NDP-MSH, demonstrating that the tumor uptake was receptor-mediated. The urinary metabolites of 99mTc-4 at 2 h postinjection are shown in Figure 6. 99mTc-4 remained intact in the urine at 2 h postinjection.
Figure 5.
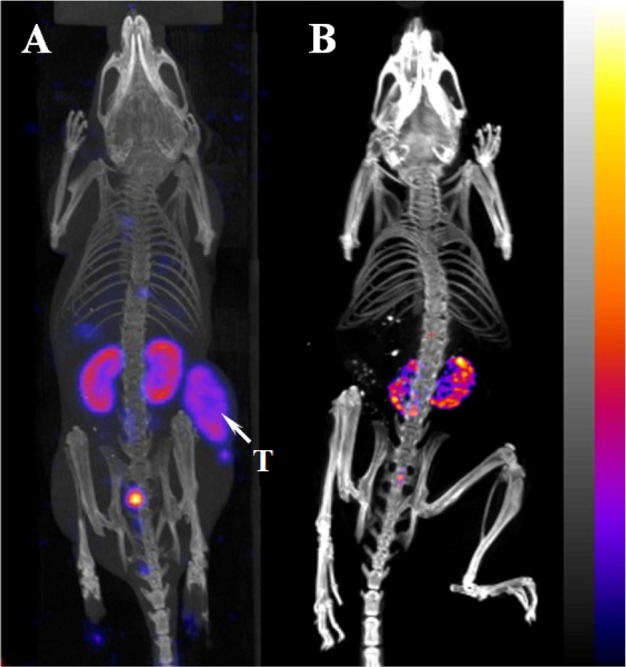
Representative whole-body SPECT/CT image of B16/F1 melanoma-bearing C57 mice 2 h after injection of 99mTc-4 without (A) and with (B) peptide blockade. Flank melanoma lesions (T) are highlighted with an arrow on the image.
Figure 6.

Radioactive HPLC profiles of urinary metabolites at 2 h postinjection of 99mTc-4. The arrow denotes the original retention time of 99mTc-4 prior to tail vein injection.
Discussion
In our previous reports,17−19 we have found the importance of single amino acid at the X position in the tumor targeting properties of 99mTc-RXD-Lys-(Arg11)CCMSH peptides in B16/F1 melanoma-bearing C57 mice. Specifically, the substitution of Gly in 99mTc-RGD-Lys-(Arg11)CCMSH with Ala, Thr, Val, and Ser improved the MC1 receptor binding affinities and enhanced the melanoma uptake in B16/F1 melanoma-bearing C57 mice.17−19 Despite the promising melanoma targeting results associated with 99mTc-RXD-Lys-(Arg11)CCMSH peptides, it is desirable to reduce the nonspecific renal uptake (67–135% ID/g at 2 h postinjection) of 99mTc-RXD-Lys-(Arg11)CCMSH peptides to facilitate their potential therapeutic applications. In this study, we substituted the positively charged Lys linker with the neutral β-Ala linker to determine whether such linker change could reduce the renal uptake of 99mTc-RXD-β-Ala-(Arg11)CCMSH peptides. Furthermore, we replaced the RAD moiety with NAD and EAD moieties to examine whether the further reduction of the overall positive changes of 99mTc-NAD-β-Ala-(Arg11)CCMSH and 99mTc-EAD-β-Ala-(Arg11)CCMSH could decrease their renal uptake further.
The substitution of Lys linker with β-Ala linker slightly affected the receptor binding affinities of RXD-β-Ala-(Arg11)CCMSH peptides. The receptor binding affinities of RXD-β-Ala-(Arg11)CCMSH peptides were approximately 2-fold weaker than RXD-Lys-(Arg11)CCMSH peptides, respectively. Despite the fact that the -His-dPhe-Arg-Trp- motif is the binding moiety for the MC1 receptor, the decrease in receptor binding affinity with the β-Ala linker substitution indicated that the linker might somehow interact with the receptor binding moiety. Such interaction might be related to the side chain of the Lys linker. The decrease in receptor binding affinities of RXD-β-Ala-(Arg11)CCMSH peptides also resulted in the reduction in tumor uptake of 99mTc-RXD-β-Ala-(Arg11)CCMSH peptides by 21–45% in B16/F1 melanoma-bearing C57 mice. Specifically, the tumor uptake of 99mTc-4 was 79% of the tumor uptake of 99mTc-RAD-Lys-(Arg11)CCMSH at 2 h postinjection.19
The substitution of Lys linker with β-Ala linker dramatically decreased the renal uptake of 99mTc-RXD-β-Ala-(Arg11)CCMSH peptides by 64–79% in B16/F1 melanoma-bearing C57 mice. For instance, the renal uptake of 99mTc-4 was only 22% of the renal uptake of 99mTc-RAD-Lys-(Arg11)CCMSH at 2 h postinjection.19 It is worthwhile to note that there is a positively charged Arg residue in the RAD moiety of 99mTc-4. Thus, we were interested in whether the replacement of Arg with Nle (neutral) and Glu (negatively charged) could further decrease the renal uptake of 99mTc-5 and 99mTc-6 as compared to 99mTc-4. Interestingly, the replacement of Arg with Nle and Glu did not further decrease the renal uptake of 99mTc-5 and 99mTc-6 as compared to 99mTc-4. Clearly, the tumor targeting and clearance properties of 99mTc-4 were more favorable than the other 99mTc-peptides investigated in this study. Thus, we further examined its melanoma imaging property and urinary metabolites. The B16/F1 melanoma lesions could be clearly visualized by SPECT/CT using 99mTc-4 as an imaging probe.
At the present time, 99mTc-(Arg11)CCMSH and 99mTc(EDDA)-HYNIC-GGNle-CycMSHhex were reported as promising cyclic imaging probes for melanoma.12,20 Remarkably, 99mTc-4 displayed comparably high melanoma uptake (14.67 ± 3.81% ID/g) as 99mTc-(Arg11)CCMSH and 99mTc(EDDA)-HYNIC-GGNle-CycMSHhex at 4 h postinjection. However, the renal uptake of 99mTc-4 was higher than those of 99mTc-(Arg11)CCMSH (11.66 ± 1.44% ID/g) and 99mTc(EDDA)-HYNIC-GGNle-CycMSHhex (7.52 ± 0.96% ID/g). The difference in renal uptake was likely due to the structural differences among these 99mTc-peptides. Interestingly, we found that l-lysine co-injection significantly reduced the renal uptake of 99mTc-4 by 35% at 2 h postinjection without affecting its tumor uptake significantly (Figure 4). Therefore, l-lysine co-injection could be utilized to further decrease the renal uptake of 188Re-RAD-Lys-(Arg11)CCMSH to facilitate its potential therapeutic application.
Conclusions
The substitution of the Lys linker with the β-Ala linker dramatically decreased the renal uptake of 99mTc-RXD-β-Ala-(Arg11)CCMSH peptides. Among these six 99mTc-peptides, 99mTc-4 exhibited the highest tumor uptake and the lowest renal uptake at 2 h postinjection. The replacement of Arg with Nle and Glu did not further decrease the renal uptake of 99mTc-5 and 99mTc-6 as compared to 99mTc-4. The tumor targeting and clearance properties of 99mTc-4 highlighted it as a lead peptide for future studies.
Experimental Section
Chemicals and Reagents
Amino acids and resin were purchased from Advanced ChemTech Inc. (Louisville, KY) and Novabiochem (San Diego, CA). 125I-Tyr2-[Nle4,dPhe7]-α-MSH {125I-(Tyr2)-NDP-MSH} was obtained from PerkinElmer, Inc. (Waltham, MA) for receptor binding assay. 99mTcO4– was purchased from Cardinal Health (Albuquerque, NM). All other chemicals used in this study were purchased from Thermo Fischer Scientific (Waltham, MA) and used without further purification. B16/F1 murine melanoma cells were obtained from American Type Culture Collection (Manassas, VA).
Peptide Synthesis and in Vitro Competitive Binding Assay
Six new peptides were synthesized using fluorenylmethyloxycarbonyl (Fmoc) chemistry according to our previously published procedures17−19 with slight modification on Sieber amide resin by an Advanced ChemTech multiple-peptide synthesizer (Louisville, KY). Briefly, 70 μmol of Sieber amide resin and 210 μmol of Fmoc-protected amino acids were used for the synthesis. Fmoc-β-Ala was used to generate a β-Ala linker in each peptide. Intermediate scaffolds of H2N-Arg(Pbf)-Ser/Thr/Val-Asp(OtBu)-dTyr(tBu)-Asp(O-2-phenylisopropyl)-β-Ala-Cys(Trt)-Cys(Trt)-Glu(OtBu)-His(Trt)-dPhe-Arg(Pbf)-Trp(Boc)-Cys(Trt)-Arg(Pbf)-Pro-Val and H2N-Arg(Pbf)/Nle/Glu(OtBu)/-Ala-Asp(OtBu)-dTyr(tBu)-Asp(O-2-phenylisopropyl)-β-Ala-Cys(Trt)-Cys(Trt)-Glu(OtBu)-His(Trt)-dPhe-Arg(Pbf)-Trp(Boc)-Cys(Trt)-Arg(Pbf)-Pro-Val were synthesized on Sieber amide resin. The protecting group of 2-phenylisopropyl of each scaffold was removed, and each peptide was cleaved from the resin treating with a mixture of 2.5% of trifluoroacetic acid (TFA) and 5% of triisopropylsilane. After the precipitation with ice-cold ether and characterization by MS, each protected peptide was dissolved in H2O/CH3CN (50:50) and lyophilized to remove the reagents such as TFA and triisopropylsilane. Each protected peptide was further cyclized by coupling the carboxylic group from the Asp with the α amino group from the Arg, Nle, or Glu at the N-terminus. The cyclization reaction was achieved by overnight reaction in dimethylformamide (DMF) using benzotriazole-1-yl-oxy-tris-pyrrolidinophosphonium hexafluorophosphate (PyBOP) as a coupling agent in the presence of N,N-diisopropylethylamine (DIPEA). The protecting groups were totally removed by treating with a mixture of TFA, thioanisole, phenol, water, ethanedithiol, and triisopropylsilane (87.5:2.5:2.5:2.5:2.5:2.5) for 2 h at room temperature (25 °C). Each peptide was precipitated and washed with ice-cold ether four times, purified by RP-HPLC, and characterized by liquid chromatography–mass spectrometry (LC–MS). The chemical purity of each peptide was determined by Waters RP-HPLC instrument (Milford, MA) on a Grace Vydac C-18 reverse phase analytic column (Deerfield, IL) using a 20 min gradient of 18–28% acetonitrile in 20 mM HCl aqueous solution at a flow rate of 1 mL/min. The purities of all six peptides were greater than 95%.
The IC50 values of the peptides for the MC1 receptor were determined in B16/F1 melanoma cells. The competitive receptor binding assay was replicated in triplicate for each peptide. The B16/F1 cells were seeded into a 24-well cell culture plate at a density of 2.5 × 10⁵ cells/well and incubated at 37 °C overnight. After being washed with binding medium {modified Eagle’s medium with 25 mM N-(2-hydroxyethyl)piperazine-N′-(2-ethanesulfonic acid) (HEPES), pH 7.4, 0.2% bovine serum albumin (BSA), 0.3 mM 1,10-phenathroline}, the cells were incubated at 25 °C for 2 h with approximately 30 000 counts per minute (cpm) of 125I-(Tyr2)-NDP-MSH in the presence of increasing concentrations (10–13–10–6 M) of each peptide in 0.3 mL of binding medium. The reaction medium was aspirated after the incubation. The cells were rinsed twice with 0.5 mL of ice-cold, pH 7.4, 0.2% BSA/0.01 M phosphate buffered saline (PBS) to remove any unbound radioactivity and lysed in 0.5 mL of 1 M NaOH for 5 min. The activities associated with the cells were measured in a Wallac 2480 automated γ counter (PerkinElmer, NJ). The IC50 value for each peptide was calculated using Prism software (GraphPad Software, La Jolla, CA). The standard deviation of IC50 value was generated by two independent experiments in triplicate for each peptide.
Peptide Radiolabeling
The peptides were labeled with 99mTc via a direct reduction reaction using SnCl2 as a reducing agent. Briefly, 10 μL of 1 mg/mL SnCl2 in 0.1 M HCl, 40 μL of 0.5 M NH4OAc (pH 5.2), 100 μL of 0.2 M Na2 tartate (pH 9.2), 100 μL of fresh 99mTcO4– solution (37–74 MBq), and 10 μL of 1 mg/mL of each peptide in aqueous solution were added into a reaction vial and incubated at 25 °C for 20 min to form the 99mTc-labeled peptide. Each 99mTc-peptide was purified to a single species by Waters RP-HPLC (Milford, MA) on a Grace Vydac C-18 reverse phase analytic column (Deerfield, IL) using a 20 min gradient of 18–28% acetonitrile in 20 mM HCl aqueous solution at a flow rate of 1 mL/min. Each purified peptide was purged with N2 gas for 20 min to remove the acetonitrile. The pH of final peptide solution was adjusted to 7.4 with 0.1 N NaOH and sterile normal saline for stability, biodistribution, and imaging studies. The serum stabilities of 99mTc-1, 99mTc-2, 99mTc-3, 99mTc-4, 99mTc-5, and 99mTc-6 were determined by incubation in mouse serum at 37 °C for 24 h and monitored for degradation by RP-HPLC. Briefly, 100 μL of each HPLC-purified peptide solution (∼7.4 MBq) was added into 100 μL of mouse serum (Sigma-Aldrich Corp, St. Louis, MO) and incubated at 37 °C for 24 h. After the incubation, 200 μL of a mixture of ethanol and acetonitrile (v:v = 1:1) was added to precipitate the serum proteins. The resulting mixture was centrifuged at 16000g for 5 min to collect the supernatant. The supernatant was purged with N2 gas for 30 min to remove the ethanol and acetonitrile. The resulting sample was mixed with 500 μL of water and injected into RP-HPLC for analysis using the gradient described above.
Biodistribution Studies
All the animal studies were conducted in compliance with Institutional Animal Care and Use Committee approval (12-100851-HSC). The biodistribution properties of the 99mTc-peptides were determined in B16/F1 melanoma-bearing C57 female mice (Harlan, Indianapolis, IN). Each C57 mouse was subcutaneously inoculated on the right flank with 1 × 10⁶ B16/F1 cells. The weight of tumors reached approximately 0.2 g at 10 days after cell inoculation. Each melanoma-bearing mouse was injected with 0.037 MBq of each 99mTc-peptide via the tail vein. Groups of four mice were sacrificed at 0.5, 2, 4, and 24 h postinjection, and tumors and organs of interest were harvested, weighed, and counted. Blood values were taken as 6.5% of the body weight. The specificity of tumor uptake was determined by co-injecting each 99mTc-peptide with 10 μg (6.1 nmol) of unlabeled NDP-MSH at 2 h postinjection.
The effect of l-lysine co-injection on the renal uptake of 99mTc-4 was examined in B16/F1 melanoma-bearing C57. A group of four mice were injected with an aqueous mixture of 0.037 MBq of 99mTc-4 and 15 mg of l-lysine. The mice were sacrificed at 2 h postinjection, and tumor and kidneys were harvested, weighed, and counted.
Melanoma Imaging with 99mTc-4
99mTc-4 was the lead peptide because of its highest tumor uptake and the lowest renal uptake. Thus, we further determined the melanoma imaging property of 99mTc-4 and the specificity of melanoma uptake. Approximately 3.7–4.1 MBq of 99mTc-4 with or without 10 μg (6.1 nmol) of unlabeled NDP-MSH was injected into B16/F1 melanoma-bearing C57 mice via the tail vein, respectively. The mice were euthanized for small animal SPECT/CT (Nano-SPECT/CT, Bioscan, Washington, DC) imaging 2 h postinjection. The 9 min CT imaging was immediately followed by the SPECT imaging of whole body. The SPECT scans of 24 projections were acquired. Reconstructed data from SPECT and CT were visualized and co-registered using InVivoScope (Bioscan, Washington, DC).
Urinary Metabolites of 99mTc-4
We also examined the urinary metabolites of 99mTc-4. Approximately 3.7 MBq of 99mTc-4 was injected into a B16/F1 melanoma-bearing C57 mouse via the tail vein to determine the urinary metabolites. The mouse was euthanized to collect urine at 2 h postinjection. The collected urine sample was centrifuged at 16000g for 5 min before the HPLC analysis. Thereafter, an aliquot of the urine was injected into the HPLC. A 20 min gradient of 16–26% acetonitrile/20 mM HCl with a flow rate of 1 mL/min was used for urine analysis.
Statistical Analysis
Statistical analysis was performed using the Student’s t test for unpaired data to determine the significance of differences in tumor and kidney uptake with/without peptide blockade in biodistribution studies described above. Differences at the 95% confidence level (p < 0.05) were considered significant.
Acknowledgments
We appreciate Dr. Fabio Gallazzi for his technical assistance. This work was supported in part by NIH Grant NM-INBRE P20RR016480/P20GM103451 and UNM RAC Award. The images were generated by the KUSAIR established with funding from the W. M. Keck Foundation and the UNM Cancer Research and Treatment Center (Grant NIH P30 CA118100).
Glossary
Abbreviations Used
- MC1
melanocortin 1
- α-MSH
α-melanocyte stimulating hormone
- RXD motif
Arg-X-Asp-dTyr-Asp
- Fmoc
fluorenylmethyloxycarbonyl
- TFA
trifluoroacetic acid
- DMF
dimethylformamide
- PyBOP
benzotriazole-1-yl-oxy-tris-pyrrolidinophosphonium hexafluorophosphate
- DIPEA
N,N-diisopropylethylamine
- LC–MS
liquid chromatography–mass spectrometry
- HEPES
N-(2-hydroxyethyl)piperazine-N′-(2-ethanesulfonic acid)
- BSA
bovine serum albumin
- PBS
phosphate buffered saline
- SPECT
single photon emission computed tomography
The authors declare no competing financial interest.
Funding Statement
National Institutes of Health, United States
References
- Siegrist W.; Solca F.; Stutz S.; Giuffre L.; Carrel S.; Girard J.; Eberle A. N. Characterization of receptors for alpha-melanocyte-stimulating hormone on human melanoma cells. Cancer Res. 1989, 49, 6352–6358. [PubMed] [Google Scholar]
- Tatro J. B.; Atkins M.; Mier J. W.; Hardarson S.; Wolfe H.; Smith T.; Entwistle M. L.; Reichlin S. Melanotropin receptors demonstrated in situ in human melanoma. J. Clin. Invest. 1990, 85, 1825–1832. [DOI] [PMC free article] [PubMed] [Google Scholar]
- Miao Y.; Whitener D.; Feng W.; Owen N. K.; Chen J.; Quinn T. P. Evaluation of the human melanoma targeting properties of radiolabeled alpha-melanocyte stimulating hormone peptide analogues. Bioconjugate Chem. 2003, 14, 1177–1184. [DOI] [PubMed] [Google Scholar]
- Guo H.; Shenoy N.; Gershman B. M.; Yang J.; Sklar L. A.; Miao Y. Metastatic melanoma imaging with an 111In-labeled lactam bridge-cyclized alpha-melanocyte-stimulating hormone peptide. Nucl. Med. Biol. 2009, 36, 267–276. [DOI] [PMC free article] [PubMed] [Google Scholar]
- Yang J.; Guo H.; Miao Y. Technetium-99m-labeled Arg-Gly-Asp-conjugated alpha-melanocyte stimulating hormone hybrid peptides for human melanoma imaging. Nucl. Med. Biol. 2010, 37, 873–883. [DOI] [PMC free article] [PubMed] [Google Scholar]
- Giblin M. F.; Wang N.; Hoffman T. J.; Jurisson S. S.; Quinn T. P. Design and characterization of alpha-melanotropin peptide analogs cyclized through rhenium and technetium metal coordination. Proc. Natl. Acad. Sci. U.S.A. 1998, 95, 12814–12818. [DOI] [PMC free article] [PubMed] [Google Scholar]
- Froidevaux S.; Calame-Christe M.; Tanner H.; Sumanovski L.; Eberle A. N. A novel DOTA-alpha-melanocyte-stimulating hormone analog for metastatic melanoma diagnosis. J. Nucl. Med. 2002, 43, 1699–1706. [PubMed] [Google Scholar]
- Froidevaux S.; Calame-Christe M.; Schuhmacher J.; Tanner H.; Saffrich R.; Henze M.; Eberle A. N. A gallium-labeled DOTA-α-melanocyte-stimulating hormone analog for PET imaging of melanoma metastases. J. Nucl. Med. 2004, 45, 116–123. [PubMed] [Google Scholar]
- McQuade P.; Miao Y.; Yoo J.; Quinn T. P.; Welch M. J.; Lewis J. S. Imaging of melanoma using 64Cu- and 86Y-DOTA-ReCCMSH(Arg11), a cyclized peptide analogue of alpha-MSH. J. Med. Chem. 2005, 48, 2985–2992. [DOI] [PubMed] [Google Scholar]
- Wei L.; Butcher C.; Miao Y.; Gallazzi F.; Quinn T. P.; Welch M. J.; Lewis J. S. Synthesis and biologic evaluation of 64Cu-labeled rhenium-cyclized alpha-MSH peptide analog using a cross-bridged cyclam chelator. J. Nucl. Med. 2007, 48, 64–72. [PubMed] [Google Scholar]
- Cheng Z.; Xiong Z.; Subbarayan M.; Chen X.; Gambhir S. S. 64Cu-labeled alpha-melanocyte-stimulating hormone analog for microPET imaging of melanocortin 1 receptor expression. Bioconjugate Chem. 2007, 18, 765–772. [DOI] [PMC free article] [PubMed] [Google Scholar]
- Miao Y.; Benwell K.; Quinn T. P. 99mTc- and 111In-labeled alpha-melanocyte-stimulating hormone peptides as imaging probes for primary and pulmonary metastatic melanoma detection. J. Nucl. Med. 2007, 48, 73–80. [PubMed] [Google Scholar]
- Miao Y.; Figueroa S. D.; Fisher D. R.; Moore H. A.; Testa R. F.; Hoffman T. J.; Quinn T. P. 203Pb-labeled alpha-melanocyte-stimulating hormone peptide as an imaging probe for melanoma detection. J. Nucl. Med. 2008, 49, 823–829. [DOI] [PMC free article] [PubMed] [Google Scholar]
- Miao Y.; Gallazzi F.; Guo H.; Quinn T. P. 111In-labeled lactam bridge-cyclized alpha-melanocyte stimulating hormone peptide analogues for melanoma imaging. Bioconjugate Chem. 2008, 19, 539–547. [DOI] [PMC free article] [PubMed] [Google Scholar]
- Guo H.; Yang J.; Gallazzi F.; Miao Y. Reduction of the ring size of radiolabeled lactam bridge-cyclized alpha-MSH peptide resulting in enhanced melanoma uptake. J. Nucl. Med. 2010, 51, 418–426. [DOI] [PMC free article] [PubMed] [Google Scholar]
- Guo H.; Yang J.; Gallazzi F.; Miao Y. Effects of the amino acid linkers on melanoma-targeting and pharmacokinetic properties of indium-111-labeled lactam bridge-cyclized α-MSH peptides. J. Nucl. Med. 2011, 52, 608–616. [DOI] [PMC free article] [PubMed] [Google Scholar]
- Flook A. M.; Yang J.; Miao Y. Evaluation of new Tc-99m-labeled Arg-X-Asp-conjugated alpha-melanocyte stimulating hormone peptides for melanoma imaging. Mol. Pharmaceutics 2013, 10, 3417–3424. [DOI] [PMC free article] [PubMed] [Google Scholar]
- Flook A. M.; Yang J.; Miao Y. Effects of amino acids on melanoma targeting and clearance properties of Tc-99m-labeled Arg-X-Asp-conjugated alpha-melanocyte stimulating hormone peptides. J. Med. Chem. 2013, 56, 8793–8802. [DOI] [PMC free article] [PubMed] [Google Scholar]
- Yang J.; Miao Y. Substitution of Gly with Ala enhanced the melanoma uptake of technetium-99m-labeled Arg-Ala-Asp-conjugated alpha-melanocyte stimulating hormone peptide. Bioorg. Med. Chem. Lett. 2012, 22, 1541–1545. [DOI] [PMC free article] [PubMed] [Google Scholar]
- Guo H.; Fabio Gallazzi F.; Miao Y. Design and evaluation of Tc-99m-labeled lactam bridge-cyclized alpha-MSH peptides for melanoma imaging. Mol. Pharmaceutics 2013, 10, 1400–1408. [DOI] [PMC free article] [PubMed] [Google Scholar]