

Significance
We provide, to our knowledge, the first in vivo quantitative description of the adaptive response of the mitochondrial reticulum to the metabolic transition occurring in the liver in the hours after feeding. When nutrients become limiting, mitochondria size, cristae density, and respiratory capacity drop, but mitochondria–ER contacts, which control calcium and lipids fluxes between these organelles, double. A proteolytic inactivation of Optic atrophy 1 (Opa1), a major regulator of fusion and cristae architecture, accompanies these changes and found to depend on Mitofusin-2, a key regulator of mitochondria–ER contact biogenesis. Thus, mitochondria adapt to nutrient depletion by coupling the molecular machineries that organize cristae architecture and mitochondria–ER contact assembly, which were previously thought to operate independently of each other.
Keywords: mitochondria, Opa1, Mfn2, mTORC1, mitochondria–ER contacts
Abstract
Hepatic metabolism requires mitochondria to adapt their bioenergetic and biosynthetic output to accompany the ever-changing anabolic/catabolic state of the liver cell, but the wiring of this process is still largely unknown. Using a postprandial mouse liver model and quantitative cryo-EM analysis, we show that when the hepatic mammalian target of rapamycin complex 1 (mTORC1) signaling pathway disengages, the mitochondria network fragments, cristae density drops by 30%, and mitochondrial respiratory capacity decreases by 20%. Instead, mitochondria–ER contacts (MERCs), which mediate calcium and phospholipid fluxes between these organelles, double in length. These events are associated with the transient expression of two previously unidentified C-terminal fragments (CTFs) of Optic atrophy 1 (Opa1), a mitochondrial GTPase that regulates cristae biogenesis and mitochondria dynamics. Expression of Opa1 CTFs in the intermembrane space has no effect on mitochondria morphology, supporting a model in which they are intermediates of an Opa1 degradation program. Using an in vitro assay, we show that these CTFs indeed originate from the cleavage of Opa1 at two evolutionarily conserved consensus sites that map within critical folds of the GTPase. This processing of Opa1, termed C-cleavage, is mediated by the activity of a cysteine protease whose activity is independent from that of Oma1 and presenilin-associated rhomboid-like (PARL), two known Opa1 regulators. However, C-cleavage requires Mitofusin-2 (Mfn2), a key factor in mitochondria–ER tethering, thereby linking cristae remodeling to MERC assembly. Thus, in vivo, mitochondria adapt to metabolic shifts through the parallel remodeling of the cristae and of the MERCs via a mechanism that degrades Opa1 in an Mfn2-dependent pathway.
The last decade expanded our understanding of the importance of mitochondrial shape, position, and interorganellar interactions in the regulation of cell stress. For example, mitochondrial hyperfusion is a stress response that protects against cell death and autophagic degradation, whereas chronic stress triggers mitochondrial fragmentation and cell death. However, the in vivo implications of mitochondrial plasticity under normal physiological conditions are still largely unknown. The liver is a key organ responsible for nutrient sensing and the maintenance of whole-body energy homeostasis. Therefore, we considered the liver as a primary model to examine the changes in mitochondrial plasticity that accompanies physiological transitions in feeding and postprandial metabolism (1–4).
The mechanistic target of rapamycin complex 1 (mTORC1) is an evolutionary conserved serine/threonine kinase that plays an important role in regulating metabolism and cell growth in response to anabolic signals (5). Studies indicate that mTORC1, which is activated by growth factors and amino acids, is a key sensor allowing cells and tissues to adapt their metabolism in response to the nutritional state (5). In the liver, it controls the activation of various metabolic processes including lipogenesis (6) and ketogenesis (3). Recent observations indicate that mTORC1 regulates mitochondrial biogenesis and metabolism (7, 8), but the underlying mechanisms remain to be determined.
It has been established that the core machinery that governs mitochondrial shape and ultrastructure is essential. Indeed, genetic ablation of its components, which includes the outer mitochondrial membrane (OMM) fusion GTPase Mitofusin-1 (Mfn1) and Mfn2 (9) as well as the inner mitochondrial membrane (IMM) GTPase Optic atrophy 1 (Opa1) (10), is embryonic lethal. Similarly, the loss of the core fission GTPase Drp1 is also lethal (11). Tissue-specific deletions of these genes, including the liver (12, 13), are now emerging and lead to more complex phenotypes (14); however, these models will not inform us on the adaptive mitochondrial response to metabolic changes.
Mitochondria cristae shape changes from the “orthodox” state, when oxidative phosphorylation is low, to a more “condensed” form in high respiratory conditions. The mechanisms that regulate these changes have emerged in cultured models (15), but have not been followed within tissues in vivo. The inner membrane GTPase Opa1 has been shown to regulate mitochondrial fusion and cristae architecture (16), where loss of Opa1 in cultured mouse embryonic or adult fibroblast cells compromised the function and assembly of the respiratory chain complexes. Further, recent studies have shown that Opa1 ablation in the liver leads to a loss of cristae (13). However, Opa1 function is complex and can also promote mitochondrial fragmentation (17). Upon mitochondrial dysfunction or depolarization, an inner membrane protease called Oma1 becomes activated, cleaving Opa1 into a short, soluble form that then promotes mitochondrial fragmentation (18, 19). Interestingly, mice lacking Oma1 are not embryonic lethal; rather, they show a metabolic phenotype where they become obese, accompanied by hepatic steatosis when placed on a high fat diet (20). This result is of critical importance because it hints at a major role of Opa1 proteolysis in metabolic adaptation and connects it to the emerging notion that central regulators of mitochondria mitochondria–ER tethering, like Mfn2, might also be central to this process (12). To shed light on this possibility, in this study we have used an in vivo mouse model to link changes in the structure of the mitochondria–ER contacts (MERCs) to that of the cristae. Our findings support a model where mitochondria adapt to the postprandial loss of mTORC1 signaling by activating an Mfn2-dependent degradation program of Opa1. Thus, mitochondria adapt to postprandial metabolic transitions by coupling the machineries that organize cristae architecture and MERC assembly, which were previously thought to operate independently of each other.
Results
Postprandial Loss of Hepatic mTORC1 Signaling Is Accompanied by Mitochondrial Fragmentation, Loss of Cristae, and Expansion of the MERCs.
The period between meals is called the postprandial state. Postprandial mouse models are widely accepted to study in vivo hepatic mTORC1 signaling (1–4); in this tissue, mTORC1 is active when the ribosomal protein S6 is phosphorylated at residues Ser240/244 (hereby referred as phospho-S6) and is inactive when these two amino acids are not phosphorylated (3). For this study, we developed a postprandial protocol (Fig. 1A and Fig. S1A) where hepatic phospho-S6 typically drops between 4 and 5 h postprandial (Fig. 1 B and C) without, however, leading to the activation of the autophagy program (Fig. S2D).
Fig. 1.

Postprandial loss of mTORC1 signaling is linked to the fragmentation of the mitochondrial network. (A) Schematic representation of the postprandial model used in this study. (B) Immunoblot analysis of the livers used for the cryo-EM study shown in D–H. (C) Loss of hepatic phospho-S6 signal occurs between 4 and 6 h postprandial. (D) Representative liver cryo-EM image. (E–H) Effect of the change in phospho-S6 level on mitochondria number, area, and morphology. Data represent mean ± SEM (SE of mean). *P < 0.05; ***P < 0.001.
We used this postprandial model to assess in vivo whether mitochondrial mass and morphology change during the metabolic shift that culminates in loss of hepatic phospho-S6. To stratify the samples based on the state of mTORC1 activity, we performed cryo-EM analysis on the livers of two groups of mice (n = 3). In the first group, the animals were killed at 2 h postprandial and had high hepatic phospho-S6; in the second group, the animals were killed at 5 h and had low hepatic phospho-S6 (Fig. 1B and Fig. S2A).
In these livers, the total number of mitochondria was calculated as the average sum of organelles present in cryo-EM images of 660 μm2 each (Fig. 1D; n = 14 per group). We found that at 5 h the mitochondrial population increases by ∼25% (120 vs. 152 per image of 660 μm2; P < 0.05; Fig. 1E). The total mitochondrial area does not change between the two groups of animals (Fig. 1F, Left); however, at 5 h postprandial, the area of the individual mitochondrion decreases by ∼10% (0.42 vs. 0.38 μm2; P < 0.001; Fig. 1F, Right, and Fig. S2B). This change is due to a shift in mitochondria size distribution toward rounder (Fig. 1G), shorter organelles (Fig. 1H), thereby indicating the occurrence of mitochondrial fragmentation. Noteworthy, with respect to the size class distribution of the organelles, at 5 h postprandial, intermediate levels of hepatic phospho-S6 (Fig. S2E) result in an intermediate mitochondrial phenotype (Fig. 1H), supporting a model where mitochondria morphology remodels in parallel to the metabolic transition linked to the loss of mTORC1 signaling.
In a subset of mitochondria analyzed above (n = 54), we then measured the number, density, and length of the cristae (Fig. 2A). Data showed that at 5 h postprandial cristae density drops ∼30% (5.2 vs. 3.7 μm/μm2; P < 0.001; Fig. 2B). This corresponds to a similar decrease in the number of cristae (41 vs. 28 μm/μm2; P < 0.001; Fig. 2C), but not to a change in the average length of each crista (Fig. S2C), indicating a loss in cristae number rather than reduced cristae extension. Consistent with this finding, we found that mitochondria isolated from livers at 5 h postprandial and energized with pyruvate/malate have ∼20% less state 3 respiration than at 2 h postprandial (95 vs. 78 pmol/min/μg; P < 0.05). However, basal respiration remained similar (Fig. 2D), indicating that the loss of cristae that accompanies the disengagement of the mTORC1 pathway reduces the overall respiratory capacity of the organelle. Noteworthy, at 2 and 5 h postprandial, liver mitochondria energized with succinate did not show a significant difference in state 3 respiration, a finding that is consistent with a recent study reporting that Opa1-mediated changes in cristae architecture do not affect respiration driven by this substrate (13).
Fig. 2.
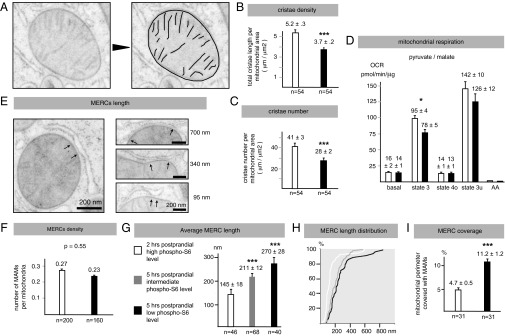
Postprandial loss of mTORC1 signaling is accompanied by decreased cristae density and respiration and augmented MERC length. (A) Representative image and analysis of liver mitochondria used to study cristae number and density. (B and C) Effect of the change in phospho-S6 level on mitochondria cristae number and density. (D) Oxygen consumption rate (OCR) of liver mitochondria energized with 10 mM pyruvate + 2 mM malate. Data represent mean ± SEM of five independent experiments. (E) Representative image of the MERCs analyzed in this study. Arrows indicate the two extremities of the MERC, which are defined as the structures where the cytosolic side of the OMM interfaces the ribosome-free ER membrane with a gap of 9–15 nm between these two membranes (21). (F–I) Effect of the change in phospho-S6 level on MERC number, size density, and mitochondria coverage. Data represent mean ± SEM. *P < 0.05; ***P < 0.001.
In the same liver cryo-EM samples in which we performed the cristae analysis, we then analyzed MERC number, size, and mitochondrial surface coverage. Here, MERCs were manually identified according to two well-established criteria: being ribosome-free and having a gap of 9–15 nm between the OMM and the ER (21) (Fig. 2E). Data showed that the level of hepatic phospho-S6 does not impact the number of MERCs per mitochondria (MERC density, 1 in 4 mitochondria had one MERC; Fig. 2F). However, with low phospho-S6, the average MERC length nearly doubles (145 vs. 270 nm; P < 0.001; Fig. 2G) due to a sweeping increase in the length of each MERC (Fig. 2H). As a result, the percentage of the mitochondrial perimeter covered by MERCs increases by 140%, shifting from 4.7% to 11.2% (P < 0.001; Fig. 2I).
To corroborate the role of the mTORC1 signaling in MERC remodeling, we next investigated the length of the MERCs in the livers of four mice that, at 5 h postprandial, showed an intermediate level of phospho-S6 signal (Fig. S2E). In these samples, the average MERC length was in between that observed with a high and low phospho-S6 signal, respectively (Fig. 2 G and H). All together these findings indicate that mitochondria adapt to changes in nutrient availability through an extensive and parallel remodeling of the cristae and of the MERCs.
Expression of Opa1 CTF-1 and CTF-2 upon Loss of mTORC1 Signaling.
Given the role of Opa1 in cristae biogenesis and remodeling (13, 16), we investigated the pattern of expression of the GTPase in the livers analyzed by cryo-EM at 2 and 5 h postprandial. In these samples, Opa1 appears to remain substantially unchanged (Fig. S2D). This observation raised the possibility that transient changes in Opa1 expression might have occurred before the drop in cristae density that accompanies the postprandial inhibition of the hepatic mTORC1 pathway (Fig. 2B). To address this possibility, we investigated Opa1 in the liver of the large cohort of animals on which we previously performed the phospho-S6 analysis (Fig. 1C). To this goal, we used a panel of anti-Opa1 antibodies that included a well-established monoclonal antibody (13, 19, 22) whose epitope maps within amino acid 708–830 of the protein.
Data showed two new forms of Opa1 in seven of the 25 mice with low or no hepatic phospho-S6 at 5 h postprandial (Fig. 3 A and B); we named them C-terminal fragment-1 and -2, respectively (CTF-1, ∼78 kDa; CTF-2, ∼48 kDa). Importantly, Opa1 CTFs were never observed in the livers of mice with high phospho-S6, whether at 2, 4, or 5 h postprandial (62 animals, in total; Figs. 1C and 3B). These findings suggested that Opa1 CTFs expression is transient and linked to the inhibition of the mTORC1 pathway. To test this possibility, we turned to a cultured model of mouse embryonic fibroblasts (MEFs) in which we pharmacologically inhibited mTORC1 with rapamycin. Data showed the transient appearance of Opa1 CTF-1 10 mins after rapamycin started to reduce the phospho-S6 signal (Fig. 3C), thereby linking the expression of these forms of Opa1 to mTORC inhibition.
Fig. 3.
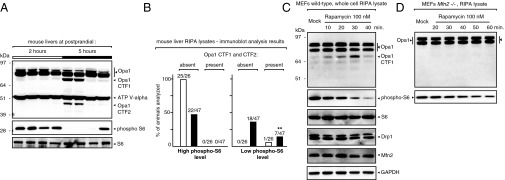
Transient expression of Opa1 CTFs upon loss of mTORC1 signaling. (A and B) Opa1 CTF-1 and CTF-2 are only present in mouse livers that at postprandial 5 h have low or no hepatic phospho-S6 signal. The immunoblot analysis shown in A is representative of the results shown in B, which summarizes the data obtained from a large cohort of animals (73 mice analyzed). **P < 0.01. (C and D) Rapamycin activates the transient expression of Opa1 CTF-1 in wild-type but not Mfn2−/− MEFs.
In the mouse liver, only four Opa1 mRNAs are expressed, none of which encodes CTF-1 or -2 (23). Further, analysis of the murine genomic and EST databases did not show evidence of cryptic promoter(s) and alternative splicing sites that could justify the expression of these forms of Opa1. We conclude that CTF-1 and -2 derive from proteolytic processing of Opa1, which we name C-cleavage.
Opa1 C-cleavage could be reconstituted in vitro using an assay that consisted of incubating crude mitochondria with 0.5–1% of either digitonin (DIG) or n-Dodecyl-β-d-Maltoside (DDM), two mild nonionic detergents that are also used to permeabilize mitochondria and isolate active IMM-bound ATP synthase complexes. Here, Opa1 proteolysis occurs within a few minutes at low temperature (Fig. S3A), yielding fragments that have the same electrophoretic mobility of endogenous liver and rapamycin-stimulated CTFs (Fig. 4 A and B). Interestingly, whereas DIG mostly yields CTF-1, DDM preferentially generates CTF-2 (Fig. 4A); the reason for this, however, is unclear. DDM also yields a low amount of a smaller ∼44-kDa Opa1 fragment that, however, was never detected in vivo and is, therefore, unspecific (Fig. 4A). Importantly, the appearance of CTF-1 and -2 is accompanied by the loss of long and short forms of endogenous Opa1 (Fig. S3 A and B), indicating that, in vitro, C-cleavage occurs via a high-affinity proteolytic reaction that attacks all forms of the GTPase. This includes the short-Opa1 (s-Opa1) form that is generated following carbonyl cyanide m-chlorophenyl hydrazone (CCCP)-induced loss of membrane potential by Oma1 (Fig. S3E).
Fig. 4.

In vitro Opa1 C-cleavage is executed by a cysteine protease that acts downstream of Oma1 but that requires Mfn2. (A and B) In vitro Opa1 C-cleavage assay generates Opa1 fragments that have the same electrophoretic mobility of endogenous CTF-1 and CTF-2. An asterisk denotes an unspecific product of the in vitro Opa1 C-cleavage. (C) Opa1 C-cleavage is blocked by the cysteine protease inhibitor E-64. (D and E) Silencing the mitochondrial cysteine protease CAPN1 and genetic ablation of the Opa1 protease Oma1 do not affect Opa1 C-cleavage in vitro. (F) Genetic ablation of Mfn2, but not of Mfn1, blocks Opa1 C-cleavage. Mitochondria were prepared from Mfn1−/− Mfn2−/− MEFS and incubated for the indicated time with DDM to activate Opa1 C-cleavage and the generation of CTF-1 and CTF-2.
A Cysteine Protease Executes C-Cleavage Independently from Presenilin-Associated Rhomboid-Like or Oma1 to Eliminate Opa1.
To gather insights into the type of protease implicated in the generation of Opa1 CTF-1 and -2, we used the in vitro C-cleavage assay to screen a large number of protease inhibitors over a broad range of concentrations. Data showed that classical aspartyl-, metallo-, and serine-protease inhibitors do not affect Opa1 C-cleavage; instead, cysteine protease inhibitors like E64 (24), calpeptin, leupeptin, and chymostatin blocked the generation of CTF-1 and -2 (Fig. 4C and Fig. S3 C and D). The cell-permeable inhibitor E64d also blocked the generation of CTF-1 induced by rapamycin in MEFs (Fig. S3 F and G). We conclude that Opa1 C-cleavage is mediated by a cysteine protease. Noteworthy, Opa1 C-cleavage remains unaffected by genetic ablation of the Opa1 proteases that actuate the role of the GTPase in mitochondria cristae and morphology remodeling (25) (Fig. 4E and Fig. S4A). Similarly, silencing of Calpain-1 (CAPN1), which previous studies have claimed to be localized in the intermembrane space (IMS) (26, 27), does not affect the generation of Opa1 CTFs (Fig. 4D). Thus, Opa1 C-cleavage is mediated by a still unknown cysteine protease whose activity is independent from that of major Opa1-actuating proteases.
We named C1 and C2 the sites that generate CTF-1 and CTF-2, respectively. To locate them, we used an epitope mapping approach in combination with the in vitro C-cleavage assay on mitochondria prepared from cells expressing Opa1 with an HA tag inserted at position 568 and a Flag tag at the C terminus (Opa1HA-568 Flag-CT; Fig. 5A). Altogether, data revealed that the C1 site maps downstream of the HA568 tag and upstream of the Flag tag (Fig. 5A); instead, the C2 site maps upstream of the HA568 tag (Fig. 5B). Additional mutagenesis analysis identified the C2 cleavage site to be located in proximity of residue 545. Indeed, deletion of residues 540TTRNL544, but not of its neighboring sequences (530NSKLL534, 535KAHQV539, 545SLAVS549), abolished the in vitro generation of CTF-2 (Fig. 5E). Using this information we performed an in silico analysis to identify a potential C1-cleavage site in the C-terminal region of Opa1. Data showed the existence of a conserved potential consensus sequence at position 885 (885RML887; Fig. 5D). Deletion of the residues encompassing this potential C1-cleavage site (885RMLAITA891) eliminated CTF-1 generation (Fig. S4B), supporting a role for the RxL consensus sequence in Opa1 C-cleavage.
Fig. 5.
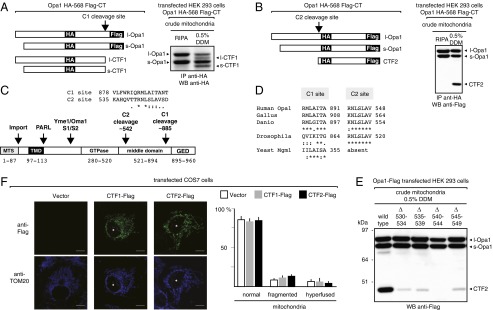
Opa1 C-cleavage destroys Opa1 integrity and produces fragments that are not competent for mitochondrial dynamics. (A and B) Epitope mapping of the Opa1 C-cleavage site that yields CTF-1 (C1 site) and CTF-2 (C2 site). The diagrams depict the epitope organization of the double-tagged Opa1 protein and the predicted products of its cleavage at the C1 and C2 site. (C, Top) Sequence homology of the putative C1 and C2 cleavage sites in Opa1. (Bottom) Diagram depicting the protein domain organization of Opa1 and the location where all of the known sites of Opa1 proteolysis occur. (D) Evolutionary conservation of the putative C-cleavage consensus sequences in Opa1 homologs. (E) Deletion of five amino acids encompassing the putative C2 cleavage site, 540TTRNL544, blocks the generation of CTF-2. (F) Expression of either CTF-1–Flag or CTF-2–Flag in the IMS of COS7 cells does not affect mitochondria morphology.
Cleavage at either the C1 or C2 site is bound to inactivate the dynamin-like activity of Opa1 because it dissociates from the GTPase domain the middle domain as well as the GTPase-effector domain (Fig. 5C). To validate this analysis, we developed constructs that express in the IMS CTF-1 (Fig. S4 C–E) and CTF-2 (Fig. S5 A and B) and performed a quantitative imaging analysis of the mitochondrial network. Data showed that overexpression of either construct in COS7 and HeLa cells had no effect on mitochondrial morphology (Fig. 5F and Fig. S5C). Thus, C-cleavage inactivates Opa1 without generating fragments that interfere with mitochondrial dynamics. Whether this processing is conserved in evolution remains unknown.
Opa1 C-Cleavage Requires Mfn2 but Not Mfn1.
The parallel remodeling of the cristae and of the MERCs at postprandial 5 h (Fig. 2 B and G) hints at the possibility that Opa1 elimination via C-cleavage might be coupled to the activity of the mitochondria–ER tethering GTPase Mfn2. To address this possibility, we challenged Mfn2−/− MEFs with either 100 or 200 nM of rapamycin over an extended period (up to 80 min). Data showed that, unlike wild-type MEFs, Mfn2−/− cells do not respond to this TORC inhibitor by expressing Opa1 CTF-1 (Fig. 3D and Fig. S6A). To further support this observation, we returned to the in vitro C-cleavage assay on crude mitochondria isolated from Mfn1−/− and Mfn2−/− MEFs. Results showed that genetic ablation of Mfn2, but not of Mfn1, markedly impairs CTF-1 and -2 generation (Fig. 4F and Fig. S6B). These findings are consistent with recent studies showing that liver-specific ablation of Mfn2 in mice disrupts hepatic metabolism (12) and correlate with the data showing a parallel cristae and MERC remodeling during the postprandial metabolic shift.
Discussion
In this study, we investigated the adaptive responses of the mitochondrial reticulum to the metabolic changes that occur in the liver in the hours that follow feeding. More specifically, we investigated how loss of hepatic mTORC1 signaling during the postprandial state relates to mitochondria morphology, cristae structure, and MERC remodeling. To our knowledge, this is the first comparative quantitative description of the ultrastructural changes that occur to mitochondria in vivo under normal physiological conditions.
Loss of hepatic mTORC1 activity in the postprandial liver is associated with a fragmentation of the mitochondrial reticulum and to a loss of cristae density and respiratory capacity. These major changes are associated with cleavage of Opa1, the major regulator of mitochondria cristae biogenesis and a critical component of the fusion/fission machinery of the organelle. The underlying processing eliminates Opa1 from the organelle through the activation of a still unknown cysteine protease that operates downstream of presenilin-associated rhomboid-like (PARL) and Oma1. The raison d'être of this not unforeseeable degradation program within the broad context of the postprandial metabolism remains unclear. However, because at 5 h postprandial Opa1 levels remain unchanged (Fig. S2D), newly imported Opa1 could replace the fraction that, through mTORC1 inactivation, is eliminated via C-cleavage (Fig. 3C). In such a scenario, C-cleavage could eliminate preexisting Opa1 complexes to allow the formation of new ones, perhaps in a different subdomain of the IMM. Clearly, cytosolic pathways are upstream of C-cleavage activation because mTORC1 inhibition with rapamycin activates the transient expression of CTF-1. Thus, this study further positions mitochondrial protease cascades at the center of the dynamic response of the organelle in the regulation of energy homeostasis and links them to nutrient-sensing signaling pathways that reside outside the organelle.
In vitro, Opa1 C-cleavage does not require the known Opa1 proteases PARL and Oma1, but depends on the expression of Mfn2. This latter result is unexpected but important because it connects for the first time the machineries that govern the structure of the cristae and of the MERCs. Notably, this finding parallels the observation that loss of cristae density accompanies a large increase in MERC length and is consistent with the report that liver-specific ablation of Mfn2 in mice leads to numerous metabolic abnormalities (12). It would appear, therefore, that mitochondria adapt to metabolic transitions by remodeling their cristae architecture through a mechanism that is linked to MERC assembly. It is tempting to speculate that the loss of the cristae could allow the IMM to distend and juxtapose under the MERC, to allow efficient calcium, lipid, and metabolite transfer across both mitochondrial membranes.
Materials and Methods
Postprandial Protocol.
Male C57BL6 mice 9–12 wk in age (∼18 g) were trained to handling and to the postprandial protocol described here to minimize variability linked to stress and food consumption. Mice were left unfed for 12 h (8:00 PM–8:00 AM). In the morning, they were individually transferred to an empty cage and given 1.9 kcal of normal chow (∼20% of daily caloric intake) for 1 h. After feeding, the animals were moved to a clean cage (with bedding) for the time indicated in the experiment. Liver biopsy and/or harvest followed. The animal committee of the Université Laval approved these studies.
Cryo-EM and Statistical Analysis.
A description of the cryo-EM protocols is provided in SI Materials and Methods. Low-magnification EM images of the liver samples each measured 660 μm2. On these images, every mitochondrion was identified manually, and the perimeter was outlined with an optical pen using the ImageJ software. The shape of each mitochondrion was defined by the axis ratio of the oval that best fits the area of the organelle (ImageJ software). Cristae and MERCs were identified manually from high-resolution, high-magnification cryo-EM images, and they were outlined using an optical pen in ImageJ to calculate their length. Data are expressed as means ± SEM. The statistical significance of differences was assessed with a one- or two-sample Student t test (for Fig. 3B the χ2 test was used). For the cumulative probability plots, the Kolmogorov–Smirnov test was used to determine if the values between conditions were significantly different.
Mitochondria Respiration Assay.
Respiration measurements on isolated liver mitochondria were performed as described (28) using the XF24 Extracellular Flux Analyzer (Seahorse Bioscience).
In Vitro Opa1 C-Cleavage Assay.
We added 30 μL of crude mitochondria (30 μg/μL) in mitochondria resuspension buffer (MRB) (SI Materials and Methods) (29) to 130 μL of PBS containing either 0.6% or 1.2% (vol/vol) of either DIG (Calbiochem) or DDM (Mitoscience). After gentle mixing, the reaction was incubated at 4 °C for 5–60 min and stopped by adding 30 μL of 2× RIPA (65 mM Tris-base, 150 mM NaCl, 1% NP40, 0.25% Na deoxycholate, 0.1% SDS, 1 mM EDTA, pH 7.4) for immunoblot analysis.
Supplementary Material
Acknowledgments
We thank Pedro Moral Quiros and David Chan for the Oma1−/− and Mfn1/2−/− MEFs and George Rogers (Seahorse Bioscience) for his support in testing liver mitochondria respiration. A.S. is a Ven-Anil-Hugette Murthy graduate scholar. This study was funded by an operating grant from the Canadian Institutes of Health (MOP-82718) (to L.P.).
Footnotes
The authors declare no conflict of interest.
*This Direct Submission article had a prearranged editor.
This article contains supporting information online at www.pnas.org/lookup/suppl/doi:10.1073/pnas.1408061111/-/DCSupplemental.
References
- 1.Wan M, et al. Postprandial hepatic lipid metabolism requires signaling through Akt2 independent of the transcription factors FoxA2, FoxO1, and SREBP1c. Cell Metab. 2011;14(4):516–527. doi: 10.1016/j.cmet.2011.09.001. [DOI] [PMC free article] [PubMed] [Google Scholar]
- 2.Wan M, et al. A noncanonical, GSK3-independent pathway controls postprandial hepatic glycogen deposition. Cell Metab. 2013;18(1):99–105. doi: 10.1016/j.cmet.2013.06.001. [DOI] [PMC free article] [PubMed] [Google Scholar]
- 3.Sengupta S, Peterson TR, Laplante M, Oh S, Sabatini DM. mTORC1 controls fasting-induced ketogenesis and its modulation by ageing. Nature. 2010;468(7327):1100–1104. doi: 10.1038/nature09584. [DOI] [PubMed] [Google Scholar]
- 4.Rabøl R, Petersen KF, Dufour S, Flannery C, Shulman GI. Reversal of muscle insulin resistance with exercise reduces postprandial hepatic de novo lipogenesis in insulin resistant individuals. Proc Natl Acad Sci USA. 2011;108(33):13705–13709. doi: 10.1073/pnas.1110105108. [DOI] [PMC free article] [PubMed] [Google Scholar]
- 5.Laplante M, Sabatini DM. mTOR signaling in growth control and disease. Cell. 2012;149(2):274–293. doi: 10.1016/j.cell.2012.03.017. [DOI] [PMC free article] [PubMed] [Google Scholar]
- 6.Peterson TR, et al. mTOR complex 1 regulates lipin 1 localization to control the SREBP pathway. Cell. 2011;146(3):408–420. doi: 10.1016/j.cell.2011.06.034. [DOI] [PMC free article] [PubMed] [Google Scholar]
- 7.Cunningham JT, et al. mTOR controls mitochondrial oxidative function through a YY1-PGC-1alpha transcriptional complex. Nature. 2007;450(7170):736–740. doi: 10.1038/nature06322. [DOI] [PubMed] [Google Scholar]
- 8.Morita M, et al. mTORC1 controls mitochondrial activity and biogenesis through 4E-BP-dependent translational regulation. Cell Metab. 2013;18(5):698–711. doi: 10.1016/j.cmet.2013.10.001. [DOI] [PubMed] [Google Scholar]
- 9.Chen H, et al. Mitofusins Mfn1 and Mfn2 coordinately regulate mitochondrial fusion and are essential for embryonic development. J Cell Biol. 2003;160(2):189–200. doi: 10.1083/jcb.200211046. [DOI] [PMC free article] [PubMed] [Google Scholar]
- 10.Davies VJ, et al. Opa1 deficiency in a mouse model of autosomal dominant optic atrophy impairs mitochondrial morphology, optic nerve structure and visual function. Hum Mol Genet. 2007;16(11):1307–1318. doi: 10.1093/hmg/ddm079. [DOI] [PubMed] [Google Scholar]
- 11.Wakabayashi J, et al. The dynamin-related GTPase Drp1 is required for embryonic and brain development in mice. J Cell Biol. 2009;186(6):805–816. doi: 10.1083/jcb.200903065. [DOI] [PMC free article] [PubMed] [Google Scholar]
- 12.Sebastián D, et al. Mitofusin 2 (Mfn2) links mitochondrial and endoplasmic reticulum function with insulin signaling and is essential for normal glucose homeostasis. Proc Natl Acad Sci USA. 2012;109(14):5523–5528. doi: 10.1073/pnas.1108220109. [DOI] [PMC free article] [PubMed] [Google Scholar]
- 13.Cogliati S, et al. Mitochondrial cristae shape determines respiratory chain supercomplexes assembly and respiratory efficiency. Cell. 2013;155(1):160–171. doi: 10.1016/j.cell.2013.08.032. [DOI] [PMC free article] [PubMed] [Google Scholar]
- 14.Zhang Z, et al. The dynamin-related GTPase Opa1 is required for glucose-stimulated ATP production in pancreatic beta cells. Mol Biol Cell. 2011;22(13):2235–2245. doi: 10.1091/mbc.E10-12-0933. [DOI] [PMC free article] [PubMed] [Google Scholar]
- 15.Hackenbrock CR. Ultrastructural bases for metabolically linked mechanical activity in mitochondria. I. Reversible ultrastructural changes with change in metabolic steady state in isolated liver mitochondria. J Cell Biol. 1966;30(2):269–297. doi: 10.1083/jcb.30.2.269. [DOI] [PMC free article] [PubMed] [Google Scholar]
- 16.Frezza C, et al. OPA1 controls apoptotic cristae remodeling independently from mitochondrial fusion. Cell. 2006;126(1):177–189. doi: 10.1016/j.cell.2006.06.025. [DOI] [PubMed] [Google Scholar]
- 17.Anand R, et al. The i-AAA protease YME1L and OMA1 cleave OPA1 to balance mitochondrial fusion and fission. J Cell Biol. 2014;204(6):919–929. doi: 10.1083/jcb.201308006. [DOI] [PMC free article] [PubMed] [Google Scholar]
- 18.Ehses S, et al. Regulation of OPA1 processing and mitochondrial fusion by m-AAA protease isoenzymes and OMA1. J Cell Biol. 2009;187(7):1023–1036. doi: 10.1083/jcb.200906084. [DOI] [PMC free article] [PubMed] [Google Scholar]
- 19.Head B, Griparic L, Amiri M, Gandre-Babbe S, van der Bliek AM. Inducible proteolytic inactivation of OPA1 mediated by the OMA1 protease in mammalian cells. J Cell Biol. 2009;187(7):959–966. doi: 10.1083/jcb.200906083. [DOI] [PMC free article] [PubMed] [Google Scholar]
- 20.Quirós PM, et al. Loss of mitochondrial protease OMA1 alters processing of the GTPase OPA1 and causes obesity and defective thermogenesis in mice. EMBO J. 2012;31(9):2117–2133. doi: 10.1038/emboj.2012.70. [DOI] [PMC free article] [PubMed] [Google Scholar]
- 21.Csordás G, et al. Structural and functional features and significance of the physical linkage between ER and mitochondria. J Cell Biol. 2006;174(7):915–921. doi: 10.1083/jcb.200604016. [DOI] [PMC free article] [PubMed] [Google Scholar]
- 22.Griparic L, Kanazawa T, van der Bliek AM. Regulation of the mitochondrial dynamin-like protein Opa1 by proteolytic cleavage. J Cell Biol. 2007;178(5):757–764. doi: 10.1083/jcb.200704112. [DOI] [PMC free article] [PubMed] [Google Scholar]
- 23.Akepati VR, et al. Characterization of OPA1 isoforms isolated from mouse tissues. J Neurochem. 2008;106(1):372–383. doi: 10.1111/j.1471-4159.2008.05401.x. [DOI] [PubMed] [Google Scholar]
- 24.Kim MJ, et al. Crystal structure of papain-E64-c complex. Binding diversity of E64-c to papain S2 and S3 subsites. Biochem J. 1992;287(Pt 3):797–803. doi: 10.1042/bj2870797. [DOI] [PMC free article] [PubMed] [Google Scholar]
- 25.Belenguer P, Pellegrini L. The dynamin GTPase OPA1: More than mitochondria? Biochim Biophys Acta. 2013;1833(1):176–183. doi: 10.1016/j.bbamcr.2012.08.004. [DOI] [PubMed] [Google Scholar]
- 26.Cao G, et al. Critical role of calpain I in mitochondrial release of apoptosis-inducing factor in ischemic neuronal injury. J Neurosci. 2007;27(35):9278–9293. doi: 10.1523/JNEUROSCI.2826-07.2007. [DOI] [PMC free article] [PubMed] [Google Scholar]
- 27.Polster BM, Basañez G, Etxebarria A, Hardwick JM, Nicholls DG. Calpain I induces cleavage and release of apoptosis-inducing factor from isolated mitochondria. J Biol Chem. 2005;280(8):6447–6454. doi: 10.1074/jbc.M413269200. [DOI] [PubMed] [Google Scholar]
- 28.Rogers GW, et al. High throughput microplate respiratory measurements using minimal quantities of isolated mitochondria. PLoS ONE. 2011;6(7):e21746. doi: 10.1371/journal.pone.0021746. [DOI] [PMC free article] [PubMed] [Google Scholar]
- 29.Wieckowski MR, Giorgi C, Lebiedzinska M, Duszynski J, Pinton P. Isolation of mitochondria-associated membranes and mitochondria from animal tissues and cells. Nat Protoc. 2009;4(11):1582–1590. doi: 10.1038/nprot.2009.151. [DOI] [PubMed] [Google Scholar]
Associated Data
This section collects any data citations, data availability statements, or supplementary materials included in this article.