

Summary
LGR5 and BMI1 mark intestinal stem cells in crypt base columnar cells and +4 position cells, respectively, but characterization of functional markers in these cell populations is limited. ID1 maintains the stem cell potential of embryonic, neural, and long-term repopulating hematopoietic stem cells. Here, we show in both human and mouse intestine that ID1 is expressed in cycling columnar cells, +4 position cells, and transit-amplifying cells in the crypt. Lineage tracing revealed ID1+ cells to be self-renewing, multipotent stem/progenitor cells that are responsible for the long-term renewal of the intestinal epithelium. Single ID1+ cells can generate long-lived organoids resembling mature intestinal epithelium. Complete knockout of Id1 or selective deletion of Id1 in intestinal epithelium or in LGR5+ stem cells sensitizes mice to chemical-induced colon injury. These experiments identify ID1 as a marker for intestinal stem/progenitor cells and demonstrate a role for ID1 in maintaining the potential for repair in response to colonic injury.
Highlights
-
•
ID1 is expressed in mouse and human intestinal and colonic stem and progenitor cells
-
•
ID1+ cells are long-lived and multipotent
-
•
Deletion of Id1 in stem and progenitor cells sensitizes mice to colon injury
In this article, Benezra, Dannenberg, and colleagues show that the dominant-negative transcription factor ID1 marks the stem and progenitor cells of the gut and is required in the colon for an optimal response to injury in a mouse model of colitis.
Introduction
The gastrointestinal tract is an important site of interactions between the host and the external environment. An intact epithelium forms the first line of host defense against numerous mechanical, chemical, and microbial-driven attacks and rapidly self-renews as a mechanism to maintain homeostasis (Barker et al., 2010; Quante and Wang, 2009). This regeneration and replacement of cells is driven by tissue-restricted adult stem cells located at the base of the crypt. These cells undergo largely symmetric divisions, which upon competitive displacement from contact with a Paneth cell niche in the small intestine, stochastically generate a larger pool of more rapidly dividing progenitor cells referred to as transit-amplifying (TA) cells (Snippert et al., 2010). A Paneth-like cell fulfills a similar function in the colon. In the small intestine, the TA cells give rise to four terminally differentiated cell types: enterocytes, goblet cells, enteroendocrine cells, and Paneth cells. Two opposing models, the +4 model and the crypt base columnar (CBC) cell model, describe the exact location and identity of intestinal stem cells. The +4 model was based on the presence of slowly cycling, radiation-sensitive cells at the fourth cell position from the bottom of the crypt that showed label retention of BrdU (Potten, 1977). However, other studies suggested that the slender, immature, cycling cells wedged between the Paneth cells, i.e., the CBC cells, are stem cells (Cheng, 1974). The “stemness” of these populations was later established based on their ability to self-renew over long periods of time and produce all differentiated cell types of the intestinal epithelium (Barker et al., 2007; Sangiorgi and Capecchi, 2008). Still, the characterization of functional markers in these stem cell populations will likely contribute to our understanding of the response to crypt injury.
Inhibitor of DNA binding 1 (ID1) facilitates cell-cycle progression, inhibits differentiation in multiple cell types, and plays an essential role in the self-renewal of stem cells (Lasorella et al., 2014). It is sufficient for maintaining murine embryonic stem cell self-renewal and pluripotency in the absence of bone morphogenic protein (Ying et al., 2003), and maintains embryonic stem cell self-renewal by upregulation of Nanog and repression of Brachyury expression (Romero-Lanman et al., 2012). Loss of Id1 function leads to premature withdrawal of neuroblasts from the cell cycle and inappropriate expression of neural-specific markers, in addition to a defect in angiogenesis in the murine embryonic brain (Lyden et al., 1999). High levels of Id1 expression define a subpopulation of GFAP+ cells in the subventricular zone (SVZ) of adult mouse brain that are bona fide B1-type adult neural stem cells (Nam and Benezra, 2009) and intermediate levels of Id1 are associated with the more committed progenitor C cells in the SVZ. In addition, this hierarchy is maintained during gliomagenesis (Barrett et al., 2012). Therefore, we hypothesized that ID1 might be a fate determinant of other adult stem cell populations.
Here, we show that (1) ID1 expression in the gut is restricted to CBC cells and the +4 position, which corresponds to cells expressing LGR5 and BMI1, respectively, as well as TA cells; (2) these ID1+ cells are self-renewing, multipotent stem cells that are responsible for the long-term renewal of the gut epithelium in lineage-tracing experiments; (3) single Id1+ cells efficiently generate long-lived organoids resembling mature intestinal epithelium; and (4) knocking out Id1 in intestinal epithelial cells impairs LGR5+ stem cell function and sensitizes animals to chemical-induced injury to the colon.
Results and Discussion
Restricted Expression of ID1 at the Base of the Intestinal Crypts
We examined expression of ID1 in the intestine using a highly specific rabbit monoclonal anti-Id1 antibody (Perk et al., 2006). ID1 expression throughout the small intestinal epithelium of adult mice is confined to the crypts, whereas the villi are negative (Figure 1A). ID1 is expressed in CBC cells interspersed between Paneth cells, +4 position cells, and TA cells (Figure 1B). The frequency of ID1 positivity is greatest in the +4 to +10 position, with less frequent expression in CBC cells and the higher TA zone (Figure S1A available online). A similar pattern is seen in the mouse colon: ID1+ cells are confined to the bottom two-thirds of the crypt, and the upper, more differentiated part of the crypt and the surface epithelial cells rarely express ID1 (Figures 1C and 1D). In both the small intestine and the colon, Id1 is present in every crypt (Figures 1A and 1C). Ki67, a marker of proliferation, and ID1 colocalize in the majority of cells in the crypts of the small intestine and colon (Figure S2). In human small intestine and colon, CBC cells, +4 position cells, and TA cells are positive for ID1 (Figures 1E–1H). Low levels of ID1 are also found in endothelial cells in normal mouse and human intestine. Costaining for EGFP and ID1 in Lgr5-EGFP-IRES-creERT knockin mice demonstrates ID1 immunoreactivity in LGR5+ stem cells (Figure 1I). Many CBC cells that are positive for Lgr5-EGFP also express ID1 protein, and some lacking Id1 are also observed. Consistently, +4 position cells and some early TA cells that are negative for Lgr5-EGFP are positive for ID1. Collectively, these observations indicate that ID1 is a stem/progenitor cell marker in both mouse and human colon and small intestine.
Figure 1.
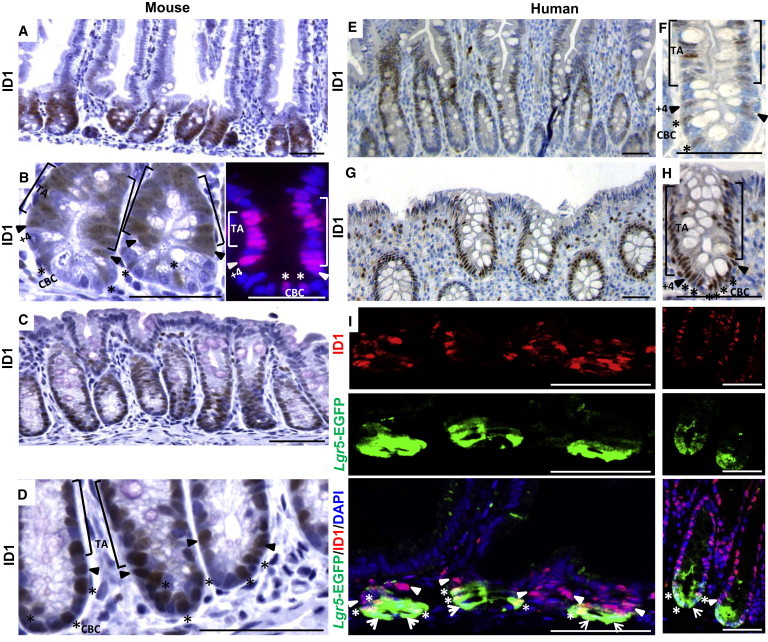
ID1 Is Detected in Stem and TA Cells in the Small Intestine and Colon
(A and B) Expression of ID1 protein in wild-type murine small intestine was detected using a rabbit monoclonal ID1 antibody. In (B), high-magnification IHC (left) and immunofluorescence (right) show ID1 immunoreactivity in the TA cells, +4 position cells, and CBC cells.
(C and D) Low (C) and high (D) magnification IHC of ID1 in crypts of the colon.
(E and F) Expression of ID1 protein in normal human small intestine was detected by IHC using the rabbit monoclonal ID1 antibody. In (F), high-magnification IHC shows ID1 immunoreactivity in TA cells, +4 position cells, and CBC cells as indicated.
(G and H) Low (G) and high (H) magnification IHC of ID1 in crypts of the human colon. In (B), (D), (F), and (H), [ marks TA cells,  marks +4 position cells, and ∗ marks CBC cells.
(I) Colocalization of LGR5 and ID1 in mouse small intestine (left) and colon (right) by EGFP and ID1 staining in Lgr5-EGFP mice. ∗, CBC cells double positive for EGFP and ID1;  , CBC cells positive for EGFP but negative for ID1; , +4 position cells only positive for ID1. Scale bars, 50 μm.
See also Figures S1 and S2.
ID1+ Cells Support the Renewal of Intestinal Epithelium over Extended Periods
To study the potential of ID1+ cells to give rise to more differentiated progeny, we crossed the Id1-IRES-creERT2 mouse strain (Nam and Benezra, 2009) with animals bearing the Cre-activatable Rosa26-lox-stop-lox-lacZ allele. Tamoxifen activates the CreERT2 fusion enzyme in Id1-expressing cells, and Cre-mediated excision of the roadblock sequence in the Rosa26-lacZ reporter permanently marks Id1+ cells and their progeny. After a single tamoxifen pulse, adult mice were sacrificed at 0.5, 1, 3, 7, 30, 60, 180, and 365 days after induction (Figure 2A). LacZ activity is first observed in isolated ID1+ cells at the base of the intestinal crypts 0.5 days postinduction. Approximately 25% of the crypts are labeled at this time (compared with 100% by immunohistochemistry [IHC]), likely reflecting incomplete recombination at the Rosa26 locus, which has also been observed in other cell types (Nam and Benezra, 2009). Among the labeled crypts, 46% show evidence of LacZ expression in the stem cell zone and 34% show expression in the TA cell zone (Figure 2B, left). The remaining 20% of the labeled crypts exhibit LacZ+ cells in both zones. Among the 46% stem cell zone-labeled crypts, more than half (54%) show LacZ staining at the +4 position, one-third (33%) show LacZ+ CBC cells, and 13% show staining in both populations (Figure 2B, right). Quantitative analysis of the earliest LacZ+ cells indicates that the CBC and +4 position cells have the highest Id1 promoter activity (Figure S1B). From day 1 to day 30, there is a continual increase in the number of cells labeled per crypt in both the small intestine and colon (Figure 2A). Ribbons of cells emanate from the base of the crypt and over time label all epithelial cells in the small intestine (Figure 2A, top) and colon (Figure 2A, bottom). For each time point, we analyzed 200 well-oriented crypts in the proximal small intestine to determine the percentage of crypts containing LacZ+ cells. After 0.5, 1, 3, 7, 30, 60, 180, and 365 days, 26.1%, 30.6%, 36.1%, 27.7%, 22.6%, 14.4%, 8%, and 7% of the crypts, respectively, are LacZ+ (Figure 2C). This reduction over time likely reflects the presence of crypts labeled largely in the Id1+ TA population. More than 80% of the crypts labeled at 180 and 365 days are completely labeled as a result of the marking of long-term self-renewing Id1+ populations (Figure 2D). Animals treated with corn oil vehicle control show no LacZ staining at any time point (data not shown).
Figure 2.
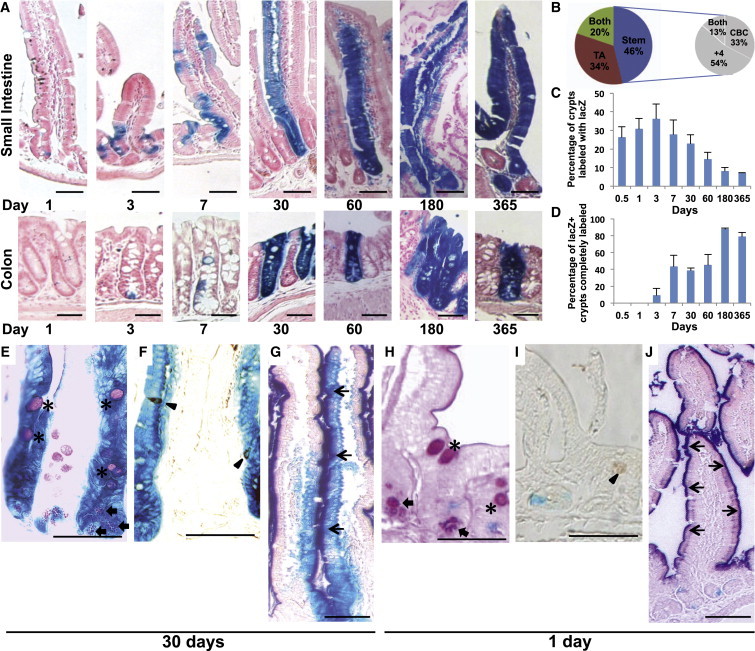
ID1 Labels Long-Term Repopulating Stem Cells in the Small Intestine and Colon
(A) LacZ staining of small intestine and colon from Id1-IRES-creERT2/Rosa26-lacZ mice from 1 day to 1 year after tamoxifen injection.
(B) Distribution of LacZ+ cells 12 hr after tamoxifen induction. Results are depicted as the means of three independent stretches of proximal small intestine, with ∼50 positive crypts each. The distribution of LacZ+ cells within the stem cell compartment is indicated in the pie chart on the right.
(C) Frequency of LacZ+ crypts/villi in the proximal small intestine at different time points after tamoxifen induction.
(D) Percentage of LacZ+ crypts that were completely labeled at different time points. For (C) and (D), ∼200 crypts in each proximal small intestine from three mice were analyzed at all time points. Values are presented as the mean ± SD.
(E–G) Double labeling of LacZ-stained small intestine by PAS (E), chromogranin A (F), and alkaline phosphatase (G) in LacZ+ clones 30 days after tamoxifen induction. ∗, goblet cells;  , Paneth cell; ▲, enteroendocrine cell; ↑, enterocyte.
(H–J) Same as (E)–(G), but 1 day after tamoxifen induction. Note that double labeling was not observed. Scale bars, 50 μm.
To demonstrate the multipotency of the ID1+ stem cells, we performed double staining with differentiated cell markers for goblet cells, Paneth cells, enteroendocrine cells, and enterocytes in intestines following tamoxifen treatment. Paneth cells, periodic acid-Schiff (PAS)-positive goblet cells (Figure 2E), chromogranin A-positive enteroendocrine cells (Figure 2F), and alkaline phosphatase-positive enterocytes (Figure 2G) are all present in the LacZ-stained clones on day 30 after tamoxifen induction. In contrast, ID1+ stem/progenitor cells at an early time point (1 day after induction) do not express any of the differentiation cell markers (Figures 2H–2J). Taken together, these results indicate that ID1 marks the stem cells of the small intestine and colon, which are capable of long-term self-renewal and generate all cell types of the epithelium.
Single Adult Id1+ Stem Cells Form Crypt-Villus Structures in Vitro
To determine whether Id1+ cells are able to generate stable self-renewing intestinal epithelium organoids in vitro, we isolated Id1-expressing populations by flow cytometry using an Id1VenusYFP knockin allele (Id1v/v) (Nam and Benezra, 2009) and cultured them as described previously (Sato et al., 2009; Figure 3A). Small cyst-like structures were visible after 2–3 days. After 6 days of culture, continuous budding events started and dead cells appeared inside the lumen (Figure 3B). After 10–14 days, the organoids were dissociated mechanically and replated to form multiple new organoids. This procedure could be repeated every 10–14 days for at least ten passages, and the organoids did not display apparent morphological differences. Single Id1Venus+ cells gave rise to cyst-like organoids (day 4) at an average efficiency of 8%–10%; however, fully formed organoids with a well-organized central lumen (villus domain) and crypt domain were rarely observed (0.1% efficiency). No single sorted Id1Venus− cells were able to form organoids and they typically died 1 day after plating. The organoids derived from single Id1Venus+ cells gave rise to the four postmitotic differentiated cell types of the small intestine epithelium, as evidenced by positive staining with PAS (Paneth and goblet cells), Alcian blue (goblet cells; Figures 3C and 3D), the expression of chromogranin A (enteroendocrine cells; Figure 3E), and positive staining of alkaline phosphatase (enterocytes) (Figure 3F). These data indicate that single Id1+ cells have the capacity to function as multipotent intestinal stem cells in vitro.
Figure 3.
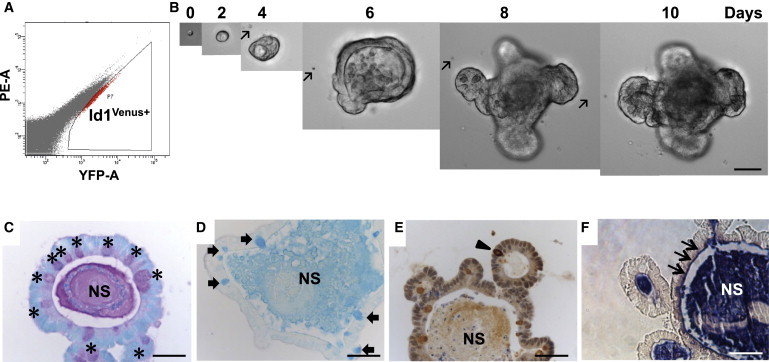
Single Id1+ Cells Generate Crypt-Villus Structure
(A) Flow-cytometric analysis of Id1venus+ epithelial cells from an Id1v/v small intestine. Gate was based on negative control from C57BL/J intestine epithelial cells.
(B) Example of time-dependent organoid formation from a single Id1venus+ cell over a period of 10 days. Arrows mark defects in culture plastic that were used as “landmarks” to track individual cells through early developmental phases to a mature organoid. Scale bar, 50 μm.
(C–F) Paraffin sections from single Id1venus+ cell-derived organoids stained with PAS (C, ∗, goblet and Paneth cells), Alcian blue (D, , goblet cells), chromogranin A antibody (E, ▲, enteroendocrine cells), and NBT/BCIP for alkaline phosphatase (F, ↑, enterocytes). NS, nonspecific staining. Scale bars, 50 μm.
Loss of Id1 Sensitizes Mice to Colitis
We next determined whether ID1 was required for mucosal homeostasis. Previous analyses suggested that the effects of loss of individual Id family members are only observed when stem cells are challenged by tissue damage or progenitor cell killing (Jankovic et al., 2007; Nam and Benezra, 2009). Treatment of wild-type mice with dextran sodium sulfate (DSS) induces colitis that mimics clinical and histological features of human ulcerative colitis (Wirtz et al., 2007). Treatment of wild-type mice with DSS led to an increase in ID1 expression in the colonic epithelium (Figure S3). Id1 knockout mice and wild-type controls were treated with DSS for 7 days followed by 14 days of plain drinking water. A higher percentage of Id1−/− mice had severe diarrhea and bleeding compared with wild-type controls upon DSS exposure (Figures 4A and 4B). Id1−/− mice also had shorter colons and worse histology scores characterized by loss of crypt structure, ulceration, and infiltration of inflammatory cells (Figures 4C–4E). All Id1−/− mice died, whereas nearly all of the wild-type control mice survived (Figure 4F).
Figure 4.
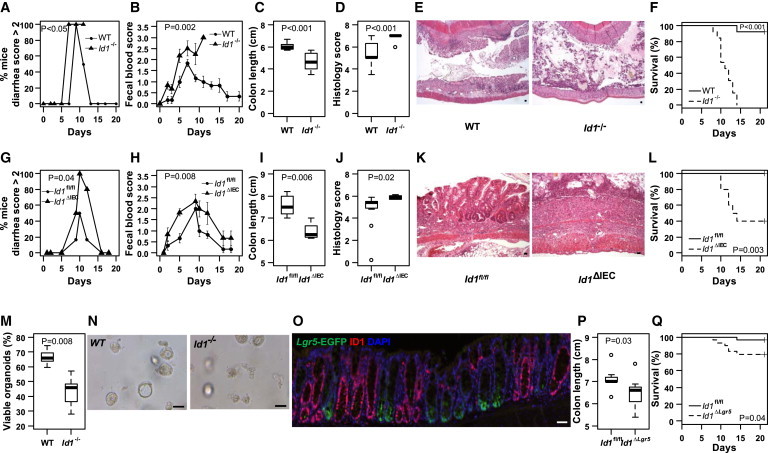
Id1 Deficiency Sensitizes Mice to Worse Experimental Colitis
(A–F) Complete Id1 knockout.
(A–D and F) Mice were given 3% DSS (w/v) for 7 days followed by 14 days of plain drinking water. Severity of diarrhea, n = 6/group (A); bleeding, n = 6/group (B); colon length, n = 10/group (C); histology score, n = 10/group (D); and mortality over time, n = 13/group (F) were recorded.
(E) Representative histology (H&E staining) demonstrating worse injury in Id1−/− mice. The percentage of mice with severe diarrhea was calculated for the surviving mice in each group at each time point. The mean ± SEM for fecal blood score was determined for the surviving mice in each group at each time point. Colon length and histology score were measured in mice at the time of sacrifice on day 8 and summarized in box-and-whisker plots.
(G–L) Id1 deletion in epithelial cells.
(G–J and L) Id1fl/fl and Id1ΔIEC mice were given DSS for 7 days followed by 14 days of plain drinking water. Severity of diarrhea, n = 6/group (G); bleeding, n = 6/group (H); colon length, n = 4–11/group (I); histology score, n = 4–11/group (J); and mortality over time, n = 10–11/group (L) were recorded.
(K) Representative histology (H&E staining) demonstrates worse injury in Id1ΔIEC mice. The percentage of mice with severe diarrhea was calculated for the surviving mice in each group at each time point. The mean ± SEM for fecal blood score was determined for the surviving mice in each group at each time point. Colon length and histology score were measured in mice that survived until day 21 and described using the box-and-whisker plots.
(M and N) Effect of Id1 depletion on organoid formation and survival.
(M) Intestinal crypts were dissociated from wild-type and Id1−/− mice (n = 5/group) and plated in Matrigel, and 24 hr later the fraction of viable organoids was assessed and summarized using the box-and-whisker plot. Thirty 40× microscopic fields were analyzed for each group.
(N) Representative images of crypt organoid populations from wild-type and Id1−/− mice.
(O–Q) Effect of Id1 depletion in stem cells.
(O) Depletion of Id1 in Lgr5EGFP-IRES-CreERT2;Id1fl/fl/+ (Id1ΔLgr5) colon after tamoxifen induction. Note that crypts with high Lgr5 expression (green) are devoid of Id1 (red).
(P and Q) Id1fl/fl and Id1ΔLgr5 mice were given DSS for 7 days followed by 14 days of plain drinking water. Colon lengths were compared (n = 9/group; P) on day 8 and summarized using the box-and-whisker plot, and mortality over time (n = 29/group; Q) was recorded. Scale bars, 50 μm.
See also Figures S3 and S4.
To determine whether the worse colitis observed in Id1−/− mice reflected an epithelial defect, we generated intestinal epithelium-specific Id1 knockout (Id1ΔIEC) mice by crossing Id1fl/fl mice (Nam and Benezra, 2009) with B6.SJL-Tg(Vil-cre)997Gum/J transgenic mice, which express Cre recombinase under the direction of the mouse villin promoter. Villin is broadly expressed in every cell of the intestinal epithelium (Madison et al., 2002). The deletion of ID1 in the unperturbed gut epithelium was continuous and complete (Figure S4). Id1ΔIEC mice are viable, fertile, normal in size, and do not display any gross physical or behavioral abnormalities. In the absence of injury, deleting Id1 from epithelial cells has no effect on the morphology of the small intestine or colon. Moreover, no difference in the crypt/villus ratio or crypt fission in control versus Id1ΔIEC mice was observed (data not shown), suggesting compensation by other ID family members under normal physiological conditions. We then evaluated both the severity of colitis and mortality in Id1ΔIEC mice. Similar to what was observed in Id1−/− mice, Id1ΔIEC mice exhibited more severe colitis, including worse diarrhea and bleeding, shorter colons, and worse histology scores compared with Id1fl/fl mice (Figures 4G–4K). Sixty percent of Id1ΔIEC mice died, whereas all animals in the Id1fl/fl control group survived (Figure 4L). No difference in any of these parameters was observed between Id1fl/fl and Vil-cre-Id1+/+ mice, indicating that Cre recombinase expression per se is not responsible for the observed phenotypes. The fact that both the severity of colitis and mortality increase when Id1 is knocked out completely versus only in epithelial cells suggests that endothelial Id1 may also be involved in the pathophysiology of colitis.
Next, crypts were isolated from the intestines of wild-type and Id1−/− mice, and crypt organoid formation and survival were assessed in vitro. In this culture system, 66.6% ± 5.7% of the intestinal crypts isolated from wild-type mice were able to survive, compared with 43.1% ± 11.2% from the Id1−/− mice (p < 0.01; Figures 4M and 4N). The defect observed in the Id1−/− crypts under harsh culture conditions may be reflective of the suboptimal response to injury in the crypts of Id1-deficient mice following DSS treatment.
To evaluate whether ID1 is essential for stem cell function within the crypt, we specifically knocked out Id1 in Lgr5+ cells by tamoxifen induction in Lgr5CreER/+;Id1fl/fl mice, which we generated by crossing B6.129P2-Lgr5tm1(cre/ERT2)Cle/J and Id1fl/fl mice. Although EGFP was expressed uniformly in the crypts of the proximal small intestine, expression was variegated in the distal small intestine and colon, as previously described (The Jackson Laboratory, stock number 008875 database). Approximately 40% of the crypts in the colon expressed EGFP, and ID1 was concomitantly deleted in these crypts after tamoxifen administration (Figure 4O). Failure to observe significant differences in the subjective clinical measurements (diarrhea and bleeding) is likely a consequence of incomplete deletion of Id1 in the colonic stem cells. Nonetheless, similar to what was observed in the Id1−/− and Id1ΔIEC models, DSS treatment led to shorter colons and increased mortality when Id1 was deleted in the Lgr5 compartment (Id1ΔLgr5) (Figures 4P and 4Q).
To begin to explore the mechanism by which Id1 loss sensitizes the colon to injury, we focused on the expression of genes implicated in mitotic progression. ID1 is important for proliferation in stem and progenitor cells in other tissue types (Nam and Benezra, 2009) and proliferation defects have been observed in the colonic epithelium in the DSS model of colitis (Tessner et al., 1998). Hence, we reasoned that loss of Id1 might sensitize the mice to DSS-induced colonic injury because of an exacerbation of this proliferative defect. We examined the effects of Id1 loss in colonic epithelium compared with wild-type controls in the absence and presence of DSS treatment for 3 days. Strikingly, 10 of 12 genes implicated in mitotic progression were suppressed significantly in the Id1 deletion strain in the presence of DSS relative to the other three groups (Table S1). By contrast, the loss of Id1 in the epithelium in the absence of DSS led to a statistically significant reduction in the expression of only 3 of 12 genes. These results are consistent with the notion that Id1 loss has the most profound effect on proliferation in the presence of injury. This could be a consequence of a reduced number of stem cells. Further work will be needed to explore this possibility.
Conclusions
Taken together, our results demonstrate that ID1 is not only a marker of adult intestinal stem/progenitor cells but is also important for their function. The current findings suggest a potential role for ID1 agonists in the management of colitis or possibly radiation enteritis. Future studies should explore the mechanism of how ID1 controls intestinal stem cell function and the role of these ID1+ stem/progenitor cells in colitis-related tumor development.
Experimental Procedures
Mice
Inbred male mice (8–10 weeks old) were used. Generation and genotyping of Id1-IRES-CreERT2, Id1v/v, Id1−/−, and Id1fl/fl mice have been described previously (Nam and Benezra, 2009). Inbred C57BL6/J mice were used as wild-type controls in experiments utilizing Id1−/− mice in a C57BL6/J background. Lgr5-EGFP-IRES-CreERT2, Rosa26-LacZ, and B6.SJL-Tg (Vil-cre) 997Gum/J mice were obtained from The Jackson Laboratory.
Tamoxifen Induction
Mice (8–10 weeks old) were injected intraperitoneally with 200 μl tamoxifen in corn oil at 10 mg/ml.
DSS Colitis Model
Mice were treated with 3% DSS (molecular weight 36,000–50,000; MP Biomedicals) for 7 days unless otherwise noted and then switched to tap water for the remainder of the experiment. Clinical scores (diarrhea and bleeding) and histology were determined according to standard procedures (Wirtz et al., 2007) in blinded studies. The animal protocol was approved by the Institutional Animal Care and Use Committee at Memorial Sloan-Kettering Cancer Center.
Histochemistry, IHC, and Immunofluorescence
Small intestines and colons were fixed in 4% paraformaldehyde overnight at 4°C. Anti-ID1 (Biocheck), anti-GFP/YFP (Invitrogen), anti-Ki67 (Vector Labs), and anti-chromogranin A (Abcam) antibodies were used. LacZ staining was performed as previously described (Barker et al., 2007). PAS (Sigma-Aldrich), Alcian blue (Dako), and alkaline phosphatase (Thermo Scientific) staining was performed according to the manufacturers’ protocols. The intensity of ID1 staining was determined by a gastrointestinal pathologist (R.K.Y.) who was blinded to the treatment group. Human tissues were analyzed under a protocol that was approved by the Weill Cornell Medical College Institutional Review Board.
Crypt Analysis
Crypt isolation, cell dissociation, and culture were performed as described previously (Sato et al., 2009).
Flow Cytometry
Venus (YFP)+ and Venus– cells were sorted with an Aria flow cytometer (Becton Dickinson Biosciences). Single viable epithelial cells were gated by forward scatter, side scatter, and pulse-width parameter, and by negative staining for DAPI.
Quantitative Real-Time PCR
RNA was isolated from whole colon using the RNeasy mini kit and poly A RNA was prepared with an Oligotex mRNA mini kit (QIAGEN). Poly A RNA was reversed transcribed using murine leukemia virus reverse transcriptase and oligo (dT)16 primer. The resulting cDNA was used for amplification using the primers listed in Table S2. Glyceraldehyde 3 phosphate dehydrogenase (Gapdh) was used as a normalization control. Real-time PCR was performed using 2× SYBR Green PCR Master Mix on a 7500 Real-Time PCR System (Applied Biosystems). Gene transcript levels were calculated using the ΔΔCt method.
Statistics
A generalized linear mixed-effects model was used to evaluate differences in the probability of having severe diarrhea (diarrhea score > 2) between experimental groups. A linear mixed-effects model was used to compare average bleeding scores across experimental groups, taking into account both between- and within-mouse variations in the endpoints. The nonparametric Wilcoxon rank-sum test was used to examine differences between two experimental groups in various endpoints, including colon length, histology scores, and percentage of viable organoids. Fisher’s exact test was used to compare the distributions of the ordinal IHC staining intensity between control and experimental mice. To compare differences in survival between mice in two experimental groups, the log rank test was used.
Acknowledgments
We thank Courtney Coker for expert assistance with animal husbandry, and Michael Harbus and Claudia Gravaghi for technical assistance. This work was supported by the New York Crohn’s Foundation.
Footnotes
This is an open access article under the CC BY-NC-ND license (http://creativecommons.org/licenses/by-nc-nd/3.0/).
Contributor Information
Andrew J. Dannenberg, Email: ajdannen@med.cornell.edu.
Robert Benezra, Email: r-benezra@ski.mskcc.org.
Supplemental Information
References
- Barker N., van Es J.H., Kuipers J., Kujala P., van den Born M., Cozijnsen M., Haegebarth A., Korving J., Begthel H., Peters P.J., Clevers H. Identification of stem cells in small intestine and colon by marker gene Lgr5. Nature. 2007;449:1003–1007. doi: 10.1038/nature06196. [DOI] [PubMed] [Google Scholar]
- Barker N., Bartfeld S., Clevers H. Tissue-resident adult stem cell populations of rapidly self-renewing organs. Cell Stem Cell. 2010;7:656–670. doi: 10.1016/j.stem.2010.11.016. [DOI] [PubMed] [Google Scholar]
- Barrett L.E., Granot Z., Coker C., Iavarone A., Hambardzumyan D., Holland E.C., Nam H.S., Benezra R. Self-renewal does not predict tumor growth potential in mouse models of high-grade glioma. Cancer Cell. 2012;21:11–24. doi: 10.1016/j.ccr.2011.11.025. [DOI] [PubMed] [Google Scholar]
- Cheng H. Origin, differentiation and renewal of the four main epithelial cell types in the mouse small intestine. IV. Paneth cells. Am. J. Anat. 1974;141:521–535. doi: 10.1002/aja.1001410406. [DOI] [PubMed] [Google Scholar]
- Jankovic V., Ciarrocchi A., Boccuni P., DeBlasio T., Benezra R., Nimer S.D. Id1 restrains myeloid commitment, maintaining the self-renewal capacity of hematopoietic stem cells. Proc. Natl. Acad. Sci. USA. 2007;104:1260–1265. doi: 10.1073/pnas.0607894104. [DOI] [PMC free article] [PubMed] [Google Scholar]
- Lasorella A., Benezra R., Iavarone A. The ID proteins: master regulators of cancer stem cells and tumour aggressiveness. Nat. Rev. Cancer. 2014;14:77–91. doi: 10.1038/nrc3638. [DOI] [PubMed] [Google Scholar]
- Lyden D., Young A.Z., Zagzag D., Yan W., Gerald W., O’Reilly R., Bader B.L., Hynes R.O., Zhuang Y., Manova K., Benezra R. Id1 and Id3 are required for neurogenesis, angiogenesis and vascularization of tumour xenografts. Nature. 1999;401:670–677. doi: 10.1038/44334. [DOI] [PubMed] [Google Scholar]
- Madison B.B., Dunbar L., Qiao X.T., Braunstein K., Braunstein E., Gumucio D.L. cis elements of the villin gene control expression in restricted domains of the vertical (crypt) and horizontal (duodenum, cecum) axes of the intestine. J. Biol. Chem. 2002;277:33275–33283. doi: 10.1074/jbc.M204935200. [DOI] [PubMed] [Google Scholar]
- Nam H.S., Benezra R. High levels of Id1 expression define B1 type adult neural stem cells. Cell Stem Cell. 2009;5:515–526. doi: 10.1016/j.stem.2009.08.017. [DOI] [PMC free article] [PubMed] [Google Scholar]
- Perk J., Gil-Bazo I., Chin Y., de Candia P., Chen J.J., Zhao Y., Chao S., Cheong W., Ke Y., Al-Ahmadie H. Reassessment of id1 protein expression in human mammary, prostate, and bladder cancers using a monospecific rabbit monoclonal anti-id1 antibody. Cancer Res. 2006;66:10870–10877. doi: 10.1158/0008-5472.CAN-06-2643. [DOI] [PubMed] [Google Scholar]
- Potten C.S. Extreme sensitivity of some intestinal crypt cells to X and gamma irradiation. Nature. 1977;269:518–521. doi: 10.1038/269518a0. [DOI] [PubMed] [Google Scholar]
- Quante M., Wang T.C. Stem cells in gastroenterology and hepatology. Nat. Rev. Gastroenterol. Hepatol. 2009;6:724–737. doi: 10.1038/nrgastro.2009.195. [DOI] [PMC free article] [PubMed] [Google Scholar]
- Romero-Lanman E.E., Pavlovic S., Amlani B., Chin Y., Benezra R. Id1 maintains embryonic stem cell self-renewal by up-regulation of Nanog and repression of Brachyury expression. Stem Cells Dev. 2012;21:384–393. doi: 10.1089/scd.2011.0428. [DOI] [PubMed] [Google Scholar]
- Sangiorgi E., Capecchi M.R. Bmi1 is expressed in vivo in intestinal stem cells. Nat. Genet. 2008;40:915–920. doi: 10.1038/ng.165. [DOI] [PMC free article] [PubMed] [Google Scholar]
- Sato T., Vries R.G., Snippert H.J., van de Wetering M., Barker N., Stange D.E., van Es J.H., Abo A., Kujala P., Peters P.J., Clevers H. Single Lgr5 stem cells build crypt-villus structures in vitro without a mesenchymal niche. Nature. 2009;459:262–265. doi: 10.1038/nature07935. [DOI] [PubMed] [Google Scholar]
- Snippert H.J., van der Flier L.G., Sato T., van Es J.H., van den Born M., Kroon-Veenboer C., Barker N., Klein A.M., van Rheenen J., Simons B.D., Clevers H. Intestinal crypt homeostasis results from neutral competition between symmetrically dividing Lgr5 stem cells. Cell. 2010;143:134–144. doi: 10.1016/j.cell.2010.09.016. [DOI] [PubMed] [Google Scholar]
- Tessner T.G., Cohn S.M., Schloemann S., Stenson W.F. Prostaglandins prevent decreased epithelial cell proliferation associated with dextran sodium sulfate injury in mice. Gastroenterology. 1998;115:874–882. doi: 10.1016/s0016-5085(98)70259-8. [DOI] [PubMed] [Google Scholar]
- Wirtz S., Neufert C., Weigmann B., Neurath M.F. Chemically induced mouse models of intestinal inflammation. Nat. Protoc. 2007;2:541–546. doi: 10.1038/nprot.2007.41. [DOI] [PubMed] [Google Scholar]
- Ying Q.L., Nichols J., Chambers I., Smith A. BMP induction of Id proteins suppresses differentiation and sustains embryonic stem cell self-renewal in collaboration with STAT3. Cell. 2003;115:281–292. doi: 10.1016/s0092-8674(03)00847-x. [DOI] [PubMed] [Google Scholar]
Associated Data
This section collects any data citations, data availability statements, or supplementary materials included in this article.