

Abstract
Temporal expectations have been shown to enhance visual analysis of task-relevant events, especially when these are coupled with spatial expectations. Oscillatory brain activity, particularly in the alpha band, has been implicated in regulating excitability in visual areas as a function of anticipatory spatial attention. Here we asked whether temporal expectations derived from regular, rhythmic events can modulate ongoing oscillatory alpha-band activity, so that the changes in cortical excitability are focused over the time intervals at which target events are expected. The task we used involved making a perceptual discrimination about a small target stimulus that reappeared from “behind” a peripheral occluding band. Temporal expectations were manipulated by the regular, rhythmic versus irregular, arrhythmic approach of the stimulus toward the occluding band. Alpha-band activity was measured during the occlusion period, in which no stimulus was presented, but target reappearance was anticipated in conditions of high versus low temporal expectation. Time–frequency analysis showed that the amplitude of alpha-desynchronization followed the time course of temporal expectations. Alpha desynchronization increased rhythmically, peaking just before the expected reappearance of target times. Analysis of the event-related potentials evoked by the subsequent target stimuli showed enhancement of processing at both visual and motor stages. Our findings support a role for oscillations in regulating cortical excitability and suggest a plausible mechanism for biasing perception and action by temporal expectations.
Introduction
Timing is an essential dimension of our behavior. A survey across several areas of neuroscientific and cognitive research has made it clear that temporal expectations can influence several stages of neural processing and optimize multiple aspects of behavior (Nobre et al., 2007). In addition to marked effects in enhancing motor functions, recent studies have revealed effects of temporal expectations during early stages of information processing, enhancing responses in visual cortex in humans (Doherty et al., 2005; Praamstra et al., 2006) and other animals (Ghose and Maunsell, 2002; Anderson and Sheinberg, 2008; Ghose and Bearl, 2010; Jaramillo and Zador, 2011). In particular, Doherty et al. (2005) manipulated temporal and spatial expectations orthogonally and found that temporal expectations exert the strongest effects when coupled with spatial predictions. The effects of temporal expectations upon perceptual functions may, therefore, work primarily by timing responses to other stimulus features that can be clearly mapped onto neural receptive-field properties (Nobre, 2010).
Whereas the ability of temporal expectations to impact upon performance is becoming increasingly acknowledged, how this is achieved remains a mystery. Jones has proposed that regular stimulus rhythms can ‘entrain’ attention to optimize the perceptual processing of forthcoming events occurring at the predicted intervals (for a review see Jones, 2010). To explore the neural viability of this proposal, we tested whether regular, predictable events change cortical excitability to maximize neural preparation in time with anticipated events (see also Lakatos et al., 2008; 2009).
We were particularly interested in whether desynchronization of alpha-band activity would follow the time course of temporal expectations induced by predictable stimulus intervals. Alpha-band oscillations have been identified as a major neural mechanism contributing to perceptual facilitation as a result of anticipatory spatial, intermodal, and feature-based visual attention. During anticipatory spatial attention, alpha-band activity becomes desynchronized over contralateral posterior electrodes in a topographically specific way, and fluctuations in alpha predict subsequent behavioral performance (Foxe et al., 1998; Worden et al., 2000; Kelly et al., 2006, 2009; Thut et al., 2006; Rihs et al., 2007, 2009; Bollimunta et al., 2008, 2011; Wyart and Tallon-Baudry, 2008; Yamagishi et al., 2008; Mathewson et al., 2009; O'Connell et al., 2009; Snyder and Foxe, 2010; Händel et al., 2011; Rajagovindan and Ding, 2011; cf. Mo et al., 2011). Furthermore, the degree of alpha-power lateralization varies systematically according to the spatial certainty of upcoming events (Gould et al., 2011). Studies using transcranial magnetic stimulation (TMS) have confirmed the causal involvement of alpha-band activity in anticipatory attention (Romei et al., 2008, 2010; Capotosto et al., 2009).
In the current study, we investigated whether and how oscillatory brain activity is organized according to the temporal regularity of events. More specifically, we tested whether temporal expectations influence the timing of alpha-band desynchronization in a way that could lead to sharpening of neural activity related to anticipatory attention. We also tested the effect of temporal expectations when combined with spatial expectations in boosting perceptual analysis and in enhancing motor preparation after target discrimination.
Materials and Methods
Participants.
Data are presented from 20 healthy, right-handed participants [mean age, 23.9 years (SD, 4.9 years); range, 19–32 years; 9 males]. Visual acuity was normal or corrected to normal. All experimental methods had ethical approval from the Central University Research Ethics Committee of the University of Oxford.
Stimuli and task.
We adapted the task used by Doherty et al. (2005) (see also Rohenkohl et al., 2011) to manipulate temporal expectations about stimuli that moved across the screen along a linear spatial trajectory (Fig. 1a). A white ball moved diagonally across a computer screen in discrete steps until reaching an occluding band. The ball then disappeared for one step “behind” the occluding band, before reappearing on the other side for one final step. The reappearance of the ball was the “target” event. Participants were required to make a forced-choice perceptual discrimination about the target stimulus. Spatial expectation was present and was fixed over all trials. Temporal expectation was manipulated on a trial-by-trial basis according to whether the ball moved across the screen in fixed or variable intervals. In conditions of strong temporal expectation, the stimulus moved in regular and predictable intervals of isochronous rhythm, and the timing of target reappearance could be predicted with high validity. In the neutral condition, the stimulus moved in irregular and unpredictable intervals, and the timing of the target stimulus could not be predicted from the preceding motion.
Figure 1.

Task and behavioral results. a, The six pictures represent the task at three different stages. First, a white ball appeared at the left side of the screen and moved diagonally across the screen in seven steps (its previous trajectory is indicated by the dashed line). After reaching the gray occluding band, the ball disappeared underneath for one step. When the ball reappears, it contains either an upright (50%) or a tilted (50%) cross. Temporal expectations were induced by the rhythm of the balls during the preocclusion period. b, A bar graph indicating the mean reaction time averaged over subjects for targets in valid, neutral, or invalid trials appearing after the short or long occlusion intervals (n = 20). Error bars indicate the SEM.
The display consisted of a gray background, with a small white rectangle as the fixation point (0.16°) placed at the center of the screen, and a white vertical occluding band (width: 3.5°) placed on the right (11.4–14.7° eccentricity). A trial started with the appearance of a stimulus (ball of 1.0° diameter) at the upper (50%) or lower (50%) left side of the screen. The ball moved across the display in a linear diagonal spatial trajectory in seven steps. Each ball was presented for 200 ms, and successive balls were separated by a fixed (200 or 600 ms) or variable (100–700 ms) delay. Upon reaching the “occluder,” the ball disappeared for one step, and then reappeared at the other side at one of two intervals (600 or 1400 ms). Upon its reappearance, the ball contained an upright (50%) or a tilted (50%) cross. Participants were required to make a forced-choice perceptual discrimination and to make a speeded response indicating the tilt of the cross with their right or left hand. The hand assigned to each tilt was counterbalanced across participants. Participants maintained visual fixation in the center of the screen throughout the task, and performed the task using covert attention.
All trials contained strong spatial expectation. The spatial location of the target was fully predicted by the diagonal trajectory in approaching the occluder. Temporal expectation was manipulated according to the interstimulus interval (ISI) between each successive ball. In rhythmic conditions, the ISI between successive stimuli was fixed (either 200 or 600 ms), and the rhythm predicted when the imperative target stimulus would reappear after occlusion. In the arrhythmic condition, the ISIs between successive stimuli varied randomly between 100 and 700 ms, and it was not possible to predict the interval of the imperative target stimuli. The occlusion interval was always either 600 ms (short) or 1400 ms (long). The short occlusion period corresponded to the interval predicted for the ball moving at the fast rhythm to reappear after the invisible, occluded step. The 600 ms occlusion period included the following: the 200 ms ISI after occlusion of the ball, the 200 ms duration of the occluded ball, and the 200 ms ISI before the reappearance of the ball. Similarly, the long occlusion validly predicted the interval after which the ball moving at the slow rhythm would reappear. The 1400 ms occlusion period included: the 600 ms postocclusion ISI, the 200 ms duration of occluded ball, and the 600 ms ISI before target reappearance. Therefore, fast and slow rhythmic conditions validly cued for short (600 ms) and long (1400 ms) occlusion periods, respectively. The arrhythmic condition provided a neutral cue with respect to the two possible occlusion intervals.
A total of 504 trials were presented, equally distributed in short/long occlusion and left/right-hand response. Rhythmic trials constituted 56% of trials (280 trials). The target occurred at the valid, predicted interval on the majority of rhythmic trials (∼79% of rhythmic trials and 44% of total trials, 224 trials). On a minority of rhythmic trials, the temporal expectation was violated, and targets appeared at the invalid interval (∼31% of rhythmic trials and 12% of total trials, 56 trials). In these cases, a long occlusion interval followed a ball moving at the fast rhythm or a short occlusion followed a ball moving at a slow rhythm. On the remaining 44% of trials (neutral condition), the stimuli appeared in an arrhythmic manner (100–700 randomized ISIs), preventing participants from predicting the occlusion interval. In the arrhythmic, neutral condition, the target occurred with equal probability at each of the two intervals.
Procedure.
Participants were seated in a dimly illuminated, electrically shielded room, and positioned at a 100 cm distance from the screen. The stimuli were presented using Presentation software (Version 12.2, www.neurobs.com), on a 21 inch CRT monitor (CTX ultra screen). The experimental session lasted ∼1 h. Participants were instructed to maintain central fixation throughout the whole experiment.
EEG recording.
The EEG was acquired continuously from 34 Ag/AgCl electrodes at 1000 Hz. The right mastoid site was used as the active reference during data acquisition. The midline electrode between FPZ and FZ (AFZ) acted as the ground, and data were acquired with no high-pass filter and with a 300 Hz low-pass filter. The electrodes were positioned according to the 10-20 International system (AEEGS, 1991) and recorded using NuAmp amplifiers (Neuroscan). Electrode impedances were kept below 5 kΩ. The montage included six midline sites (FZ, FCZ, CZ, CPZ, PZ, and OZ) and 14 sites over each hemisphere (FP1/FP2, F7/F8, F3/F4, FT7/FT8, FC3/FC4, T7/T8, C3/C4, TP7/TP8, CP3/CP4, P7/P8, P3/P4, PO7/PO8, PO3/PO4, and O1/O2). In addition, signals were recorded from the left mastoid for subsequent re-referencing; and electrodes placed around the eyes were used for deriving bipolar electrooculogram (EOG) signals. Signals were recorded from electrodes placed to the side of each eye for the horizontal EOG, and from electrodes above and below the left eye for the vertical EOG.
General preprocessing.
For all subsequent electrophysiological analyses, the continuous EEG was re-referenced to the algebraic average of the right and left mastoids and the bipolar EOG signals were calculated from the relevant pair of eye channels. After filtering, where appropriate, data were epoched according to the specific analysis. In all cases, epochs with containing artifacts, eye movements, blinks, or errors were excluded. Epochs containing excessive noise or drift (±100 μV at any electrode) or eye artifacts (blinks or saccades) were rejected. Blinks and saccades were identified as large deflections (±50 μV) in the horizontal or vertical EOG electrodes. All traces were subsequently visually inspected to remove any residual blinks or saccades. A minimum criterion of 30 trials per condition was set to ensure data quality.
Time–frequency processing and analysis.
Time–frequency analyses of data during the occlusion period were performed to test for temporal variations in oscillatory brain activity related to temporal expectations. Time–frequency analyses were performed with Matlab-based FieldTrip toolbox (http://www.ru.nl/neuroimaging/fieldtrip/). No filtering was performed for the time–frequency analysis.
Data were analyzed for valid and neutral trials in both short-occlusion and long-occlusion conditions. It was not possible to analyze data in the invalid-target condition because of the inherently small number of trials in this condition (<30 before any artifact rejection). To ensure sufficient time for estimating slow oscillations, epochs started 700 ms before occlusion, and lasted 1800 ms after the onset of the occlusion. The same epoch duration was used for long- and short-occlusion trials, although data from short-occlusion trials were only analyzed until the termination of the occlusion period. Due to the long duration of the epochs, data from three participants had to be excluded from the frequency analysis due to excessive artifacts (<30 trials per condition).
To analyze modulations in power of oscillatory brain activity, a time–frequency transformation (5 cycles per time window) was applied to all electrodes in each trial using a Hanning taper. This transformation produced an estimate of oscillatory raw power for each time sample (in 10 ms steps) and each frequency between 1 and 30 Hz (in 1 Hz steps).
Two convergent approaches were used to test for modulations of alpha-band power between valid, rhythmic and neutral, arrhythmic conditions over posterior electrodes (PO3/4, PO7/8, and O1/2). In a hypothesis-driven approach, we compared alpha power between valid and neutral conditions in the time period just preceding the appearance of the target in the short- and long-occlusion trials, and in the time period just preceding the invisible, occluded step in long-occlusion trials. It was not possible to test the time period just before the invisible step in the short-occlusion trials because there was not sufficient time for accurately estimating alpha power. An omnibus ANOVA was performed containing the following factors: validity (valid and neutral), electrode side [left (contralateral to target) and right (ipsilateral)], and interval [invisible step in long occlusion (400–600 ms from occlusion), pretarget in long occlusion (1200–1400 ms from occlusion), pretarget in short occlusion (400–600 ms from occlusion)].
In addition, a hypothesis-independent approach was also used to identify clusters in which the difference between valid and neutral was significantly different from 0 (Maris and Oostenveld, 2007). The cluster-analysis approach provides a data-driven view of modulations in the pattern of the oscillatory activity without making strong prior assumptions, and is well suited to control for the problem of multiple comparisons. We calculated the difference in amplitude values between valid and neutral conditions for each frequency band (6–16 Hz, in 1 Hz steps) over each time point during the occlusion period (in 10 ms steps) for each subject. Values that exceeded an a priori threshold on t tests comparing differences to zero (uncorrected: p < 0.05) were selected. These selected time points were then clustered based on spectral and temporal adjacency. The sums of the t values within contiguous clusters were used as the cluster-level statistics. The data were then randomized across the two conditions, and shuffled cluster-level statistics were generated. This permutation was performed 1000 times. Finally, corrected p-values were calculated by comparing the values of the cluster-level statistics of the original data against the distribution of shuffled cluster-level statistics across permutations.
Phase-locking values (PLVs; also called phase-locking factor or intertrial coherence) were used to investigate the phase alignment of ongoing brain oscillations across trials (Lachaux et al., 1999). PLVs were estimated by computing the wavelet decomposition for each trial and then calculating the complex average of the normalized values for each time point (in 10 ms steps) and frequency bin (1–30 Hz, in 1 Hz steps). The resultant values range from 0 to 1, where a value of 0 means a random phase across trials, and a value of 1 indicates perfect synchronization.
ERPs and LRPs.
Processing steps for calculating event-related potential (ERP) and lateralized readiness potential (LRP) waveforms were performed using Neuroscan version 4.3 (Neuroscan). In addition, Cartool software (D. Brunet, Functional Brain Mapping Laboratory, Geneva, Switzerland) was used for identifying periods of stable scalp topographies in ERP and LRP waveforms, and for generating plots of scalp topographies. Scalp topographies of grand-averaged ERPs and LRPs referenced to the average of all scalp electrodes and normalized by the global field power were subjected to a spatiotemporal clustering algorithm to determine the number, nature, and timings of topographies that best explained topographical variance across conditions (Atomize & Agglomerate Hierarchical Clustering; minimum segment duration of 20 ms).
ERPs were constructed for valid (rhythmic condition) and neutral (arrhythmic condition) targets appearing after the short-occlusion interval to investigate whether and how temporal expectations modulated perceptual and later stages of target-processing analysis. Data were low-pass filtered (40 Hz, 24 dB/oct) and subsequently epoched from −200 to 600 ms relative to target onset. The interval from 0 to 50 ms was used to calculate the baseline for the ERP. An average of 87 (minimum of 74) trials was obtained per subject for valid and neutral conditions. ERPs could not be analyzed for the invalid targets because of the small number of trials in this condition.
To investigate whether and how temporal expectations modulate neural activity leading to the selection and preparation of the appropriate motor response, the target-locked LRP was also calculated for valid and neutral trials. The baseline period was set to −200 to 0 ms relative to target onset. Linear trends present during this baseline period were also removed from the data to correct for residual drifts. The LRP was calculated using electrodes C3 and C4 sensitive to motor and premotor brain activity, by computing the mean difference between activity over contralateral versus ipsilateral electrodes (Coles, 1989): {[mean (C4 − C3)left-hand + mean (C3 − C4)right-hand]/2}.
Results
Behavioral results
Performance in this task was very accurate (91.8–94.4% correct) and did not differentiate between conditions. The behavioral benefits conferred by temporal expectations were observed mainly in reaction times (RTs). Figure 1b shows the average RTs to discriminate the target stimuli at the two occlusion intervals. Reaction times from correct responses were submitted to a repeated-measures ANOVA, testing the effects of temporal expectation (valid, neutral, or invalid) and occlusion interval (short or long). A significant interaction between temporal expectation and occlusion interval (F(2,18) = 32.46, p < 0.001) replicated the well established finding that temporal orienting effects are more pronounced at short intervals (Coull and Nobre, 1998; Griffin et al., 2001; Anderson and Sheinberg, 2008; Correa and Nobre, 2008). Post hoc analyses using paired-samples t tests adjusted for multiple comparisons (Bonferroni) demonstrated clear validity benefits (RTs valid < neutral < invalid) after the short occlusion interval (t(19) values > 4.93, p values <0.01), but no significant validity effects after the long occlusion (t(19) values < 2.77, p values >0.05) (Fig. 1b).
Brain oscillations underlying visual perceptual enhancement
Time–frequency analyses of EEG data during the occlusion period were performed to track whether the power or phase of oscillatory brain activity was modulated by the regular rhythmic events in a way that could enhance preparatory cortical excitability to temporally expected events. The analyses of oscillatory activity were performed during the occlusion interval, during which time no stimulus occurred for 600 ms (short occlusion) or 1400 ms (long occlusion). The occlusion period is ideal to quantify fluctuations in oscillatory activity related to temporal expectations in the absence of any stimulus-driven effects. During this interval, the rhythmic conditions should induce higher expectations for the interval at which the target is to appear, when compared to arrhythmic trials. If temporal expectations time-modulate spatial attention mechanisms, one would expect desynchronization of alpha-band oscillations to fluctuate in accordance to the stimulus rhythm, and to peak just before the onset of the expected stimulus.
Figures 2a and 3a show the time–frequency plots contrasting induced oscillatory activity in the rhythmic (valid) and arrhythmic (neutral) conditions in short- and long-occlusion trials, respectively. These plots show the temporal evolution of modulation in oscillatory power by using the arrhythmic, neutral condition as a baseline to control for general and temporally nonspecific changes in oscillatory activity occurring throughout the occlusion period. The time course of the alpha-band modulation by rhythmic temporal expectation relative to the neutral, baseline condition is plotted in Figure 2b for the short-occlusion condition and in Figure 3b for the long-occlusion condition. The omnibus ANOVA comparing power of alpha-band activity (8–12 Hz) over posterior electrodes (PO3/4, P07/8, and O1/2) confirmed that alpha power was higher in the rhythmic, temporal-expectation conditions relative to the neutral condition in the 200 ms time periods just preceding the reappearance of the target and the occluded step in the long-occlusion trials (main effect of validity: F(1,16) = 6.98, p < 0.05). There was also a main effect of electrode side, showing relative desynchronization of alpha over contralateral electrodes related to the spatial anticipation of the target (F(1,16) = 4.70, p < 0.05) (illustrated in Fig. 2c for the short-occlusion condition). There was no interaction between validity and electrode side, suggesting that the additional modulation of alpha according to temporal expectation was not significantly lateralized (see Fig. 2d for topographical distribution of the effect in the short-occlusion condition and Fig. 3c for long-occlusion condition). There were no differences between the effects in the three time intervals considered, nor any additional effects or interactions (p values > 0.20). The omnibus ANOVA was followed-up by planned t tests, which confirmed the significance decrease in alpha-power (8–12 Hz) in the valid condition relative to the neutral condition over the posterior electrodes (Oz, PO3/4, P07/8, and O1/2) at each of the relevant time periods: 200 ms before appearance of the target in the short-occlusion condition (t(16) = 2.12, p = 0.024) (see Fig. 2b), 200 ms before the occluded step in the long-occlusion condition (t(16) = 2.59, p = 0.010), and 200 ms before appearance of the target in the long-occlusion condition) (t(16) = 2.11, p = 0.026) (see Fig. 3b). The topographic distributions of alpha-modulation by temporal expectations in these three periods were very similar, and showed concentration of the effects over the lateral posterior region of the scalp (Figs. 2d, 3c). It was not possible to analyze separately trials in which the target appeared at the lower versus upper position due to the number of trials. However, visualization of the topographical maps of alpha synchronization in these two conditions showed a pattern of distribution similar to that previously reported (Worden et al., 2000; Rihs at al., 2007). Alpha desynchronization was more ventral and lateral for targets expected at the lower relative to the upper visual field.
Figure 2.
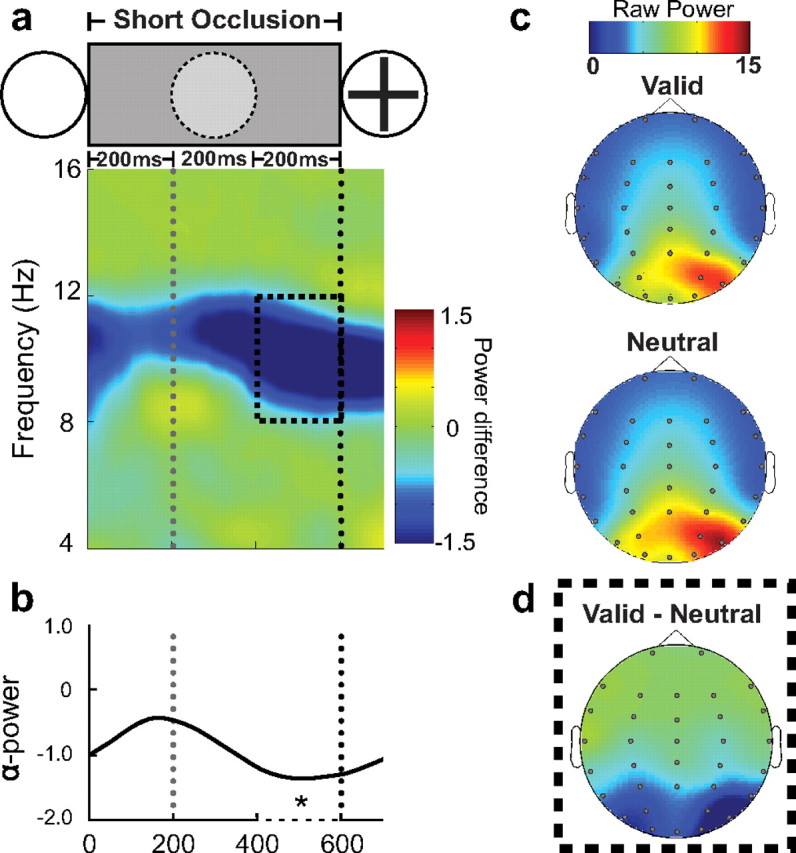
Alpha activity during the short occlusion period. The figure shows the alpha-band desynchronization in the valid, rhythmic condition relative to the neutral, arrhythmic condition for short-occlusion trials [Valid − Neutral]. The gray doted line shows the time that the occluded stimulus would be presented. The black doted line indicates the onset of the target. a, Color map of the frequency amplitude between 4 and 16 Hz after subtraction of the neutral (i.e., arrhythmic) from the valid (i.e., rhythmic) conditions. Black dashed box shows the time and frequency of interest analyzed. b, Lines showing the average of alpha power during the short occlusion period. c, Topographies showing the scalp distribution of raw alpha power (8–12 Hz) preceding target presentation (200 before target onset) for the valid, neutral conditions. d, Topography of alpha desynchronization of the difference between valid and neutral conditions.
Figure 3.
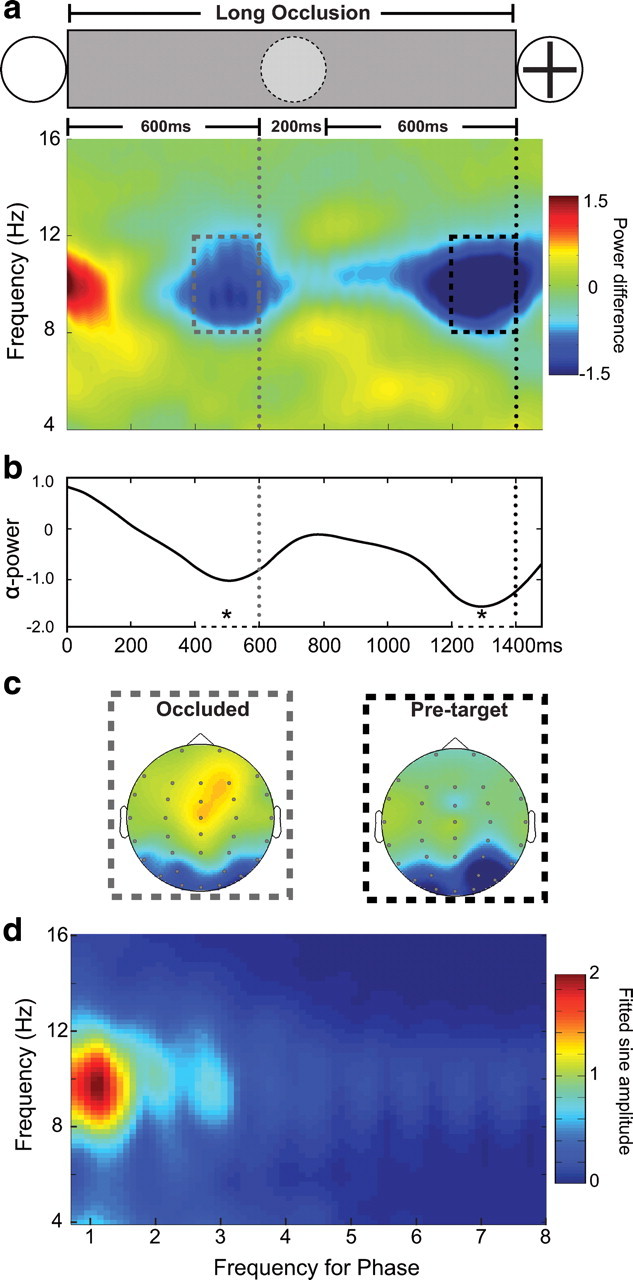
Alpha activity during the long occlusion period. The figure shows the alpha-band desynchronization in the valid, rhythmic condition relative to the neutral, arrhythmic condition for long-occlusion trials [Valid − Neutral]. The gray doted line shows the time that the occluded stimulus would be presented. The black dotted line indicates the onset of the target. a, Color map of the frequency amplitude between 4 and 16 Hz after subtraction of the neutral (i.e., arrhythmic) from the valid (i.e., rhythmic) conditions. Dashed boxes show the time and frequency of interest analyzed for the occluded stimulus (gray) and target (black). b, Lines showing the average of alpha power during the short occlusion period. c, Topography of alpha desynchronization (8–12 Hz) of the difference between valid and neutral conditions preceding the occluded (gray dashed box) and pretarget (black dashed box) stimuli. d, Sine waves of different frequencies (0.75–8 Hz) fitted to induced power across a range of frequencies (4–16 Hz).
To interrogate the pattern of results in a data-driven way, we also performed a cluster-based nonparametric randomization test (Maris and Oostenveld, 2007) comparing valid and neutral conditions in the short-occlusion and long-occlusion conditions. Analysis of the short-occlusion conditions revealed one significant cluster preceding target onset (p < 0.05). Analysis of the long-occlusion condition revealed two significant clusters (p values < 0.03) occurring in the periods preceding the occluded step and preceding target appearance. These cluster-based effects were qualitatively similar to the hypothesized effects, providing convergent evidence for the results. No other cluster of effects was significant, showing temporal expectations to modulate oscillatory brain activity primarily within the alpha-band.
An additional data-driven analysis used the data in the long-occlusion conditions to test what rhythm optimally explained the fluctuation of alpha-band power by temporal expectations. If alpha modulation is mainly explained by the preceding stimulus rhythm (800 ms stimulus-onset asynchrony, 1.25 Hz), then the best fit should occur between alpha-power and 1.25 Hz. Sine waves of different frequencies (0.75–8 Hz) were fitted to induced power across a range of frequencies (4–16 Hz) at the individual subject level. The sine-fitting analysis was performed independently for each subject, using an unconstrained nonlinear minimization of the sum of squared residuals with respect to the amplitude and phase of sine waves at different frequencies (Ezyfit toolbox for Matlab). The results across all participants indicated that the amplitude of the best-fitting sine waves occurred between the rhythm of the temporal cues and the alpha-band activity (Fig. 3d). No other couplings occurred, pointing to the specificity of this effect.
Similar to the analysis used to test the power of alpha-band activity, a repeated-measures ANOVA tested the effect of temporal expectations on phase synchronization (PLV) of brain oscillations ranging from 1 to 30 Hz. This analysis yielded no significant effects during the occlusion interval (p values >0.10).
Early perceptual modulation by temporal expectation
In line with the behavioral findings, analysis of the neural consequences of temporal expectation on target-related processing focused on the short occlusion interval. In particular, we tested for enhancement of early visual activity in the first identifiable visual potential (P1) evoked by the target stimulus in the valid rhythmic, condition relative to the neutral, arrhythmic condition. The invalid condition could not be analyzed due to insufficient number of trials (<30).
Figure 4a shows the visual potentials P1 and N1 for valid and neutral conditions across the group of participants. The scalp distributions of these potentials, extracted from stable periods of topographies using the Cartool software (see Materials and Methods) are also shown. The visual P1 potential was maximally distributed at lateral posterior electrodes PO7/8, PO3/4, and O1/2, and peaked earlier in electrodes over the left hemisphere, which was contralateral to the target location (∼125 ms), than over the ipsilateral (∼130 ms) hemisphere. Modulation of the mean amplitude of P1 was tested with a repeated-measures ANOVA including the factor of temporal expectation (valid, neutral), as well as hemisphere (contralateral, ipsilateral) and electrode pairs (PO7/8, PO3/4, O1/2). Temporal expectation exerted a significant main effect on the mean amplitude of P1 (F(1,19) = 13.14, p = 0.002), measured using a period of 20 ms around the peak latency in each hemisphere. P1 amplitude was significantly greater in valid compared to neutral trials (Fig. 4a). An interaction between temporal expectation and hemisphere (F(1,19) = 5.89, p = 0.025) indicated that these effects were larger in the ipsilateral hemisphere (F(1,19) = 8.78, p = 0.008). Subsidiary, follow-up ANOVAs testing the effect of temporal expectation at each hemisphere showed the effect to be significant over both contralateral (F(1,19) = 5.85, p = 0.026) and ipsilateral (F(1,19) = 14.11, p = 0.001) sites. An ANOVA using the same factors was applied to test for the N1 potential (165–185 ms). There was no significant modulation of the N1 by temporal expectations.
Figure 4.
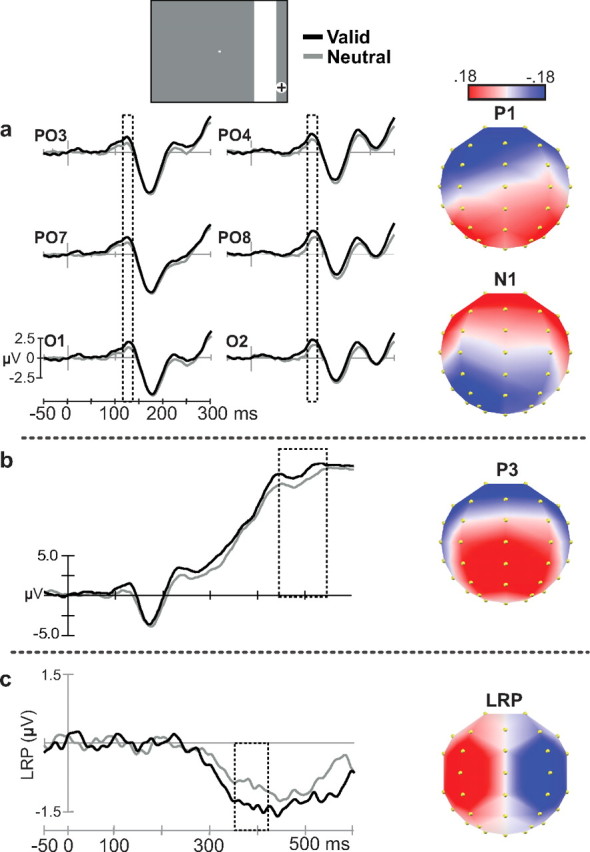
Enhanced temporal expectation modulation of early visual P1, later P3, and motor (LRP) components. a, Visual components P1 from grand-averaged waveforms (n = 20 subjects) are shown for the lateral posterior electrodes analyzed for the valid (rhythmic—green line) and neutral (arrhythmic—blue line) conditions. The dashed line indicates the time of interest. b, Example electrode showing the effect of temporal expectations in the later P3 component. c, Average of the lateralized readiness potential from the valid and neutral conditions. Dashed lines show the analysis window used for comparing LRP amplitude between valid and neutral conditions (p < 0.05). Topographical maps generated by each potential are shown in the right side.
The late P3 potential evoked by the target was analyzed using a broad window centered around its peak, 450 and 550 ms, over midline and flanking electrodes (F3/z/4, FC3/z/4, C3/z/4, CP3/z/4, P3/z/4) in a repeated-measures ANOVA including the factors of temporal expectation (valid, neutral) and electrodes. As expected, temporal expectation increased the P3 amplitude (F(1,19) = 5.83, p = 0.026) (Fig. 4b). Topographical analysis also showed that the topography associated with the P3 started earlier in the valid condition (onset at 366 ms) than in the neutral condition (onset at 373 ms).
Motor preparatory activity to forthcoming events
To analyze the effect of temporal expectation on motor selection and preparation, we analyzed the LRP, which isolates lateralized activity in premotor and motor cortex (Coles, 1989; Osman et al., 1995; Ulrich and Miller, 2001). Topographical analysis comparing the time course of the LRP in valid versus neutral short-occlusion conditions showed that temporal expectations in the rhythmic, valid condition led to an earlier onset of the characteristic LRP topography (316 ms) than in the arrhythmic neutral condition (380 ms). Analysis of the mean amplitude of the LRP between 350 and 420 ms corroborated this pattern of findings, by showing that the amplitude of the LRP in the condition of valid temporal expectations was significantly larger than that in the neutral condition (F(1,19) = 4.91, p = 0.039) (Fig. 4b). The amplitude analysis of the LRP may have captured both its earlier onset and its larger final amplitude in the valid compared to neutral condition. As expected, the LRP amplitude showed an inverse correlation with reaction times (valid r(19) = 0.513, p = 0.02; neutral r(19) = 0.470, p = 0.037).
Discussion
The results in this experiment demonstrate that temporal expectations developed from a regular, predictable rhythmic pattern of stimulation can time-modulate the pattern of oscillatory brain activity during anticipatory attention in a way that may enhance the analysis of anticipated events.
Rhythmic visual cues were effective at inducing temporal expectations about when a target event would occur after a brief period of occlusion relative to arrhythmic cues. These temporal expectations combined with spatial attention to speed up response times to the target stimulus. Time–frequency analyses of brain activity during the occlusion period showed that modulation of oscillatory activity related to anticipatory spatial attention fluctuated according to the tempo of rhythmic cues. Both hypothesis-driven and data-driven analyses showed that alpha-band desynchronization peaked just before the anticipated appearance of the target in the short-occlusion and long-occlusion conditions. Furthermore, in the long-occlusion condition, it was possible to observe the rhythmic modulation of alpha-band desynchronization, with an additional peak preceding the occluded step. The data-driven analyses showed the specificity of this pattern of modulation as well as its ability to capture the main experimental variance.
The time modulation of alpha-band activity provides a viable putative mechanism for biasing cortical excitability in a way that enhances the perceptual processing of expected events. Our results show that the spatial biasing of visual cortical excitability indexed by modulation in the alpha-band activity is further modulated by rhythmic temporal expectations so that the effects are maximal at the moments just preceding anticipation of the task-relevant stimuli. Our findings support the general theoretical proposal by Jones (2010) that attention can be entrained to the temporal structure of external events to optimize the perceptual processing of an expected forthcoming stimulus.
Our findings also bear similarities to the mechanism proposed by Schroeder and Lakatos for the adjustment of neural excitability through the nesting of high-frequency oscillatory activity within lower-frequency, carrier neural oscillations in the delta and theta range, which in turn can become aligned to relevant patterns of external stimulation (Lakatos et al., 2008, 2009; for review, see Schroeder and Lakatos, 2009). Schroeder, Lakatos, and colleagues have typically used intermodal selective attention tasks (Mehta et al., 2000a,b; Lakatos et al., 2008, 2009), in which interdigitated auditory and visual stimuli are presented rhythmically while subjects attend to one modality or the other. Under these conditions, they report increased entrainment of low-frequency, delta-band activity according to the rate of the stimulation, and concomitant increases in gamma power coupled to delta-band activity in a phase-locked manner (Lakatos et al., 2008, 2009; Besle et al., 2011).
Similarly to Schroeder and Lakatos, we found that our relevant marker of visual excitability (alpha-band desynchronization) followed the base rate of the predictive stimulus rhythm (see Fig. 3). However, there were also some differences in details between our results and their findings and model. These differences can be accounted for by task contexts and stimulus parameters, but are nevertheless important in broadening our understanding of the nature and flexibility of mechanisms for neural modulation according to temporal expectations. Our study was purely visual, and rhythmic temporal expectation combined with spatial expectation to facilitate the perceptual discrimination of stimuli. Furthermore, we were interested in charting changes in neural excitability in a purely anticipatory state of preparatory attention, free from any possible stimulus-related processing. Our analysis window, therefore, was free of any changes in stimulation. The removal of external input may have diminished the phase entrainment of low-frequency activity and contributed to our inability to detect changes in phase locking to the carrier rhythm. Furthermore, our measure of cortical excitability of main interest was a desynchronization. As a consequence, we would not expect to observe significant increases in coupling between the carrier rhythm and the induced alpha-power changes.
Several studies have emphasized the importance of the phase of ongoing alpha-band activity in visual perception and response times (Lansing, 1957; Callaway and Yeager, 1960; Mathewson et al., 2009; Busch et al., 2009; Busch and VanRullen, 2010) [for review, see VanRullen et al. (2011) and Mathewson et al. (2011)]. In our study, no effect of phase of alpha was found. However, since our main result suggests that temporal expectations have a suppressive effect on alpha oscillations, this null effect may result from a poor estimation of the phase in the alpha activity (Mouraux and Iannetti, 2008; Mathewson et al., 2009).
Upon the presentation of target stimuli, early visual responses (P1) were enhanced. The finding replicated and extended previous demonstrations of perceptual facilitation by combined spatial and temporal expectations (Doherty et al., 2005), by showing that perceptual enhancement can also occur during a forced-choice discrimination task, in which the identity of the target is uncertain (see also Ghose and Maunsell, 2002; Praamstra et al., 2006; Praamstra and Pope, 2007; Anderson and Sheinberg, 2008). The P1 potential reflects visual processing in a combination of ventral (Di Russo et al., 2002) and dorsal (Foxe et al., 2001, 2005) extrastriate visual areas. Its amplitude enhancement by spatial attention is a canonical finding, and is thought to reflect more intensive visual analysis for spatially attended relative to unattended stimuli through a gain-control mechanism (Hillyard et al., 1998). The finding replicates and extends previous studies showing the influence of temporal information for visual processing in humans (Doherty et al., 2005; Praamstra et al., 2006; Nobre, 2010) and animals (Ghose and Maunsell, 2002; Anderson and Sheinberg, 2008; Ghose and Bearl, 2010). Since we used EEG, it is not possible to determine exactly which visual area(s) was modulated. In macaque monkeys, temporal expectations enhanced activity in distinct visual areas, such as V4 (Ghose and Maunsell, 2002), MT (Ghose and Bearl, 2010), and IT (Anderson and Sheinberg, 2008). This enhancement is attributed to a boost in the effects of spatial attention when targets were also presented at an expected time. The timing and amplitude of late cognitive potentials were also modulated (Miniussi et al., 1999; Griffin et al., 2002; Doherty et al., 2005; Correa et al., 2006; Correa and Nobre, 2008; Nobre, 2010).
In addition, analysis of the target-locked LRP also provided direct evidence supporting the ability of temporal expectations to modulate the timing and amount of preparatory motor activity. We found that the LRP was both enhanced in amplitude and brought forward in latency. Previous studies have suggested that temporal expectations can exert strong effects on motor processing (Mauritz and Wise, 1986; Riehle et al., 1997; Praamstra et al., 2006; Praamstra and Pope, 2007; Schoffelen et al., 2005, van Ede et al., 2010; Davranche et al., 2011; van Ede et al., 2011) (for review, see Nobre et al., 2007). Single-unit studies have shown systematic changes in neural firing patterns to go-signals in primary motor cortex (Riehle et al., 1997) and premotor areas (Lucchetti and Bon, 2001) as a function of temporal expectation. In humans, the effect of temporal expectations on motor processing is usually based on latency and amplitude modulations of late potentials, such as the P3 (Miniussi et al., 1999; Griffin et al., 2002; Doherty et al., 2005; Correa and Nobre, 2008), as well as interactions of ERP effects with go versus no-go response requirements (Doherty et al., 2005; Correa and Nobre, 2008). Previous tasks have not isolated motor-related activity directly. It is important to note that in our task, response was not specified until target presentation. This motor effect could be a consequence of a modulatory cascade starting with perceptual processing and/or an independent, separate effect acting directly at the level of motor cortex.
In summary, we have shown that combined spatiotemporal expectations modulate different stages of stimulus processing, from the anticipatory changes in alpha-band power to perceptual enhancement in P1 and motor preparation. To our knowledge, this is the first evidence showing that temporal expectation dynamically modulates the timing of alpha-band desynchronization to enhance neural activity associated with anticipatory attention. An important goal for future research will be to investigate the causal relationship between each of these different stages of processing and spatiotemporal expectations using transient (TMS) or permanent lesions.
Footnotes
This work was funded by the Wellcome Trust (A.C.N.) and Programme Alβan, the European Union Programme of High Level Scholarship for Latin America (no. E07D403637BR). We thank Valentin Wyart and Ian Gould for their support on the time–frequency analysis; Anna Dal Molin for her assistance during data collection; and Mark Stokes and André M. Cravo for their comments on the manuscript.
References
- AEEGS. American Electroencephalographic Society guidelines for standard electrode position nomenclature. J Clin Neurophysiol. 1991;8:200–202. [PubMed] [Google Scholar]
- Anderson B, Sheinberg DL. Effects of temporal context and temporal expectancy on neural activity in inferior temporal cortex. Neuropsychologia. 2008;46:947–957. doi: 10.1016/j.neuropsychologia.2007.11.025. [DOI] [PMC free article] [PubMed] [Google Scholar]
- Besle J, Schevon CA, Mehta AD, Lakatos P, Goodman RR, McKhann GM, Emerson RG, Schroeder CE. Tuning of the human neocortex to the temporal dynamics of attended events. J Neurosci. 2011;31:3176–3185. doi: 10.1523/JNEUROSCI.4518-10.2011. [DOI] [PMC free article] [PubMed] [Google Scholar]
- Bollimunta A, Chen Y, Schroeder CE, Ding M. Neuronal mechanisms of cortical alpha oscillations in awake-behaving macaques. J Neurosci. 2008;28:9976–9988. doi: 10.1523/JNEUROSCI.2699-08.2008. [DOI] [PMC free article] [PubMed] [Google Scholar]
- Bollimunta A, Mo J, Schroeder CE, Ding M. Neuronal mechanisms and attentional modulation of corticothalamic alpha oscillations. J Neurosci. 2011;31:4935–4943. doi: 10.1523/JNEUROSCI.5580-10.2011. [DOI] [PMC free article] [PubMed] [Google Scholar]
- Busch NA, VanRullen R. Spontaneous EEG oscillations reveal periodic sampling of visual attention. Proc Natl Acad Sci U S A. 2010;107:16048–16053. doi: 10.1073/pnas.1004801107. [DOI] [PMC free article] [PubMed] [Google Scholar]
- Busch NA, Dubois J, VanRullen R. The phase of ongoing EEG oscillations predicts visual perception. J Neurosci. 2009;29:7869–7876. doi: 10.1523/JNEUROSCI.0113-09.2009. [DOI] [PMC free article] [PubMed] [Google Scholar]
- Callaway E, 3rd, Yeager CL. Relationship between reaction time and electroencephalographic alpha phase. Science. 1960;132:1765–1766. doi: 10.1126/science.132.3441.1765. [DOI] [PubMed] [Google Scholar]
- Capotosto P, Babiloni C, Romani GL, Corbetta M. Frontoparietal cortex controls spatial attention through modulation of anticipatory alpha rhythms. J Neurosci. 2009;29:5863–5872. doi: 10.1523/JNEUROSCI.0539-09.2009. [DOI] [PMC free article] [PubMed] [Google Scholar]
- Coles MG. Modern mind-brain reading: psychophysiology, physiology, and cognition. Psychophysiology. 1989;26:251–269. doi: 10.1111/j.1469-8986.1989.tb01916.x. [DOI] [PubMed] [Google Scholar]
- Correa A, Nobre AC. Neural modulation by regularity and passage of time. J Neurophysiol. 2008;100:1649–1655. doi: 10.1152/jn.90656.2008. [DOI] [PubMed] [Google Scholar]
- Correa A, Lupiáñez J, Madrid E, Tudela P. Temporal attention enhances early visual processing: a review and new evidence from event-related potentials. Brain Res. 2006;1076:116–128. doi: 10.1016/j.brainres.2005.11.074. [DOI] [PubMed] [Google Scholar]
- Coull JT, Nobre AC. Where and when to pay attention: the neural systems for directing attention to spatial locations and to time intervals as revealed by both PET and fMRI. J Neurosci. 1998;18:7426–7435. doi: 10.1523/JNEUROSCI.18-18-07426.1998. [DOI] [PMC free article] [PubMed] [Google Scholar]
- Davranche K, Nazarian B, Vidal F, Coull JT. Orienting attention in time activates left intraparietal sulcus for perceptual and motor task goals. J Cogn Neurosci. 2011 doi: 10.1162/jocn_a_00030. [DOI] [PubMed] [Google Scholar]
- Di Russo F, Martínez A, Sereno MI, Pitzalis S, Hillyard SA. Cortical sources of the early components of the visual evoked potential. Hum Brain Mapp. 2002;15:95–111. doi: 10.1002/hbm.10010. [DOI] [PMC free article] [PubMed] [Google Scholar]
- Doherty JR, Rao A, Mesulam MM, Nobre AC. Synergistic effect of combined temporal and spatial expectations on visual attention. J Neurosci. 2005;25:8259–8266. doi: 10.1523/JNEUROSCI.1821-05.2005. [DOI] [PMC free article] [PubMed] [Google Scholar]
- Foxe JJ, Simpson GV, Ahlfors SP. Parieto-occipital approximately 10 Hz activity reflects anticipatory state of visual attention mechanisms. Neuroreport. 1998;9:3929–3933. doi: 10.1097/00001756-199812010-00030. [DOI] [PubMed] [Google Scholar]
- Foxe JJ, Doniger GM, Javitt DC. Early visual processing deficits in schizophrenia: impaired P1 generation revealed by high-density electrical mapping. Neuroreport. 2001;12:3815–3820. doi: 10.1097/00001756-200112040-00043. [DOI] [PubMed] [Google Scholar]
- Foxe JJ, Murray MM, Javitt DC. Filling-in in schizophrenia: a high-density electrical mapping and source-analysis investigation of illusory contour processing. Cereb Cortex. 2005;15:1914–1927. doi: 10.1093/cercor/bhi069. [DOI] [PubMed] [Google Scholar]
- Ghose GM, Bearl DW. Attention directed by expectations enhances receptive fields in cortical area MT. Vision Res. 2010;50:441–451. doi: 10.1016/j.visres.2009.10.003. [DOI] [PMC free article] [PubMed] [Google Scholar]
- Ghose GM, Maunsell JH. Attentional modulation in visual cortex depends on task timing. Nature. 2002;419:616–620. doi: 10.1038/nature01057. [DOI] [PubMed] [Google Scholar]
- Gould IC, Rushworth MF, Nobre AC. Indexing the graded allocation of visuospatial attention using anticipatory alpha oscillations. J Neurophysiol. 2011;105:1318–1326. doi: 10.1152/jn.00653.2010. [DOI] [PMC free article] [PubMed] [Google Scholar]
- Griffin IC, Miniussi C, Nobre AC. Orienting attention in time. Front Biosci. 2001;6:D660–D671. doi: 10.2741/griffin. [DOI] [PubMed] [Google Scholar]
- Griffin IC, Miniussi C, Nobre AC. Multiple mechanisms of selective attention: differential modulation of stimulus processing by attention to space or time. Neuropsychologia. 2002;40:2325–2340. doi: 10.1016/s0028-3932(02)00087-8. [DOI] [PubMed] [Google Scholar]
- Händel BF, Haarmeier T, Jensen O. Alpha oscillations correlate with the successful inhibition of unattended stimuli. J Cogn Neurosci. 2011;23:2494–2502. doi: 10.1162/jocn.2010.21557. [DOI] [PubMed] [Google Scholar]
- Hillyard SA, Vogel EK, Luck SJ. Sensory gain control (amplification) as a mechanism of selective attention: electrophysiological and neuroimaging evidence. Philos Trans R Soc Lond B Biol Sci. 1998;353:1257–1270. doi: 10.1098/rstb.1998.0281. [DOI] [PMC free article] [PubMed] [Google Scholar]
- Jaramillo S, Zador AM. The auditory cortex mediates the perceptual effects of acoustic temporal expectation. Nat Neurosci. 2011;14:246–251. doi: 10.1038/nn.2688. [DOI] [PMC free article] [PubMed] [Google Scholar]
- Jones MR. Attending to sound patterns and the role of entrainment. In: Nobre AC, Coull JT, editors. Attention and time. Oxford, UK: Oxford UP; 2010. pp. 137–330. [Google Scholar]
- Kelly SP, Lalor EC, Reilly RB, Foxe JJ. Increases in alpha oscillatory power reflect an active retinotopic mechanism for distracter suppression during sustained visuospatial attention. J Neurophysiol. 2006;95:3844–3851. doi: 10.1152/jn.01234.2005. [DOI] [PubMed] [Google Scholar]
- Kelly SP, Gomez-Ramirez M, Foxe JJ. The strength of anticipatory spatial biasing predicts target discrimination at attended locations: a high-density EEG study. Eur J Neurosci. 2009;30:2224–2234. doi: 10.1111/j.1460-9568.2009.06980.x. [DOI] [PubMed] [Google Scholar]
- Lachaux JP, Rodriguez E, Martinerie J, Varela FJ. Measuring phase synchrony in brain signals. Hum Brain Mapp. 1999;8:194–208. doi: 10.1002/(SICI)1097-0193(1999)8:4<194::AID-HBM4>3.0.CO;2-C. [DOI] [PMC free article] [PubMed] [Google Scholar]
- Lakatos P, Karmos G, Mehta AD, Ulbert I, Schroeder CE. Entrainment of neuronal oscillations as a mechanism of attentional selection. Science. 2008;320:110–113. doi: 10.1126/science.1154735. [DOI] [PubMed] [Google Scholar]
- Lakatos P, O'Connell MN, Barczak A, Mills A, Javitt DC, Schroeder CE. The leading sense: supramodal control of neurophysiological context by attention. Neuron. 2009;64:419–430. doi: 10.1016/j.neuron.2009.10.014. [DOI] [PMC free article] [PubMed] [Google Scholar]
- Lansing RW. Relation of brain and tremor rhythms to visual reaction time. Electroencephalogr Clin Neurophysiol. 1957;9:497–504. doi: 10.1016/0013-4694(57)90037-8. [DOI] [PubMed] [Google Scholar]
- Lucchetti C, Bon L. Time-modulated neuronal activity in the premotor cortex of macaque monkeys. Exp Brain Res. 2001;141:254–260. doi: 10.1007/s002210100818. [DOI] [PubMed] [Google Scholar]
- Maris E, Oostenveld R. Nonparametric statistical testing of EEG- and MEG-data. J Neurosci Methods. 2007;164:177–190. doi: 10.1016/j.jneumeth.2007.03.024. [DOI] [PubMed] [Google Scholar]
- Mathewson KE, Gratton G, Fabiani M, Beck DM, Ro T. To see or not to see: prestimulus alpha phase predicts visual awareness. J Neurosci. 2009;29:2725–2732. doi: 10.1523/JNEUROSCI.3963-08.2009. [DOI] [PMC free article] [PubMed] [Google Scholar]
- Mathewson KE, Lleras A, Beck DM, Fabiani M, Ro T, Gratton G. Pulsed out of awareness: EEG alpha oscillations represent a pulsed-inhibition of ongoing cortical processing. Front Psychol. 2011;2:99. doi: 10.3389/fpsyg.2011.00099. [DOI] [PMC free article] [PubMed] [Google Scholar]
- Mauritz KH, Wise SP. Premotor cortex of the rhesus monkey: neuronal activity in anticipation of predictable environmental events. Exp Brain Res. 1986;61:229–244. doi: 10.1007/BF00239513. [DOI] [PubMed] [Google Scholar]
- Mehta AD, Ulbert I, Schroeder CE. Intermodal selective attention in monkeys. I: distribution and timing of effects across visual areas. Cereb Cortex. 2000a;10:343–358. doi: 10.1093/cercor/10.4.343. [DOI] [PubMed] [Google Scholar]
- Mehta AD, Ulbert I, Schroeder CE. Intermodal selective attention in monkeys. II: physiological mechanisms of modulation. Cereb Cortex. 2000b;10:359–370. doi: 10.1093/cercor/10.4.359. [DOI] [PubMed] [Google Scholar]
- Miniussi C, Wilding EL, Coull JT, Nobre AC. Orienting attention in time. Modulation of brain potentials. Brain. 1999;122:1507–1518. doi: 10.1093/brain/122.8.1507. [DOI] [PubMed] [Google Scholar]
- Mo J, Schroeder CE, Ding M. Attentional modulation of alpha oscillations in macaque inferotemporal cortex. J Neurosci. 2011;31:878–882. doi: 10.1523/JNEUROSCI.5295-10.2011. [DOI] [PMC free article] [PubMed] [Google Scholar]
- Mouraux A, Iannetti GD. Across-trial averaging of event-related EEG responses and beyond. Magn Reson Imaging. 2008;26:1041–1054. doi: 10.1016/j.mri.2008.01.011. [DOI] [PubMed] [Google Scholar]
- Nobre AC. How can temporal expectations bias perception and action? In: Nobre AC, Coull JT, editors. Attention and time. Oxford, UK: Oxford UP; 2010. pp. 371–392. [Google Scholar]
- Nobre AC, Correa A, Coull J. The hazards of time. Curr Opin Neurobiol. 2007;17:465–470. doi: 10.1016/j.conb.2007.07.006. [DOI] [PubMed] [Google Scholar]
- O'Connell RG, Dockree PM, Robertson IH, Bellgrove MA, Foxe JJ, Kelly SP. Uncovering the neural signature of lapsing attention: electrophysiological signals predict errors up to 20 s before they occur. J Neurosci. 2009;29:8604–8611. doi: 10.1523/JNEUROSCI.5967-08.2009. [DOI] [PMC free article] [PubMed] [Google Scholar]
- Osman A, Moore CM, Ulrich R. Bisecting RT with lateralized readiness potentials: precue effects of LRP onset. Acta Psychol (Amst) 1995;90:111–127. doi: 10.1016/0001-6918(95)00029-t. [DOI] [PubMed] [Google Scholar]
- Praamstra P, Pope P. Slow brain potential and oscillatory EEG manifestations of impaired temporal preparation in Parkinson's disease. J Neurophysiol. 2007;98:2848–2857. doi: 10.1152/jn.00224.2007. [DOI] [PubMed] [Google Scholar]
- Praamstra P, Kourtis D, Kwok HF, Oostenveld R. Neurophysiology of implicit timing in serial choice reaction-time performance. J Neurosci. 2006;26:5448–5455. doi: 10.1523/JNEUROSCI.0440-06.2006. [DOI] [PMC free article] [PubMed] [Google Scholar]
- Rajagovindan R, Ding M. From prestimulus alpha oscillation to visual-evoked response: an inverted-U function and its attentional modulation. J Cogn Neurosci. 2011;23:1379–1394. doi: 10.1162/jocn.2010.21478. [DOI] [PubMed] [Google Scholar]
- Riehle A, Grün S, Diesmann M, Aertsen A. Spike synchronization and rate modulation differentially involved in motor cortical function. Science. 1997;278:1950–1953. doi: 10.1126/science.278.5345.1950. [DOI] [PubMed] [Google Scholar]
- Rihs TA, Michel CM, Thut G. Mechanisms of selective inhibition in visual spatial attention are indexed by alpha-band EEG synchronization. Eur J Neurosci. 2007;25:603–610. doi: 10.1111/j.1460-9568.2007.05278.x. [DOI] [PubMed] [Google Scholar]
- Rihs TA, Michel CM, Thut G. A bias for posterior alpha-band power suppression versus enhancement during shifting versus maintenance of spatial attention. Neuroimage. 2009;44:190–199. doi: 10.1016/j.neuroimage.2008.08.022. [DOI] [PubMed] [Google Scholar]
- Rohenkohl G, Coull JT, Nobre AC. Behavioural dissociation between exogenous and endogenous temporal orienting of attention. PLoS One. 2011;6:e14620. doi: 10.1371/journal.pone.0014620. [DOI] [PMC free article] [PubMed] [Google Scholar]
- Romei V, Brodbeck V, Michel C, Amedi A, Pascual-Leone A, Thut G. Spontaneous fluctuations in posterior alpha-band EEG activity reflect variability in excitability of human visual areas. Cereb Cortex. 2008;18:2010–2018. doi: 10.1093/cercor/bhm229. [DOI] [PMC free article] [PubMed] [Google Scholar]
- Romei V, Gross J, Thut G. On the role of prestimulus alpha rhythms over occipito-parietal areas in visual input regulation: correlation or causation? J Neurosci. 2010;30:8692–8697. doi: 10.1523/JNEUROSCI.0160-10.2010. [DOI] [PMC free article] [PubMed] [Google Scholar]
- Schoffelen JM, Oostenveld R, Fries P. Neuronal coherence as a mechanism of effective corticospinal interaction. Science. 2005;308:111–113. doi: 10.1126/science.1107027. [DOI] [PubMed] [Google Scholar]
- Schroeder CE, Lakatos P. Low-frequency neuronal oscillations as instruments of sensory selection. Trends Neurosci. 2009;32:9–18. doi: 10.1016/j.tins.2008.09.012. [DOI] [PMC free article] [PubMed] [Google Scholar]
- Snyder AC, Foxe JJ. Anticipatory attentional suppression of visual features indexed by oscillatory alpha-band power increases: a high-density electrical mapping study. J Neurosci. 2010;30:4024–4032. doi: 10.1523/JNEUROSCI.5684-09.2010. [DOI] [PMC free article] [PubMed] [Google Scholar]
- Thut G, Nietzel A, Brandt SA, Pascual-Leone A. Alpha-band electroencephalographic activity over occipital cortex indexes visuospatial attention bias and predicts visual target detection. J Neurosci. 2006;26:9494–9502. doi: 10.1523/JNEUROSCI.0875-06.2006. [DOI] [PMC free article] [PubMed] [Google Scholar]
- Ulrich R, Miller J. Using the jackknife-based scoring method for measuring LRP onset effects in factorial designs. Psychophysiology. 2001;38:816–827. [PubMed] [Google Scholar]
- van Ede F, Jensen O, Maris E. Tactile expectation modulates pre-stimulus beta-band oscillations in human sensorimotor cortex. Neuroimage. 2010;51:867–876. doi: 10.1016/j.neuroimage.2010.02.053. [DOI] [PubMed] [Google Scholar]
- van Ede F, de Lange F, Jensen O, Maris E. Orienting attention to an upcoming tactile event involves a spatially and temporally specific modulation of sensorimotor alpha- and beta-band oscillations. J Neurosci. 2011;31:2016–2024. doi: 10.1523/JNEUROSCI.5630-10.2011. [DOI] [PMC free article] [PubMed] [Google Scholar]
- VanRullen R, Busch NA, Drewes J, Dubois J. Ongoing EEG phase as a trial-by-trial predictor of perceptual and attentional variability. Front Psychol. 2011;2:60. doi: 10.3389/fpsyg.2011.00060. [DOI] [PMC free article] [PubMed] [Google Scholar]
- Worden MS, Foxe JJ, Wang N, Simpson GV. Anticipatory biasing of visuospatial attention indexed by retinotopically specific alpha-band electroencephalography increases over occipital cortex. J Neurosci. 2000;20:RC63. doi: 10.1523/JNEUROSCI.20-06-j0002.2000. [DOI] [PMC free article] [PubMed] [Google Scholar]
- Wyart V, Tallon-Baudry C. Neural dissociation between visual awareness and spatial attention. J Neurosci. 2008;28:2667–2679. doi: 10.1523/JNEUROSCI.4748-07.2008. [DOI] [PMC free article] [PubMed] [Google Scholar]
- Yamagishi N, Callan DE, Anderson SJ, Kawato M. Attentional changes in pre-stimulus oscillatory activity within early visual cortex are predictive of human visual performance. Brain Res. 2008;1197:115–122. doi: 10.1016/j.brainres.2007.12.063. [DOI] [PubMed] [Google Scholar]