

Abstract
In order to address the hypothesis that seeds from ecologically and geographically diverse plants harbor characteristic epiphytic microbiota, we characterized the bacterial and fungal microbiota associated with Triticum and Brassica seed surfaces.
The total microbial complement was determined by amplification and sequencing of a fragment of chaperonin 60 (cpn60). Specific microorganisms were quantified by qPCR. Bacteria and fungi corresponding to operational taxonomic units (OTU) that were identified in the sequencing study were isolated and their interactions examined.
A total of 5477 OTU were observed from seed washes. Neither total epiphytic bacterial load nor community richness/evenness was significantly different between the seed types; 578 OTU were shared among all samples at a variety of abundances. Hierarchical clustering revealed that 203 were significantly different in abundance on Triticum seeds compared with Brassica. Microorganisms isolated from seeds showed 99–100% identity between the cpn60 sequences of the isolates and the OTU sequences from this shared microbiome. Bacterial strains identified as Pantoea agglomerans had antagonistic properties toward one of the fungal isolates (Alternaria sp.), providing a possible explanation for their reciprocal abundances on both Triticum and Brassica seeds.
cpn60 enabled the simultaneous profiling of bacterial and fungal microbiota and revealed a core seed-associated microbiota shared between diverse plant genera.
Keywords: biocontrol, core microbiome, cpn60 universal target, DNA barcode, epiphytes, seed microbiota
Introduction
The seeds of crops such as wheat (Triticum spp.) and canola (Brassica spp.) are products of agricultural enterprise and the source of the next generation of plants. Thus healthy, high-quality seeds are critically important for the stability of the world’s food supply and the economic success of farmers. Crop seeds, like other parts of the plant, are colonized by an epiphytic microbiota consisting of synergistic, commensal and potentially pathogenic microbes that play a crucial role in health and susceptibility to disease (Hashidoko, 2005; Critzer & Doyle, 2010). Because the plant-associated microbiota clearly plays a role in plant fitness (Hallmann et al., 1997), different crops might be expected to harbor distinct microbiota on their seed surfaces and the constituents of these microbial communities are likely to have functional relevance during plant growth, development and seed storage. For example, specific microorganisms such as Penicillium verrucosum and Alternaria alternata in stored crop seeds can cause spoilage, decreasing crop value, or produce mycotoxins that have a direct effect on human health (Magan & Aldred, 2007; Duarte et al., 2010; Magan et al., 2010). Conversely, commonly utilized crop rotations, such as canola-wheat, are known to have positive benefits for yields and for pathogen control (Zegada-Lizarazu & Monti, 2011; Bushong et al., 2012; Harker et al., 2012). Microorganisms that associate with each crop may influence the growth and development of the subsequent crop in the rotation. The potential impact of crop-based microbial communities on yields and on pest control demands that a comprehensive knowledge of microbiota associated with seed surfaces be elucidated.
Microorganisms – both bacteria and fungi – that associate with plants can have beneficial, neutral or harmful effects on the host. Well-known examples of beneficial plant–microbe interactions include symbioses such as nitrogen fixation by root-associated Rhizobiales (Hayat et al., 2010), as well as antagonism toward potential pathogens by plant-associated microorganisms (Braun-Kiewnick et al., 2000). It is becoming increasingly appreciated that microbes are intimately associated with plants and can influence host growth and metabolic processes. For example, various aseptically cultured Atriplex spp. were shown to have a variety of root- and leaf-associated microbes, including both bacteria and fungi, that probably originated as seed endophytes (Lucero et al., 2011). Furthermore, the epiphytic phyllosphere microbial community on Lactuca sativa consists of a core microbiota consisting of Pseudomonas, Bacillus, Massilia, Arthrobacter and Pantoea spp., and the abundance of genera such as Pantoea correlates negatively to pathogen abundance, suggesting possible antagonistic interactions between foliar microbiota and potential pathogens (Rastogi et al., 2012). An understanding of the composition and dynamics of the plant-associated microbiota, which is facilitated by modern sequencing technologies, is expected to lead to agronomic benefits including enhanced plant growth and the identification of microorganisms that inhibit the growth of potential pathogens (Tikhonovich & Provorov, 2011).
Seed-borne endophytes have been shown to be an important source of bacteria within other tissues (Hallmann et al., 1997; Lucero et al., 2011). The identification of a set of endophytic microbes among Zea spp. that are conserved across evolutionary and ecological boundaries (Johnston-Monje & Raizada, 2011) suggests that plants select microbes from the environment with beneficial properties to the host plant. By contrast, seed-associated epiphytes, microorganisms associated with the seed surface, have been relatively uncharacterized. The organisms that naturally associate with seed surfaces may be expected, like seed-associated endophytes and foliar epiphytes, to have been selected from the environment by the host for mutualistic interactions such as the inhibition of pathogen growth. If that is true, then different plant hosts might harbor a characteristic set of microbes on their seed surfaces and the microbial profile obtained from the seeds of a particular plant may be exploited as a diagnostic tool to determine the source and quality of seed stocks. We tested the hypothesis that the seed-associated epiphytic microbiota of two taxonomically diverse crop plants, Triticum spp. (wheat) and Brassica spp. (canola/mustard) are distinguishable. Furthermore, by comparing the assembled OTU sequences with those from bacteria and fungi isolated from these samples we demonstrated that OTU could be assembled de novo with 100% identity to microbes in complex samples. Finally, we examined the interactions of microorganisms that were originally identified based on microbial profiling and identified strains of Pantoea agglomerans, a numerically dominant seed epiphyte, that can inhibit the growth of potentially pathogenic and seed spoilage-associated microorganisms.
Materials and Methods
Seed sources
Crop seeds of diverse geographic origins within Canada were chosen for analysis. Seeds of Brassica (B. juncea L. Czern., B. rapa L., B. napus L.) and Triticum (T. aestivum L., T. turgidum L. subsp. durum (Desf.) Husn.) were used for the study. In total, five replicates of seed-surface microbiota were analyzed for Brassica and six replicates for Triticum were sequenced (Table1). The seeds were harvested in the summer of 2008 and the experiment was carried out in 2009. The seeds were stored separately in plastic bags at room temperature for c. 12 months before DNA extraction.
Table 1.
Description of samples
| Sample name | Sample source | Sample description1 | Geographic origin2 |
|---|---|---|---|
| Wheat-1 | T. turgidum L. subsp. durum (Desf.) Husn. | CWAD, grade 2 | Western Canada |
| Wheat-2 | T. turgidum L. subsp. durum (Desf.) Husn. | CWAD, grade 3 | Western Canada |
| Wheat-3 | Triticum aestivum L. | CESRW, grade 2 | Eastern Canada |
| Wheat-4 | Triticum aestivum L. | CWRS, grade 1 | Western Canada |
| Wheat-5 | Triticum aestivum L. | CWRS, grade 2 | Western Canada |
| Wheat-6 | Triticum aestivum L. | CWRS, grade 3 | Western Canada |
| Brassica-1 | Brassica juncea (L.) Czern. | Brown mustard, grade 1 | Western Canada |
| Brassica-2 | Brassica napus L. | Canola B | Western Canada |
| Brassica-3 | Brassica napus L. | Canola A | Western Canada |
| Brassica-4 | Brassica juncea (L.) Czern. | Oriental mustard, grade 1 | Western Canada |
| Brassica-5 | Brassica rapa L. | Brown mustard | Western Canada |
CWRS, Canada Western Red Spring wheat; CESRW, Canada Eastern Soft Red Winter wheat; CWAD, Canada Western Amber Durum wheat.
Seeds were sourced from different geographic locations in Eastern Canada (Ontario or Quebec) or Western Canada (Manitoba, Saskatchewan, Alberta, or British Columbia).
DNA extraction from seed-associated epiphytic microbiota
A 10 g sample of each seed lot was soaked in a solution of 45 ml buffered peptone water (10 g peptone, 5 g NaCl, 3.5 g Na2HPO4, 1.5 g KH2PO4 l−1; Kim et al., 2006) containing 0.05% Triton X-100 (Sigma) in a 250 ml Erlenmeyer flask at room temperature with shaking (150 rpm) for 1 h. The liquid fractions were centrifuged at 4000 g for 15 min and the supernatant discarded. Pellets were resuspended in 200 μl of TE buffer and subjected to DNA extraction using the previously described bead-beating protocol (Hill et al., 2005). DNA was quantified using a Quant-IT DNA quantification kit and Qubit fluorometer (Invitrogen).
Quantification of bacterial 16S rRNA-encoding genes
Due to higher sequence conservation of the 16S rRNA primer landing sites, we determined the total bacterial load in each seed lot by quantitative PCR of bacterial 16S rRNA-encoding genes using the universal primers SRV3-1 and SRV3-2 (Lee et al., 1996). Reactions were prepared using SsoFast EvaGreen supermix (Bio-Rad) with 400 nM of each primer in a final volume of 20 μl. Amplification conditions were: 95°C for 3 min (1 ×); followed by 30 cycles of 95°C for 15 s, 62°C for 15 s, and 72°C for 15 s. Data collection was set at the extension step. Results were expressed as 16S rRNA gene copies g−1 seeds by considering the weight of seeds used for extraction and the template volume used for qPCR.
cpn60 universal target (UT) amplicon generation and sequencing
Amplicons were generated from each sample using multiplexing ID (MID)-adapted universal primers as described previously (Schellenberg et al., 2009, 2011). Purified, concentrated amplicon from all seed samples was pooled on an equimolar basis before emPCR adaptor ligation and pyrosequencing using Titanium chemistry (Roche/454).
Assembly of operational taxonomic units
The de-multiplexing of pyrosequencing data was done as described previously (Chaban et al., 2012). mPUMA (Links et al., 2013) was used with default parameters to process de-multiplexed data using de novo assembly (via gsAssembler) for OTU formation and mapping of reads via bowtie2 (Langmead & Salzberg, 2012) for determination of OTU abundance.
α-diversity measures
In order to avoid biases introduced by unequal sampling effort (Gihring et al., 2012), OTU abundance data for each sample was sub-sampled at random to the size of the smallest library (3606 reads). Calculation of community parameters including Chao1 richness, Simpson’s index D, the Shannon–Weiner index (H′) and Good’s coverage estimator was performed using mothur (Schloss et al., 2009).
Analysis of OTU abundance across crops
Before analysis in R (http://www.r-project.org) the OTU abundances were scaled to a total library size of 107 to approximate the community size as measured by 16S rRNA copies g−1 for these samples (Fig.1). Clustering and statistical tests based on OTU abundance were performed in R (v2.15.1) on a Linux server (CentOS 5.8). Hierarchical clustering was performed using an average linkage method based on the Euclidean distance of both OTU and samples. OTU with significantly differential abundances were identified using an unpaired Mann–Whitney test followed by a Benjamini–Hochberg correction for multiple hypothesis testing at an alpha = 5% level of significance.
Figure 1.
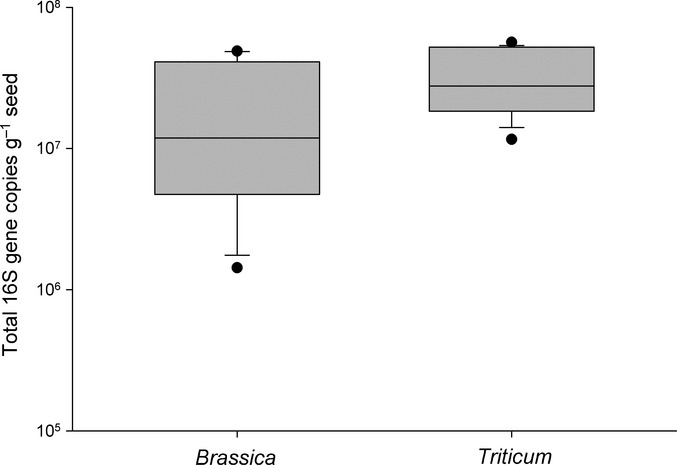
Total bacterial 16S rRNA gene copies g−1 seed as measured by quantitative PCR for Brassica and Triticum seed washes. The lower and upper edges of each box correspond to the 25th and 75th percentiles, while the whiskers correspond to the 10th and 90th percentiles. Dots indicate outliers. The median value is indicated by a horizontal line.
Quantitative PCR targeting specific microbes
Primers designed to target specific OTU were designed using sigoligo (Zahariev et al., 2009), Beacon Designer 7 (Premier Biosoft, Palo Alto, CA, USA), and primer3 (Rozen & Skaletsky, 2000). Primers targeting bacterial OTU00845 were 5′-CGG TAT TGA CCA GGC TGT TAT C-3′ and 5′-AGT TCA ATC GCA CCG GTT T-3′ (271 bp product). Amplification conditions used were 95°C for 3 min followed by 40 cycles of 95°C for 15 s, 60°C for 15 s, and 72°C for 30 s. Primers targeting fungal OTU03024 were 5′-GCT TGA GGT TAC CGA AGG-3′ and 5′-GGA GAG GAG GAT CAG AGG-3′ (112 bp product). Amplification conditions were 95°C, 3 min followed by 40 cycles of 95°C, 15 s, 63°C, 15 s, 72°C, 30 s. For both assays, data collection was at the extension step (72°C). Quantitative PCR with SsoFast Eva Green Supermix (Bio-Rad) and primer concentrations of 400 nM each was used to determine the apparent genome number of each organism in each seed extract as described (Dumonceaux et al., 2006).
Isolation and identification of microbes
In order to isolate fungi from Brassica or Triticum seeds, a 4 g sample of seeds was incubated in 50 ml of Taylor minimal medium (Taylor, 1993) and on malt extract broth (Difco, Houston, TX, USA), each containing antibiotics: tetracycline (100 μg ml−1); streptomycin (100 μg ml−1); and penicillin (1000 units ml−1). Seed samples were incubated with shaking (150 rpm) at room temperature (20–23°C) for 4 d, then 100 μl of serial dilutions of the broth were plated on Taylor minimal medium and on malt extract agar plates with antibiotics until colonies appeared. Some samples showed outgrowth in broth culture of large mycelial agglomerates; these were blended in a sterile Eberbach blender cup for 10 s before dilution and plating. A similar strategy was used to isolate bacteria from Triticum seeds, except that 50 ml of antibiotic-free trypticase soy broth (Difco) was used as a culture medium and the cultures were incubated overnight at room temperature before dilution and plating on trypticase soy agar plates. DNA was extracted from each fungal strain using a miniprep method (Wendland et al., 1996) and from each bacterial strain using a Wizard genomic DNA extraction kit (Promega). The cpn60 UT sequences of bacterial isolates were determined by direct sequencing of amplicons using M13-adapted universal primers H729/H730 as described previously (Goh et al., 2000). Sequences of the nuclear ribosomal internal transcribed spacer (ITS) were determined for each fungal isolate using PCR primers and amplification conditions as described (Schoch et al., 2012).
Phylogenetic analysis
Full-length assembled OTU sequences were aligned with the cpn60 sequences determined from the isolates as described above and with selected reference strains from cpnDB (http://www.cpndb.ca) using ClustalW (Thompson et al., 1994). Phylogenetic trees were constructed using the neighbor-joining method (Saitou & Nei, 1987) with bootstrapping of 500 replicates. Distances were calculated using the maximum composite likelihood method. Alignments were performed and trees were calculated using MEGA v5.05 (Tamura et al., 2007).
Biological interaction assays
Triticum seeds (Canada Western Red Spring wheat, grade 3) were sterilized by submerging 30 g of seeds within a nylon bag in 250 ml of 95% ethanol for 20 s, followed by 250 ml of 20% commercial bleach for 15 min with shaking. Seeds were then washed in 7 × 250 ml of sterile water (3 min for the first three washes and 10 min for the final four washes). Sterilized seeds were dried overnight in a sterile Petri dish. Seeds were re-colonized with the desired strains by diluting overnight cultures of each strain 1 : 100 in 5 ml of sterile peptone water, then adding c. 50 seeds to each dilution. This inoculum corresponded to c. 1.6 × 10⁷ CFU g−1 seeds. Control seeds were added to sterile peptone water without bacterial culture. The seeds were incubated at room temperature for 15 min with gentle agitation, and then placed in the center of plates containing Czapek-Dox agar medium (containing 30 g sucrose, 2 g sodium nitrate, 1 g dipotassium phosphate, 0.5 g each of MgSO4 and KCl, and 0.01 g of FeSO4 l−1). A 5-mm punchout from the edge of a colony of Leptosphaeria maculans strain WA51 (Yu et al., 2005) or of fungal isolate 15 was placed within 3 cm of the seeds and the plates were incubated at 25°C for 1 wk. Inhibition of fungal growth was scored using previously described methods (Chakraborty et al., 1994).
Results
Total 16S rRNA-encoding gene counts
The total 16S rRNA gene copy number associated with each Triticum seed type varied over a range of c. 4-fold, with Wheat-4 (CWRS grade 1) being the lowest and Wheat-2 (CWAD grade 3) the highest (Fig.1). The range was somewhat wider (c. 9-fold) within the Brassica seeds, with Brassica-5 (B. rapa) being the lowest and Brassica-4 (oriental mustard) the highest. Although the Triticum samples tended to have higher 16S rRNA gene counts than the Brassica samples, no statistically significant differences were detected at a significance level of 0.01 (P = 0.018, Mann–Whitney rank sum test).
Pyrosequencing of cpn60 UT amplicons
A total of 408 658 reads was generated from the 11 amplicon libraries. The median library size was 34 594 with a range of 3606 reads (B. rapa) to 96 834 reads (CWRS grade 3). These reads were assembled into 5477 distinct OTU. Rarefaction plots as well as Family-level taxonomic profiles of the Brassica and Triticum samples are provided in Supporting Information Notes S1 and Fig. S1.
Microbial community diversity
Community richness (Chao1, expressed as the projected total number of OTU in each sample), evenness (Simpson’s index, D) and the Shannon index H′ (Hill et al., 2003) was calculated for each sample. No correlation was observed between community richness or evenness, and total bacterial 16S rRNA gene copy numbers (Spearman rank correlation; not shown). Comparing the microbial communities associated with Triticum (n = 6) and Brassica (n = 5) revealed no significant differences in the diversity parameters by Mann–Whitney test and one-way ANOVA (Fig. S2).
The shared epiphytic microbiota of Triticum and Brassica seeds
Microbial profiles determined for Triticum and Brassica samples were compared, resulting in the identification of a core microbiome for each host plant genus. All Triticum (n = 6) samples had 262 OTU in common while all Brassica (n = 5) samples had 215 OTU in common. In order to identify the microbiota shared between seeds of Brassica and Triticum we established a sample prevalence of at least 7/11 as a lower limit for an OTU to be considered shared. This would ensure that any OTU identified as shared was observed in at least one sample of each host genus. There were 578 OTU identified with a sample prevalence of 7/11 or higher. Additionally we determined whether there were any OTU found in all samples. Across host plant species 64 OTU were detected in every sample. We examined the effect of sample size (per host plant genus) on the number of OTU identified as shared. The number of shared OTU was calculated for each combination of Brassica and Triticum samples (from 1 to 5 samples for each host plant genus). The number of shared OTU diminished as sample size increased in a nonlinear fashion, suggesting an asymptote around 60 OTU (Fig. S3). These results are consistent with the identification of a shared microbiome at the sample size used in this study and suggest that larger sample numbers would not substantially decrease the size of the shared microbiome.
Sequences for these 64 shared OTU were similar but not identical (88–99% identity) to records from cpnDB that included Pantoea agglomerans/Erwinia herbicola (99%), Massilia timonae (93%), Pantoea stewartii (93%), Porphyrobacter sanguineus (88%), Pseudomonas fluorescens (97%), Pseudomonas syringae (95%), Pyrenophora tritici-repentis (93%), Sphingobium japonicum (90%), Sphingomonas wittichii (90%), Telluria mixta (93%), Xanthomonas axonopodis (94%), Xanthomonas fuscans (95%) and some novel sequences.
Differential OTU abundances
Hierarchical clustering of the microbial profiles showed that the Triticum- and Brassica-derived samples could be separated on the basis of the 578 shared OTU (Fig.2). A Mann–Whitney test identified 203 of these OTU that were significantly differentially abundant between Triticum and Brassica, including all 64 OTU with a sample prevalence of 11/11 (Table S1).
Figure 2.

Hierarchical clustering of samples and operational taxonomic units (OTU) from crop seeds. These 578 OTU were found in at least 7/11 samples from the two seed types. Libraries are represented by columns while OTU are represented by rows. The abundances of all OTU in each column (sample) sum to a total scaled library size of 107 and are presented as a heat map (blue, less abundant to red, more abundant). Specific OTU corresponding to cultured isolates are identified along with their corresponding read abundances in each library and cpnDB (http://www.cpndb.ca) nearest neighbor (with percentage identities indicated in parentheses). Asterisks indicate statistically significantly different abundances measured by sequencing read counts (unpaired Mann–Whitney test with Benjamini–Hochberg correction for multiple hypothesis testing at α = 5% level of significance).
Approximately 40% of the significantly differentially abundant OTU (79/203, including OTU00845) were closely related (96–99% nucleotide identity) to P. agglomerans. Triticum seeds were found to have significantly more sequences from these Pantoea-like OTU than Brassica seeds (Table S1). Fungal OTU were also identified as significantly different in abundance between Brassica and Triticum samples with 12 OTU (including OTU03024) more abundant on Brassica seeds as compared with the Triticum seeds. While the cpnDB nearest neighbor for these OTU was Pyrenophora tritici-repentis (c. 94% identity), these fungal OTU were more similar (up to 99% identity) to a truncated cpn60 UT sequence from Alternaria alternata (GenBank GQ871196).
Quantitative PCR assays targeting OTU00845 and OTU03024 validated the sequence read abundance patterns seen in the microbial profiles of Triticum and Brassica (Fig.3). Consistent with the sequencing read counts, the P. agglomerans OTU were significantly more abundant on Triticum seeds than Brassica, while the Alternaria-like OTU03024 exhibited an inverse pattern, being more abundant on Brassica seeds (Fig.3).
Figure 3.
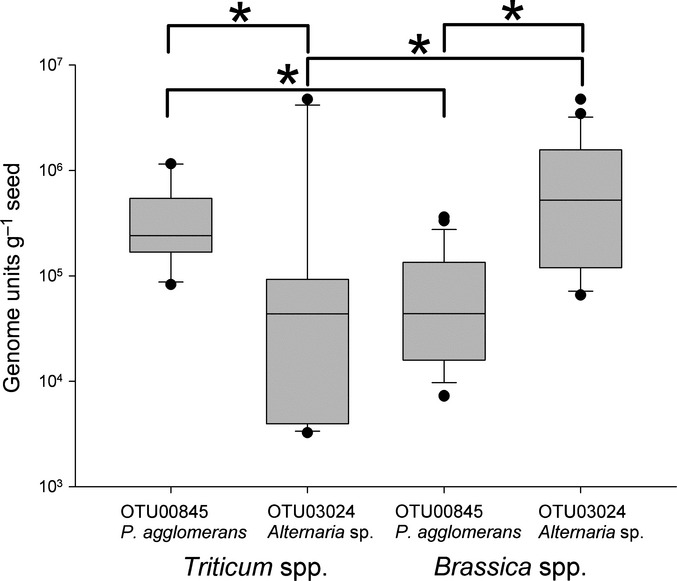
Quantification by qPCR of OTU00845 (Pantoea agglomerans) and OTU03024 (Alternaria sp.) on seeds of Triticum (n = 12) and Brassica (n = 24). qPCR results are from at least two biological replicates (DNA extractions) and two technical replicates per sample. The lower and upper edges of each box correspond to the 25th and 75th percentiles, while the whiskers correspond to the 10th and 90th percentiles. Dots indicate outliers. The median value is indicated by a horizontal line. Significant differences in the median values measured by the Mann–Whitney rank-sum test (P < 0.01) are indicated (*).
Isolation of bacteria and fungi from Triticum and Brassica seeds
In order to assess potential interactions between members of the shared microbiota, we undertook efforts to culture bacteria corresponding to Pantoea-like OTU00845 and fungi corresponding to Alternaria-like OTU03024. These specific OTU were targeted due to their reciprocal patterns of abundance in both the microbial profiling and qPCR results (i.e. on seeds where Pantoea-like OTU were abundant, Alternaria-like OTU were lower and vice versa; Fig.3 and Table S1). Multiple bacterial colony morphologies were observed when Triticum seeds were incubated in trypticase soy broth. Nine yellow colonies were picked from these plates, and these yielded a band with the P. agglomerans cpn60 UT-specific primer set and were sub-cultured to purity. Microscopic analysis revealed that the organisms were Gram-negative rods and they formed yellow colonies on the trypticase soy agar plates, consistent with previous reports for Pantoea agglomerans (Lee & Liu, 1991). Determination of the cpn60 UT sequences for all nine isolates revealed > 99% sequence identity with P. agglomerans JCM7000 and that eight of these were 100% identical with each other, and OTU00845. The isolate sequences clustered together with the OTU sequences and all were distinct from the P. agglomerans reference strain as well as from other Erwinia and Pantoea species (Fig.4a).
Figure 4.
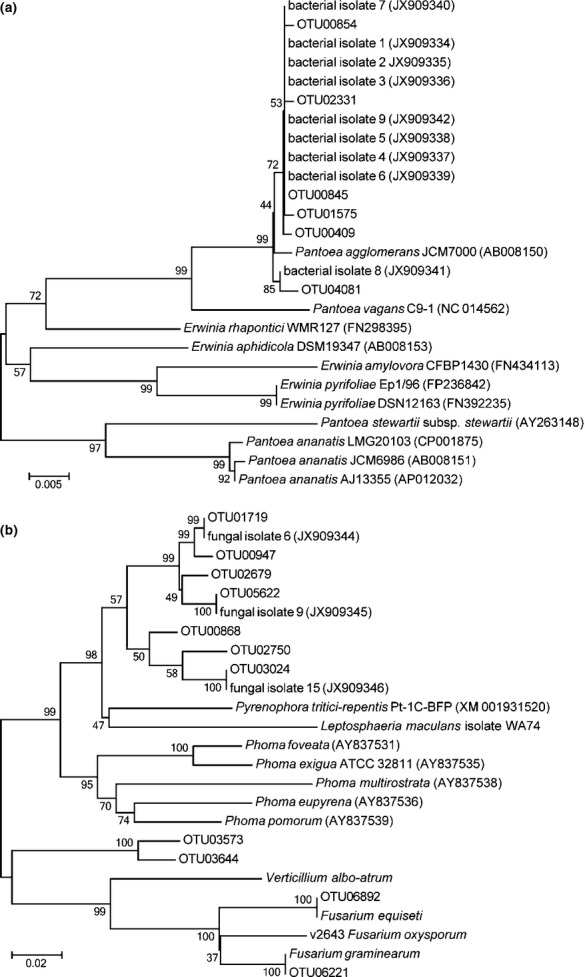
Phylogenetic analysis of the cpn60 UT sequences of selected operational taxonomic units (OTU) assembled from pyrosequencing data along with reference strains from cpnDB and isolates from Triticum and Brassica seeds. In both (a) and (b), the robustness of each node is indicated by the percentage of 500 trees in which the associated taxa cluster together and is presented next to the branches (Tamura et al., 2004). The scale bar represents units of base substitutions per site. Sequences corresponding to the cpn60 UT of reference strains were retrieved from cpnDB with the nucleotide accession number (http://ncbi.nlm.nih.gov) for each strain indicated in parentheses. (a) Pantoea agglomerans-related OTU, reference strains, and isolate sequences. (b) Fungal isolates and OTU along with reference strain sequences from cpnDB.
Fungi were also isolated from Brassica and Triticum seeds, with a wide range of colony morphologies observed, including yeasts, molds and filamentous phenotypes. Fungal isolates 6, 9 and 15 had Alternaria-like colony morphology and their cpn60 UT sequences were identical to OTU01719, OTU05622 and OTU03024, respectively (Fig.4b). The cpn60 UT sequence of a fourth isolate with similar morphology (fungal isolate 5) was 1 bp different from nonsignificant OTU02724 in a short homopolymer (not shown). The cpn60 UT sequences of fungal isolates 5, 6 and 9 (and of OTU 02724, 05622 and 01719) shared 96–99% identity over 483 bp with a truncated cpn60 UT sequence from Alternaria alternata (GenBank: GQ871196). The cpn60 UT sequence of fungal isolate 15 was distinct from the other isolates (92% identity) and identical to OTU03024. The nuclear ribosomal internal transcribed spacer (ITS) region is a recently proposed DNA barcode marker for Fungi (Schoch et al., 2012), and we examined the ITS sequences of the isolates to place them in the context of known fungal strains. This analysis suggested that isolates 5, 6 and 9 were most closely related to Alternaria alternata while isolate 15 clustered with Alternaria infectoria and Alternaria triticina (Fig. S4). These observations were consistent with the morphological features of the fungal conidia, which were also typical of Alternaria spp. (data not shown).
Interactions between bacterial and fungal isolates
The nine P. agglomerans isolates from Triticum seeds showed a spectrum of growth suppression against fungal isolate 15 (Alternaria sp.; identical to OTU03024) (Fig.5) as well as the canola blackleg pathogen Leptosphaeria maculans (Fig. S5). Pantoea agglomerans isolate 4 (identical to OTU00845) showed the strongest inhibition while other strains (isolates 3, 6 and 8) as well as unsterilized and sterilized seeds showed no inhibition on both wheat and canola (Table2; Figs5, S5). Some of the strains resulted in growth cessation of L. maculans at the point of contact, but fungal growth continued away from the bacterial colony (Table2; Fig. S5). In general the inhibition of L. maculans growth was stronger than of fungal isolate 15 (Alternaria sp.) by several of the isolates, but isolate 4 (identical to OTU00845) was quite effective against both fungi (Table2; Figs5, S5). Fungal isolate 15 produced a dark pigment upon interaction with bacterial isolate 4 and limited growth continued only in the direction opposite the bacterial challenge (Fig.5). Colonization of wheat and canola seeds with bacterial isolate 4 protected both seed types from overgrowth of both the Alternaria-like strain (Fig.5) and L. maculans (Fig. S5) in these assays.
Figure 5.
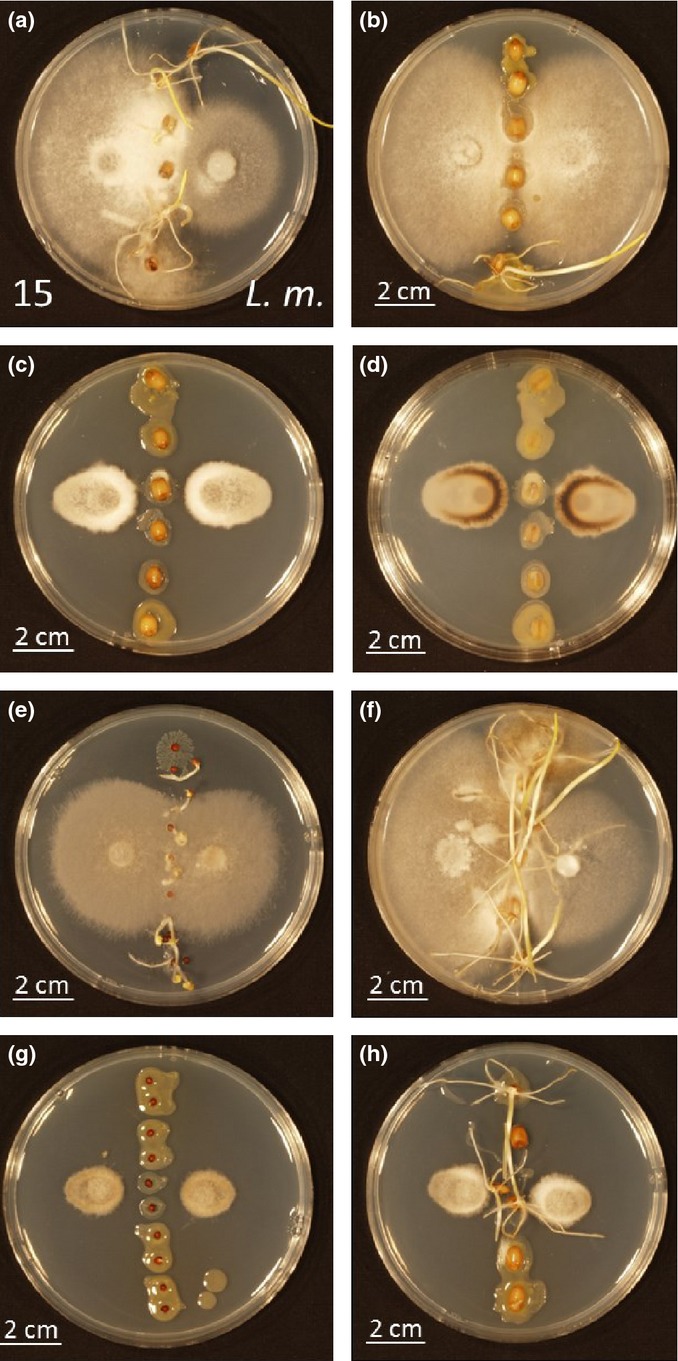
Interactions between selected bacterial isolates and fungal isolate 15. In some instances (a, b, e, f, h), the seeds have begun to germinate, producing shoots on the plates. (a) Sterilized wheat seeds not re-colonized with bacteria. Fungal isolate 15 is inoculated on the left while Leptosphaeria maculans (L.m.) is on the right. In all of the remaining panels, fungal isolate 15 is inoculated on the left and right sides of the seeds. (b) Sterilized wheat seeds colonized with bacterial isolate 1 (homogenous). (c) Same as (b) but with bacterial isolate 4 (aversion) – top view. (d) Same as (c) – bottom view. (e) Nonsterilized canola seeds. (f) Nonsterilized wheat seeds. (g) Nonsterilized canola seeds colonized with bacterial isolate 4. (h) Nonsterilized wheat seeds colonized with bacterial isolate 4.
Table 2.
Interactions between bacterial isolates and Leptosphaeria maculans or fungal isolate 15
| Bacterial isolate | Colony diameter increase per day, (mm) | Interaction | ||
|---|---|---|---|---|
| L. maculans | Fungal isolate 15 | L. maculans | Fungal isolate 15 | |
| Isolate 1 | 4.87 ± 0.47 | 6.84 ± 1.85 | Growth cessation | Homogenous |
| Isolate 2 | 4.31 ± 0.12 | 6.63 ± 1.78 | Growth cessation | Homogenous |
| Isolate 3 | 3.83 ± 0.35 | 6.65 ± 2.06 | Homogenous | Homogenous |
| Isolate 4 | 0.24 ± 0.38 | 1.20 ± 0.36 | Aversion | Aversion |
| Isolate 5 | 4.69 ± 0.79 | 6.74 ± 1.88 | Growth cessation | Homogenous |
| Isolate 6 | 4.64 ± 0.43 | 6.63 ± 2.18 | Homogenous | Homogenous |
| Isolate 7 | 4.76 ± 0.70 | 5.63 ± 1.21 | Growth cessation | Homogenous |
| Isolate 8 | 4.58 ± 0.50 | 7.28 ± 1.92 | Homogenous | Homogenous |
| Isolate 9 | 4.32 ± 0.49 | 6.84 ± 1.41 | Growth cessation | Homogenous |
| Sterile seed | 4.90 ± 0.87 | 6.81 ± 1.95 | Homogenous | Homogenous |
| Nonsterile seed | 5.08 ± 0.48 | 7.42 ± 2.13 | Homogenous | Homogenous |
Colony diameter measurements are the mean of 4 or 6 measurements ± SD.
Interactions were scored according to Chakraborty et al. (1994).
Discussion
The microbial complement that is naturally associated with multicellular organisms plays an important role in host health and disease. In plants, the importance of the epiphytic microbiota associated with different plant surfaces is beginning to be appreciated (Rastogi et al., 2012), but few studies have examined the composition of the seed-associated epiphytic microbiome. A comprehensive analysis of the microbial community that colonizes seeds requires a method that can detect and differentiate a wide variety of microorganisms in a single sample, which can be accomplished by taxonomic profiling using molecular markers. Taxonomic profiling typically exploits the 16S rRNA-encoding gene, which is a very useful phylogenetic marker due to its universality and ability to discriminate closely related organisms (Schloss et al., 2011). Indeed, the depth and breadth of the database associated with 16S rRNA sequences (RDP), as well as the sophisticated tools that have been developed for characterizing microbial communities profiled with this taxonomic marker (Schloss & Handelsman, 2008), have led to its widespread use for gene-centered metagenomic studies of bacterial communities. Despite its advantages, known limitations such as its variable copy number, comparatively low sequence divergence among closely related taxa, and lack of consistency in the domains examined across different studies can limit the utility of the information provided by 16S rRNA sequence analysis. An alternative molecular taxonomic marker, the cpn60 UT, possesses all of the necessary features of a marker for phylogenetic analysis of microbial communities. This protein-encoding gene is present in nearly all organisms including prokaryotes (with the exception of certain Mollicutes) and eukaryotes where it functions as a molecular chaperone assisting in the formation and maintenance of protein structures (Hemmingsen et al., 1988). Moreover, the sequence of the cpn60 UT is accessible with a set of PCR primers (Hill et al., 2006) that can simultaneously amplify the region from both bacteria and fungi; in this sense cpn60 offers a fundamental advantage over the 16S rRNA-encoding gene. Furthermore, cpn60 UT sequence identities are robust predictors of genome-scale sequence identities (Verbeke et al., 2011), while 16S rRNA sequences are poor predictors (Zeigler, 2003). Many studies have demonstrated the ability of cpn60 UT sequences to differentiate closely related organisms (Goh et al., 2000; Vermette et al., 2009), and cpn60 has been shown to be a preferred DNA barcode for bacteria (Links et al., 2012). The uniform length of the cpn60 UT (nearly always ± 1 codon of 555 bp; Hill et al., 2004) makes sequence alignments trivial using classical methods. Known disadvantages of using the cpn60 UT include the primer degeneracy and the necessity to amplify targets with a cocktail of primers at a range of annealing temperatures to profile all community members (Hill et al., 2006). Furthermore, the RDP has an enormous representation of divergent taxa from a wide array of environments compared with the analogous chaperonin database, cpnDB. Nevertheless, the cpn60 UT offers a viable complementary tool to 16S rRNA-encoding sequences for bacterial community profiling with specific advantages and disadvantages that can be exploited for various experiments.
In this work, we used the cpn60 UT to describe similarities and differences in the microbiota associated with Brassica and Triticum seed surfaces and to determine whether de novo assembly of OTU (Links et al., 2013) provides accurate molecular barcodes for these microbial communities. In 13 separate cases, including both bacteria and fungi, the assembled OTU sequences were identical (n = 11) or nearly identical (99%; n = 2) to those obtained from isolates. This demonstrates that de novo assembly of OTU yields biologically relevant sequence barcodes that can be used for specific molecular diagnostic assays to detect and quantify microorganisms using established techniques (Dumonceaux et al., 2006, 2009). This is a particularly significant advantage in cases where an OTU sequence is assembled with little similarity to available reference sequences.
Examination of the microbial communities associated with seeds of these diverse plant species revealed a total epiphytic microbial load of c. 106–108 bacterial genomes g−1 seeds. Because the analysis of endophytic communities requires harsh treatment such as trituration or sonication of the plant material (Hallmann et al., 1997; Lundberg et al., 2012), the microbial communities we analyzed by gently washing the seeds likely represents predominantly the seed-associated epiphytes. While the epiphytic bacterial load we observed is within the range of what is observed by total aerobic plate counts on other crops such as bean and pea sprouts (Deb & Joshi, 2007), there is no published baseline data on total epiphytic microbial load of Triticum and Brassica crop seeds. We have observed mean aerobic plate counts of c. > 106 CFU g−1 for Triticum and 105–106 for Brassica (R. Clear & T. Demeke, unpublished), a trend that is in line with our observations reported herein. An endophytic bacterial load in this same range has been reported for B. napus seeds (Granér et al., 2003). For some related crops, such as buckwheat, customers may set limits on total aerobic plate counts that are considerably lower (e.g. 5.5 log10 CFU g−1 seeds) than we observed for Triticum and Brassica (Dhillon et al., 2012), and lower total microbial loads are generally seen as desirable (Olaimat & Holley, 2012). The molecular methods used to estimate bacterial genomes g−1 seeds are unable to distinguish between viable and nonviable microbes, so estimates of total bacterial load by aerobic plate counts may be considerably lower than is determined using molecular methods. Nevertheless, our results establish a baseline epiphytic microbial load for food-grade seeds of Triticum and Brassica.
An overall total of 5477 OTU was associated with all Brassica and Triticum samples. We acknowledge that we may not have sampled sufficient numbers of representatives of each of these two genera to make definitive genus-based conclusions, and other experimental designs, such as the inclusion of more species of each genus and the inclusion of other genera may be required to fully elucidate the compositions of the Brassica and Triticum seed-associated microbiota. Nevertheless, our results establish a baseline for these crop plants and identify a core microbiota for all Brassica samples (215 OTU) as well as all Triticum samples (262 OTU). We also identified a shared microbiome among these seeds from distinct host plant genera harvested from a range of geographic locales, separated by thousands of kilometers. The existence of a shared microbiome conserved across plant genera suggests that the seed-associated microbiome is not a casually associated surface contamination but rather a selected, host-specific community, intimately associated with the host, and with potentially profound effects on seed health. These observations are consistent with previous studies of the seed-associated endophytic bacteria within Zea spp. (corn), wherein a microbiota was identified that is conserved in various teosinte progenitor species grown in an array of geographical locations (Johnston-Monje & Raizada, 2011). Despite these commonalities, the Triticum and Brassica seed microbiota could be distinguished based on the relative abundances of shared OTU (Fig.2).
Studies of Zea seed endophytes revealed a preponderance of Gammaproteobacteria including Enterobacter, Pantoea and Pseudomonas spp. (Johnston-Monje & Raizada, 2011). Similarly, Weiss et al. examined the microbiota associated with alfalfa, radish and bean sprouts and found the same genera represented, along with Lactobacillus (Weiss et al., 2007). The majority of bacterial taxa that we observed in the Brassica–Triticum shared microbiome included OTU that were closely related to these genera (Table S1). Many of the microorganisms we identified on the seed surface are also found in soil, suggesting a possible relationship between soil microbiota and seed-borne microorganisms. This is consistent with the fact that Triticum and Brassica seeds are sown into soils, commonly in rotation with one another. Airborne microbes are another possible source of seed-associated epiphytes. The seed microbiome included a relatively large proportion of OTU that were closely related (95–99% sequence identity) to Pantoea agglomerans, including 78 that were significantly differentially abundant on Triticum compared with Brassica seeds. Among the fungal OTU were several with similarity to yeasts and Ascomycetes, including Fusarium. While certain species of Fusarium are wheat pathogens, no sequences identical to known pathogens were detected on these seeds; however, given the ability for the seeds to be associated with microbes closely related to pathogens there is a clear need to monitor seed health. In addition, 18 OTU were identified that clustered with microorganisms such as Pyrenophora, Alternaria and Leptosphaeria, of which there are related pathogenic species that can cause grain spoilage. While none of the seeds in this study displayed any visual indication of microbial contamination/colonization, these findings demonstrate that the seed microbiome is crucial as it may harbor both beneficial and potentially pathogenic organisms.
Our data also indicate that observations of OTU abundance patterns can lead to the recognition of interactions between microbes with significant implications for the host. Relatively high levels of Pantoea-like OTU and significantly lower levels of Alternaria-like OTU were detected on Triticum seeds, while this relationship was reversed on Brassica seeds (Figs3). The reciprocal abundances of P. agglomerans and Alternaria sequences on Triticum and Brassica seeds, validated by quantitative PCR, suggested a potential antagonistic relationship between these microbes. It is well known that P. agglomerans can be antagonistic to L. maculans and other pathogens (Kempf & Wolf, 1989; Chakraborty et al., 1994; Kearns & Hale, 1996; Bryk et al., 1998; Braun-Kiewnick et al., 2000), but inhibition of the growth of Alternaria spp. by P. agglomerans has not been described. The fact that we identified this organism within the epiphytic microbiota of Triticum and Brassica seeds suggests that organisms with pathogen-protective effects naturally associate with seeds. By contrast, Alternaria spp., distinct from those detected on the seeds within this study, can cause grain safety concerns in storage due to the production of mycotoxins by specific species (Greco et al., 2012). These observations suggest that the P. agglomerans strain we identified in this study has potential as a biocontrol agent, and if applied to seeds may act to protect them from storage-associated spoilage or colonization with pathogenic microorganisms.
We have identified a remarkably conserved epiphytic microbiome on the seeds of geographically and ecologically diverse samples of two important crops. Reproducible differences in the abundances of constituents of this core microbiota were used to identify patterns that were associated with each crop type. Furthermore, this work has shown that differences in OTU abundance within and between microbiomes can be valuable clues and indicators of biological interactions among microorganisms. Finally, we demonstrated a method for simultaneous profiling of the bacteria and fungi within the epiphytic microbiota of crop seeds. These results provide a system for understanding the microorganisms that are associated with seeds, and highlight the need for a thorough understanding of these microbial communities and their importance to production and storage of healthy, high quality seeds.
Acknowledgments
We thank Russell Hynes for help with the biocontrol assays, and Teenus Paramel Jayaprakash for assistance with photography of the bioassay results. This work was funded by the genomics program of Agriculture and Agri-Food Canada through the Genomics Research and Development Initiative (GRDI).
Supporting Information
Please note: Wiley Blackwell are not responsible for the content or functionality of any supporting information supplied by the authors. Any queries (other than missing material) should be directed to the New Phytologist Central Office.
Fig. S1 Family-level taxonomic profile of Triticum and Brassica samples.
Fig. S2 Community statistics for Triticum and Brassica seed samples.
Fig. S3 Determination of the Triticum/Brassica seed-associated shared OTU with increasing paired sample size.
Fig. S4 Phylogenetic analysis of ITS sequences of fungal isolates compared with reference sequences.
Fig. S5 Interactions of selected bacterial isolates with the fungal pathogen Leptosphaeria maculans.
Notes S1 Rarefaction plots.
Table S1 List of OTU shared between Triticum and Brassica seed washes
References
- Braun-Kiewnick A, Jacobsen BJ, Sands DC. Biological control of Pseudomonas syringae pv. syringae, the causal agent of basal kernel blight of barley, by antagonistic Pantoea agglomerans. Phytopathology. 2000;90:368–375. doi: 10.1094/PHYTO.2000.90.4.368. [DOI] [PubMed] [Google Scholar]
- Bryk H, Dyki B, Sobiczewski P. Antagonistic effect of Erwinia herbicola on in vitro spore germination and germ tube elongation of Botrytis cinerea and Penicillium expansum. BioControl. 1998;43:97–106. [Google Scholar]
- Bushong JA, Griffith AP, Peeper TF, Epplin FM. Continuous winter wheat versus a winter canola-winter wheat rotation. Agronomy Journal. 2012;104:324–330. [Google Scholar]
- Chaban B, Links M, Hill J. A molecular enrichment strategy based on cpn60 for detection of epsilon-Proteobacteria in the dog fecal microbiome. Microbial Ecology. 2012;63:348–357. doi: 10.1007/s00248-011-9931-7. [DOI] [PubMed] [Google Scholar]
- Chakraborty BN, Chakraborty U, Basu K. Antagonism of Erwinia herbicola towards Leptosphaeria maculans causing blackleg disease of Brassica napus. Letters in Applied Microbiology. 1994;18:74–76. doi: 10.1111/j.1472-765X.1994.tb00807.x. [DOI] [PubMed] [Google Scholar]
- Critzer FJ, Doyle MP. Microbial ecology of foodborne pathogens associated with produce. Current Opinion in Biotechnology. 2010;21:125–130. doi: 10.1016/j.copbio.2010.01.006. [DOI] [PubMed] [Google Scholar]
- Deb MP, Joshi PA. Microbiological analysis of sprouts and effect of spices on microbial load. Journal of Food Science and Technology. 2007;44:545–547. [Google Scholar]
- Dhillon B, Wiesenborn D, Sidhu H, Wolf-Hall C. Improved microbial quality of buckwheat using antimicrobial solutions in a fluidized bed. Journal of Food Science. 2012;77:E98–E103. doi: 10.1111/j.1750-3841.2012.02646.x. [DOI] [PubMed] [Google Scholar]
- Duarte SC, Pena A, Lino CM. A review on ochratoxin A occurrence and effects of processing of cereal and cereal derived food products. Food Microbiology. 2010;27:187–198. doi: 10.1016/j.fm.2009.11.016. [DOI] [PubMed] [Google Scholar]
- Dumonceaux TJ, Hill JE, Briggs SA, Amoako KK, Hemmingsen SM, Van Kessel AG. Enumeration of specific bacterial populations in complex intestinal communities using quantitative PCR based on the chaperonin-60 target. Journal of Microbiological Methods. 2006;64:46–62. doi: 10.1016/j.mimet.2005.04.006. [DOI] [PubMed] [Google Scholar]
- Dumonceaux TJ, Schellenberg J, Goleski V, Hill JE, Jaoko W, Kimani J, Money D, Ball TB, Plummer FA, Severini A. Multiplex detection of bacteria associated with normal microbiota and with bacterial vaginosis in vaginal swabs by use of oligonucleotide-coupled fluorescent microspheres. Journal of Clinical Microbiology. 2009;47:4067–4077. doi: 10.1128/JCM.00112-09. [DOI] [PMC free article] [PubMed] [Google Scholar]
- Gihring TM, Green SJ, Schadt CW. Massively parallel rRNA gene sequencing exacerbates the potential for biased community diversity comparisons due to variable library sizes. Environmental Microbiology. 2012;14:285–290. doi: 10.1111/j.1462-2920.2011.02550.x. [DOI] [PubMed] [Google Scholar]
- Goh SH, Facklam RR, Chang M, Hill JE, Tyrrell GJ, Burns EC, Chan D, He C, Rahim T, Shaw C, et al. Identification of Enterococcus species and phenotypically similar Lactococcus and Vagococcus species by reverse checkerboard hybridization to chaperonin 60 gene sequences. Journal of Clinical Microbiology. 2000;38:3953–3959. doi: 10.1128/jcm.38.11.3953-3959.2000. [DOI] [PMC free article] [PubMed] [Google Scholar]
- Granér G, Persson P, Meijer J, Alström S. A study on microbial diversity in different cultivars of Brassica napus in relation to its wilt pathogen, Verticillium longisporum. FEMS Microbiology Letters. 2003;224:269–276. doi: 10.1016/S0378-1097(03)00449-X. [DOI] [PubMed] [Google Scholar]
- Greco M, Patriarca A, Terminiello L, Fernández Pinto V, Pose G. Toxigenic Alternaria species from Argentinean blueberries. International Journal of Food Microbiology. 2012;154:187–191. doi: 10.1016/j.ijfoodmicro.2012.01.004. [DOI] [PubMed] [Google Scholar]
- Hallmann J, Quadt-Hallmann A, Mahaffee WF, Kloepper JW. Bacterial endophytes in agricultural crops. Canadian Journal of Microbiology. 1997;43:895–914. [Google Scholar]
- Harker KN, O’Donovan JT, Turkington TK, Blackshaw RE, Lupwayi NZ, Smith EG, Klein-Gebbinck H, Dosdall LM, Hall LM, Willenborg CJ, et al. High-yield no-till canola production on the Canadian prairies. Canadian Journal of Plant Science. 2012;92:221–233. [Google Scholar]
- Hashidoko Y. Ecochemical studies of interrelationships between epiphytic bacteria and host plants via secondary metabolites. Bioscience, Biotechnology, and Biochemistry. 2005;69:1427–1441. doi: 10.1271/bbb.69.1427. [DOI] [PubMed] [Google Scholar]
- Hayat R, Ali S, Amara U, Khalid R, Ahmed I. Soil beneficial bacteria and their role in plant growth promotion: a review. Annals of Microbiology. 2010;60:579–598. [Google Scholar]
- Hemmingsen SM, Woolford C, van der Vies SM, Tilly K, Dennis DT, Georgopoulos CP, Hendrix RW, Ellis RJ. Homologous plant and bacterial proteins chaperone oligomeric protein assembly. Nature. 1988;333:330–334. doi: 10.1038/333330a0. [DOI] [PubMed] [Google Scholar]
- Hill JE, Hemmingsen SM, Goldade BG, Dumonceaux TJ, Klassen J, Zijlstra RT, Goh SH, Van Kessel AG. Comparison of ileum microflora of pigs fed corn-, wheat-, or barley-based diets by chaperonin-60 sequencing and quantitative PCR. Applied and Environment Microbiology. 2005;71:867–875. doi: 10.1128/AEM.71.2.867-875.2005. [DOI] [PMC free article] [PubMed] [Google Scholar]
- Hill JE, Penny SL, Crowell KG, Goh SH, Hemmingsen SM. cpnDB: a chaperonin sequence database. Genome Research. 2004;14:1669–1675. doi: 10.1101/gr.2649204. [DOI] [PMC free article] [PubMed] [Google Scholar]
- Hill JE, Town JR, Hemmingsen SM. Improved template representation in cpn60 polymerase chain reaction (PCR) product libraries generated from complex templates by application of a specific mixture of PCR primers. Environmental Microbiology. 2006;8:741–746. doi: 10.1111/j.1462-2920.2005.00944.x. [DOI] [PubMed] [Google Scholar]
- Hill TCJ, Walsh KA, Harris JA, Moffett BF. Using ecological diversity measures with bacterial communities. FEMS Microbiology Ecology. 2003;43:1–11. doi: 10.1111/j.1574-6941.2003.tb01040.x. [DOI] [PubMed] [Google Scholar]
- Johnston-Monje D, Raizada MN. Conservation and diversity of seed associated endophytes in Zea across boundaries of evolution, ethnography and ecology. PLoS ONE. 2011;6:e20396. doi: 10.1371/journal.pone.0020396. [DOI] [PMC free article] [PubMed] [Google Scholar]
- Kearns LP, Hale CN. Partial characterization of an inhibitory strain of Erwinia herbicola with potential as a biocontrol agent for Erwinia amylovora, the fire blight pathogen. Journal of Applied Bacteriology. 1996;81:369–374. [Google Scholar]
- Kempf HJ, Wolf G. Erwinia herbicola as a biocontrol agent of Fusarium culmorum and Puccinia recondita f. sp. tritici on wheat. Phytopathology. 1989;79:990–994. [Google Scholar]
- Kim J, Demeke T, Clear RM, Patrick SK. Simultaneous detection by PCR of Escherichia coli Listeria monocytogenes and Salmonella typhimurium in artificially inoculated wheat grain. International Journal of Food Microbiology. 2006;111:21–25. doi: 10.1016/j.ijfoodmicro.2006.04.032. [DOI] [PubMed] [Google Scholar]
- Langmead B, Salzberg SL. Fast gapped-read alignment with Bowtie 2. Nature Methods. 2012;9:357–359. doi: 10.1038/nmeth.1923. [DOI] [PMC free article] [PubMed] [Google Scholar]
- Lee DH, Zo YG, Kim SJ. Nonradioactive method to study genetic profiles of natural bacterial communities by PCR-single-strand-conformation polymorphism. Applied and Environment Microbiology. 1996;62:3112–3120. doi: 10.1128/aem.62.9.3112-3120.1996. [DOI] [PMC free article] [PubMed] [Google Scholar]
- Lee LY, Liu ST. Characterization of the yellow-pigment genes of Erwinia herbicola. Molecular Microbiology. 1991;5:217–224. doi: 10.1111/j.1365-2958.1991.tb01842.x. [DOI] [PubMed] [Google Scholar]
- Links MG, Chaban B, Hemmingsen S, Muirhead K, Hill J. mPUMA: a computational approach to microbiota analysis by de novo assembly of operational taxonomic units based on protein-coding barcode sequences. Microbiome. 2013;1:23. doi: 10.1186/2049-2618-1-23. [DOI] [PMC free article] [PubMed] [Google Scholar]
- Links MG, Dumonceaux TJ, Hemmingsen SM, Hill JE. The chaperonin-60 universal target is a barcode for bacteria that enables de novo assembly of metagenomic sequence data. PLoS ONE. 2012;7:e49755. doi: 10.1371/journal.pone.0049755. [DOI] [PMC free article] [PubMed] [Google Scholar]
- Lucero ME, Unc A, Cooke P, Dowd S, Sun S. Endophyte microbiome diversity in micropropagated Atriplex canescens and Atriplex torreyi var griffithsii. PLoS ONE. 2011;6:e17693. doi: 10.1371/journal.pone.0017693. [DOI] [PMC free article] [PubMed] [Google Scholar]
- Lundberg DS, Lebeis SL, Paredes SH, Yourstone S, Gehring J, Malfatti S, Tremblay J, Engelbrektson A, Kunin V, Rio TGD, et al. Defining the core Arabidopsis thaliana root microbiome. Nature. 2012;488:86–90. doi: 10.1038/nature11237. [DOI] [PMC free article] [PubMed] [Google Scholar]
- Magan N, Aldred D. Post-harvest control strategies: minimizing mycotoxins in the food chain. International Journal of Food Microbiology. 2007;119:131–139. doi: 10.1016/j.ijfoodmicro.2007.07.034. [DOI] [PubMed] [Google Scholar]
- Magan N, Aldred D, Mylona K, Lambert RJW. Limiting mycotoxins in stored wheat. Food Additives and Contaminants – Part A Chemistry, Analysis, Control, Exposure and Risk Assessment. 2010;27:644–650. doi: 10.1080/19440040903514523. [DOI] [PubMed] [Google Scholar]
- Olaimat AN, Holley RA. Factors influencing the microbial safety of fresh produce: a review. Food Microbiology. 2012;32:1–19. doi: 10.1016/j.fm.2012.04.016. [DOI] [PubMed] [Google Scholar]
- Rastogi G, Sbodio A, Tech JJ, Suslow TV, Coaker GL, Leveau JHJ. Leaf microbiota in an agroecosystem: spatiotemporal variation in bacterial community composition on field-grown lettuce. ISME Journal. 2012;6:1812–1822. doi: 10.1038/ismej.2012.32. [DOI] [PMC free article] [PubMed] [Google Scholar]
- Rozen S, Skaletsky H. Primer3 on the WWW for general users and for biologist programmers. Methods in molecular biology (Clifton, N.J.) 2000;132:365–386. doi: 10.1385/1-59259-192-2:365. [DOI] [PubMed] [Google Scholar]
- Saitou N, Nei M. The neighbor-joining method: a new method for reconstructing phylogenetic trees. Molecular Biology and Evolution. 1987;4:406–425. doi: 10.1093/oxfordjournals.molbev.a040454. [DOI] [PubMed] [Google Scholar]
- Schellenberg J, Links MG, Hill JE, Dumonceaux TJ, Peters GA, Tyler SD, Ball TB, Severini A, Plummer FA. Pyrosequencing of the chaperonin-60 universal target as a tool for determining microbial community composition. Applied and Environment Microbiology. 2009;75:2889–2898. doi: 10.1128/AEM.01640-08. [DOI] [PMC free article] [PubMed] [Google Scholar]
- Schellenberg J, Links MG, Hill JE, Hemmingsen SM, Peters GA, Dumonceaux TJ. Pyrosequencing of chaperonin-60 (cpn60) amplicons as a means of determining microbial community composition. In: Kwon YM, Ricke SC, editors. High-throughput next generation sequencing: methods and applications. New York, NY, USA: Humana Press; 2011. pp. 143–158. [DOI] [PubMed] [Google Scholar]
- Schloss PD, Gevers D, Westcott SL. Reducing the effects of PCR amplification and sequencing artifacts on 16S rRNA-based studies. PLoS ONE. 2011;6:e27310. doi: 10.1371/journal.pone.0027310. [DOI] [PMC free article] [PubMed] [Google Scholar]
- Schloss PD, Handelsman J. A statistical toolbox for metagenomics: assessing functional diversity in microbial communities. BMC Bioinformatics. 2008;9:34. doi: 10.1186/1471-2105-9-34. [DOI] [PMC free article] [PubMed] [Google Scholar]
- Schloss PD, Westcott SL, Ryabin T, Hall JR, Hartmann M, Hollister EB, Lesniewski RA, Oakley BB, Parks DH, Robinson CJ, et al. Introducing mothur: open-source, platform-independent, community-supported software for describing and comparing microbial communities. Applied and Environment Microbiology. 2009;75:7537–7541. doi: 10.1128/AEM.01541-09. [DOI] [PMC free article] [PubMed] [Google Scholar]
- Schoch CL, Seifert KA, Huhndorf S, Robert V, Spouge JL, Levesque CA, Chen W, Fungal Barcoding C. Nuclear ribosomal internal transcribed spacer (ITS) region as a universal DNA barcode marker for Fungi. Proceedings of the National Academy of Sciences, USA. 2012;109:6241–6246. doi: 10.1073/pnas.1117018109. [DOI] [PMC free article] [PubMed] [Google Scholar]
- Tamura K, Dudley J, Nei M, Kumar S. MEGA4: Molecular Evolutionary Genetics Analysis (MEGA) software version 4.0. Molecular Biology and Evolution. 2007;24:1596–1599. doi: 10.1093/molbev/msm092. [DOI] [PubMed] [Google Scholar]
- Tamura K, Nei M, Kumar S. Prospects for inferring very large phylogenies by using the neighbor-joining method. Proceedings of the National Academy of Sciences, USA. 2004;101:11030–11035. doi: 10.1073/pnas.0404206101. [DOI] [PMC free article] [PubMed] [Google Scholar]
- Taylor JL. A simple, sensitive, and rapid method for detecting seed contaminated with highly virulent Leptosphaeria maculans. Applied and Environment Microbiology. 1993;59:3681–3685. doi: 10.1128/aem.59.11.3681-3685.1993. [DOI] [PMC free article] [PubMed] [Google Scholar]
- Thompson JD, Higgins DG, Gibson TJ. CLUSTAL W: improving the sensitivity of progressive multiple sequence alignment through sequence weighting, position-specific gap penalties and weight matrix choice. Nucleic Acids Research. 1994;22:4673–4680. doi: 10.1093/nar/22.22.4673. [DOI] [PMC free article] [PubMed] [Google Scholar]
- Tikhonovich IA, Provorov NA. Microbiology is the basis of sustainable agriculture: an opinion. Annals of Applied Biology. 2011;159:155–168. [Google Scholar]
- Verbeke TJ, Sparling R, Hill JE, Links MG, Levin D, Dumonceaux TJ. Predicting relatedness of bacterial genomes using the chaperonin-60 universal target (cpn60 UT): application to Thermoanaerobacter species. Systematic and Applied Microbiology. 2011;34:171–179. doi: 10.1016/j.syapm.2010.11.019. [DOI] [PubMed] [Google Scholar]
- Vermette CJ, Russell AH, Desai AR, Hill JE. Resolution of phenotypically distinct strains of Enterococcus spp. in a complex microbial community using cpn60 universal target sequencing. Microbial Ecology. 2009;59:14–24. doi: 10.1007/s00248-009-9601-1. [DOI] [PubMed] [Google Scholar]
- Weiss A, Hertel C, Grothe S, Ha D, Hammes WP. Characterization of the cultivable microbiota of sprouts and their potential for application as protective cultures. Systematic and Applied Microbiology. 2007;30:483–493. doi: 10.1016/j.syapm.2007.03.006. [DOI] [PubMed] [Google Scholar]
- Wendland J, Lengeler KB, Kothe E. An instant preparation method for nucleic acids of filamentous fungi. Fungal Genetics Newsletter. 1996;43:54–55. [Google Scholar]
- Yu F, Lydiate DJ, Rimmer SR. Identification of two novel genes for blackleg resistance in Brassica napus. TAG. Theoretical and Applied Genetics. 2005;110:969–979. doi: 10.1007/s00122-004-1919-y. [DOI] [PubMed] [Google Scholar]
- Zahariev M, Dahl V, Chen W, Levesque CA. Efficient algorithms for the discovery of DNA oligonucleotide barcodes from sequence databases. Molecular Ecology Resources. 2009;9(Suppl s1):58–64. doi: 10.1111/j.1755-0998.2009.02651.x. [DOI] [PubMed] [Google Scholar]
- Zegada-Lizarazu W, Monti A. Energy crops in rotation. A review. Biomass and Bioenergy. 2011;35:12–25. [Google Scholar]
- Zeigler DR. Gene sequences useful for predicting relatedness of whole genomes in bacteria. International Journal of Systematic and Evolutionary Microbiology. 2003;53:1893–1900. doi: 10.1099/ijs.0.02713-0. [DOI] [PubMed] [Google Scholar]
Associated Data
This section collects any data citations, data availability statements, or supplementary materials included in this article.
Supplementary Materials
Fig. S1 Family-level taxonomic profile of Triticum and Brassica samples.
Fig. S2 Community statistics for Triticum and Brassica seed samples.
Fig. S3 Determination of the Triticum/Brassica seed-associated shared OTU with increasing paired sample size.
Fig. S4 Phylogenetic analysis of ITS sequences of fungal isolates compared with reference sequences.
Fig. S5 Interactions of selected bacterial isolates with the fungal pathogen Leptosphaeria maculans.
Notes S1 Rarefaction plots.
Table S1 List of OTU shared between Triticum and Brassica seed washes