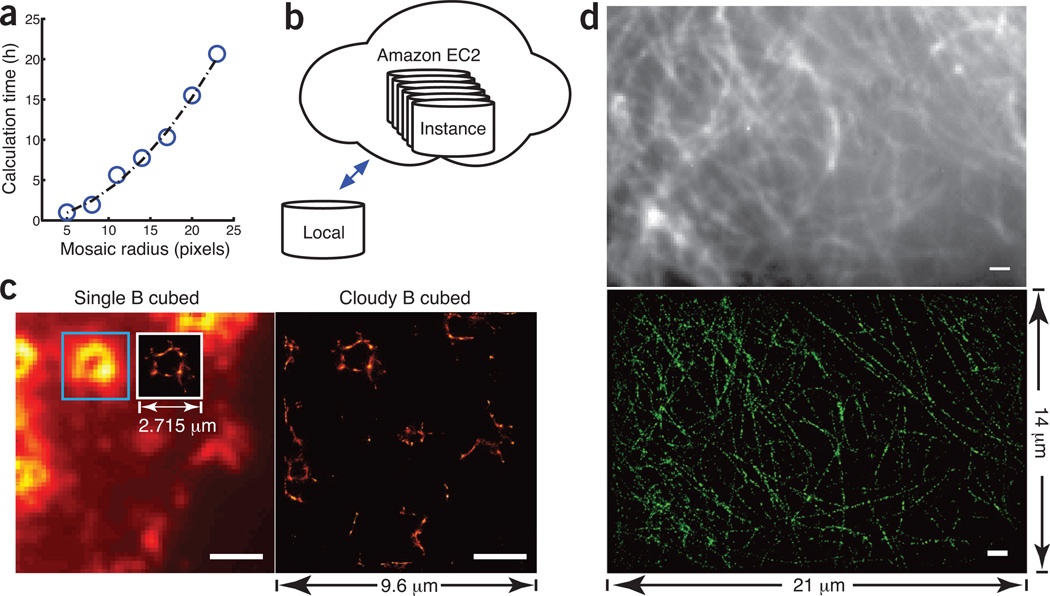
To the Editor: The recently invented technique of Bayesian localization microscopy1 relaxes the requirement for an extremely high signal-to-background ratio for single-molecule super-resolution microscopy2–5. It enables a standard wide-field fluorescence microscope to generate super-resolution images from the stochastic bleaching and blinking6,7 of fluorescence dyes (3B analysis). Although the new 3B microscopy has enormous potential to put the power of super-resolution imaging into the hands of average biologists, its underlying algorithm can be an impediment. Calculating an area of 50 × 50 pixels takes approximately a full day on a state-of-the-art desktop computer (Fig. 1a). For larger image areas, the need for massive computing resources makes the 3B analysis inaccessible to many labs and limits its scope of application. We report here a simple solution for everyone: the Amazon Elastic Compute Cloud (Amazon EC2).
Figure 1. 3B analysis using Amazon EC2.
(a) Computation time versus the radius of the mosaic. (b) Illustration of the Amazon EC2 cloud that contains multiple instances, each of which can be individually configured on demand. (c) Cloud computing accelerates image reconstruction with increased field of view. Left, for a measured image, the inset shows super-resolution reconstruction of an area of 2.7 × 2.7 µm using a quad-core Core i7 computer; right, reconstruction of an increased area of 9.6 × 9.6 µm using 25 EC2 instances. The improvement is 12.5-fold. (d) Top, confocal epifluorescence image of PAmCherry-tagged tubulins in a U2OS cell with a field of view of 21 × 14 µm. Bottom, reconstructed image obtained by running 300 Amazon instances for 3.5 h. The same calculation would otherwise take 9 d to complete on a single-core computer. Scale bars, 2 µm (c) and 1 µm (d).
Aside from its flexible and cost-effective super-computing power, the greatest advantages of Amazon EC2 are its accessibility and ease of use. Normally, porting a computational code to a new system involves the configuration of a system-dependent software environment. The convoluted configuration process—not to mention the increased complexity for cluster computing—often discourages scientists without programming backgrounds. Use of Amazon EC2 significantly lowers this entry barrier. By packaging the executable program together with its running environment in a single image file known as the Amazon machine image (AMI), we can distribute 3B analysis to the public through the Amazon Marketplace. Hundreds of processes can run on instances, with each instance configured as an exact copy of the AMI. A user can launch massively parallel 3B processes on the Cloud from a local computer in just a few minutes (Fig. 1b and Supplementary Video 1).
Large computing power allows data analysis without compromising on field of view. We tested Amazon EC2 using the photoactivatable (PA) mCherry–tagged podosome data from ref. 1 (Fig. 1c). The recorded image was divided into small mosaics of 12 × 12 pixels. The mosaics were analyzed in parallel and recombined to form a super-resolution image of 9.6 × 9.6 µm. Given the same computation time, an eight-thread 3.40-GHz Intel Core i7 desktop computer could analyze a region of 2.715 × 2.715 µm. The image generated from 100 virtual cores from Amazon EC2 was 12 times as large.
An entry-level user of the Amazon Cloud may obtain up to 100 instances at about $0.02–$0.06 per instance hour. Depending on the market price, reconstruction of a 25 × 25–µm image costs less than $25. We strongly recommend the use of our bash scripts to continuously monitor the reconstructed image (Supplementary Software and tutorial therein). The calculation should be terminated only when the structrual features have converged, as otherwise potentially serious image artifacts may still be present. Researchers may apply for Amazon Web Service research grants for additional computing hours. We performed a test with 300 instances of 600 virtual cores. An image of PAmCherry-tagged tubulins in U2OS cells (from our own experiments) with the size of 150 pixels × 100 pixels × 1,500 frames could be reconstructed in only 210 min (Fig. 1d), whereas on a state-of-the-art desktop computer, this process would have taken 9 d.
Cloud computing has been transforming the information technology industry through its elastic and flexible on-demand services. Although cloud computing has contributed to the success of many companies such as Dropbox and Netflix, until now it has been little used in biological research. Through this Correspondence, we hope to highlight its huge potential for the imaging community.
Supplementary Material
ACKNOWLEDGMENTS
We thank E. Rotsen for helping us install the 3B analysis software. This research is supported by the Waitt Foundation.
Footnotes
Note: Supplementary information is available at http://www.nature.com/doifinder/10.1038/nmeth.2335.
COMPETING FINANCIAL INTERESTS
The authors declare no competing financial interests.
References
- 1.Cox S, et al. Nat. Methods. 2012;9:195–200. doi: 10.1038/nmeth.1812. [DOI] [PMC free article] [PubMed] [Google Scholar]
- 2.Betzig E, et al. Science. 2006;313:1642–1645. doi: 10.1126/science.1127344. [DOI] [PubMed] [Google Scholar]
- 3.Patterson G, Davidson M, Manley S, Lippincott-Schwartz J. Annu. Rev. Phys. Chem. 2010;61:345–367. doi: 10.1146/annurev.physchem.012809.103444. [DOI] [PMC free article] [PubMed] [Google Scholar]
- 4.Rust MJ, Bates M, Zhuang X. Nat. Methods. 2006;3:793–795. doi: 10.1038/nmeth929. [DOI] [PMC free article] [PubMed] [Google Scholar]
- 5.Huang B, Wang W, Bates M, Zhuang X. Science. 2008;319:810–813. doi: 10.1126/science.1153529. [DOI] [PMC free article] [PubMed] [Google Scholar]
- 6.Dertinger T, Colyer R, Iyer G, Weiss S, Enderlein J. Proc. Natl. Acad. Sci. USA. 2009;106:22287–22292. doi: 10.1073/pnas.0907866106. [DOI] [PMC free article] [PubMed] [Google Scholar]
- 7.Burnette DT, Sengupta P, Dai Y, Lippincott-Schwartz J, Kachar B. Proc. Natl. Acad. Sci. USA. 2011;108:21081–21086. doi: 10.1073/pnas.1117430109. [DOI] [PMC free article] [PubMed] [Google Scholar]
Associated Data
This section collects any data citations, data availability statements, or supplementary materials included in this article.


