Abstract
Single Particle Tracking (SPT) is a technique used to locate fluorescent particles with nanometer precision. In the orbital tracking method the position of a particle is obtained analyzing the distribution of intensity along a circular orbit scanned around the particle. In combination with an active feedback this method allows tracking of particles in 2D and 3D with millisecond temporal resolution. Here we describe a SPT setup based on a feedback approach implemented with minimal modification of a commercially available confocal laser scanning microscope, the Zeiss LSM 510, in combination with an external piezoelectric stage scanner. The commercial microscope offers the advantage of a user-friendly software interface and pre-calibrated hardware components. The use of an external piezo-scanner allows the addition of feedback into the system but also represents a limitation in terms of its mechanical response. We describe in detail this implementation of the orbital tracking method and discuss advantages and limitations. As an example of application to live cell experiments we perform the 3D tracking of acidic vesicles in live polarized epithelial cells.
1. Introduction
Single Particle Tracking (SPT) is a superresolution imaging technique able to provide the position of fluorescent molecules with nanometer precision. SPT finds several applications in biology where following the dynamics of processes at the nanoscale can be of crucial importance. One of the main advantages of observing a single molecule compared to ensemble measurements is that results can be obtained without the need of synchronizing processes. Indeed, single molecule techniques have revolutionized the scientific research by allowing the investigation of once-inaccessible biological processes (Cornish and Ha, 2007). Several single molecule techniques are currently available to study the motion of molecules in live cells, including Fluorescence Correlation Spectroscopy (FCS) and SPT. FCS is a widely used tool to determine diffusion coefficients, chemical rate constants, molecular concentrations, fluorescence brightness and other molecular parameters (Elson, 2011). In FCS the molecules are observed one at the time through the use of small detection volumes at fixed locations and the molecular parameters are generally obtained by averaging many single molecule fluctuation events. In SPT the same molecule or particle is observed for a longer period of time so that heterogeneities in time or space and subpopulations become more evident. For this reason SPT is the method of choice to study in detail the mechanisms of motion of molecules or other kind of particles within the biological environment. SPT has been applied to address several biological problems including the motion of bacteria (Frymier et al., 1995), the stepping mechanism of molecular motors (Gelles et al., 1988, Yildiz et al., 2003), the diffusion of lipids in the plasma membrane (Fujiwara et al., 2002, Schutz et al., 2000), the entry process of adeno-associated viruses along their infection pathway (Seisenberger et al., 2001) or the trajectories of other biomolecules of interest inside the cell (Kubitscheck et al., 2000).
The standard, well established microscopy methodology for SPT is based on the analysis of 2D fluorescence images, typically acquired using a widefield configuration (Yildiz et al., 2003). The basic principle for obtaining resolution well below the diffraction limit in SPT is that the center of mass of a spatial distribution of intensities can be recovered with significantly higher precision than the size of the distribution itself (Bobroff, 1986, Thompson et al., 2002). This basic idea is shared by other fluorescence superresolution techniques like PALM (Betzig et al., 2006, Shroff et al., 2008) or STORM (Huang et al., 2008, Rust et al., 2006), and a common requirement is that one must analyzes the intensity distribution generated by just a single particle, meaning that its emission must be isolated in space (as in SPT) or in time (as in PALM/STORM). The main limitation of the standard SPT method is that it is confined to the analysis of 2D images whereas several biologically relevant processes happen in 3 dimensions. In order to overcome this limitation several methods have been proposed for 3D SPT that can be classified into two main categories: (i) image-based approaches followed by the offline extraction of the trajectories and (ii) feedback approaches where tracking is performed in real time (Dupont and Lamb, 2011). The first category includes z-sectioning with a confocal or multiphoton microscope in a predetermined volume and analyzing afterwards the images to obtain 3D tracks (Arhel et al., 2006). This method generally suffers of a poor time resolution limited to the second time-scale and alternative strategies have been proposed based on the acquisition and analysis of one or few images (Pavani and Piestun, 2008, Betzig et al., Speidel et al., 2003). The second category of 3D tracking techniques is based on a feedback strategy: the particle position is determined in real-time and the focus of the setup is consequently displaced in order to keep the particle of interest at the center of the focus. These feedback techniques (Cang et al., 2008) generally have a good temporal resolution, on the order of milliseconds, and include the ABEL trap (Fields and Cohen, 2011), the tetrahedral detection method (Han et al., 2012) and the orbital tracking method (Hellriegel and Gratton, 2009, Kis-Petikova and Gratton, 2004, Levi et al., 2005). One major criticism versus these relatively fast feedback techniques is that they do not provide a real-time image of the particle being tracked and for this purpose elegant hybrid approaches have been introduced (Juette and Bewersdorf, 2010, Katayama et al., 2009). On the other hand the versatility of the orbital tracking approach has been recently proved by the successful combination of this method with Fluorescence Correlation Spectroscopy (FCS) and 3D imaging (Cardarelli et al., 2011, Cardarelli et al., 2012, Lanzano et al., 2011a, Lanzano et al., 2011b), showing that the use of feedback can be beneficial also on extracting different types of information other than the trajectory itself.
The orbital tracking and the other 3D SPT feedback methods are generally implemented on homebuilt microscopes which are not yet commercially available. Currently available setups include microscopes with sectioning capabilities as the confocal, multiphoton or spinning disk microscopes, that could be used for 3D image-based SPT with relatively limited time resolution. These commercial setups offer the advantage of a user-friendly software interface and pre-calibrated hardware components. It would be of interest to implement a SPT setup based on a feedback approach with minimal modification of a commercially available microscope. Here we explore this idea using a widely used confocal laser scanning microscope, the Zeiss LSM 510, in combination with an external piezoelectric stage. The use of an external scanner is necessary since the manufacturers in general do not provide access to the scanning module and as a consequence the scanning pattern is predetermined and cannot be modified. The choice of using an external piezoelectric stage is the simplest in term of realization since does not require any modification of the optical pathway. The main disadvantage is that the mechanical response of this type of scanners is generally limited to frequencies below 100Hz and they are not the best choice for fast line scanning if compared to galvano-mirror deflectors. On the other hand, for many applications orbiting at a period on the order of 10ms is still an acceptable compromise. For instance scanning FCS on membranes can be performed with line times of the order of tens of ms, without compromising the capability to detect the slower diffusion coefficients typical of membrane proteins or clusters. The same is true for 3D imaging using the nSPIRO method (Lanzano and Gratton, 2012) where membrane protrusions are tracked in 2D while the third coordinate is ramped at a slower pace. In the following we describe in detail this implementation of the orbital tracking method on a commercial microscope and its characterization. In order to show that the method is suitable for measurements in live cells we show 3D trajectories of fluorescently labeled vesicles in polarized epithelial cells.
2. Experimental Section
2.1 Experimental Setup
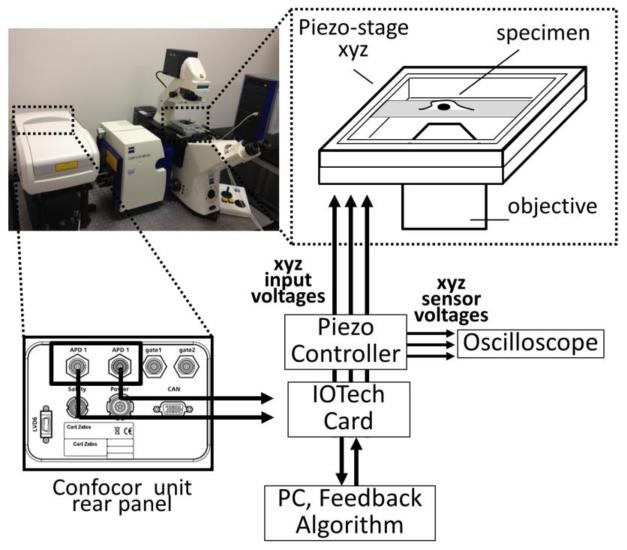
The commercial setup used in this work is a Zeiss LSM510 (Jena, Germany) confocal laser scanning microscope (LSM) equipped with a Confocor3 unit (figure 1). The specimen is loaded on a 3-axis piezoelectric nanopositioner (Nano-PDQ, Mad City Labs, Madison, WI) mounted on the microscope stage. The piezo-stage is driven by a Nano-Drive (Mad City Labs, Madison, WI) controller. The scanning voltages sent to the controller are generated through a card (model DaqBoard/3001, IOTech, Cleveland, OH) connected to a personal computer. The controller front panel outputs provide access to the real-time position sensor signals and can be connected to an oscilloscope for calibration of the scanning patterns. When we use the piezo-stage to scan the sample we keep the laser spot at a fixed location. Using the LSM software we configure the excitation and emission pathways and adjust several parameters as the laser power and the size of the confocal pinhole. A 40× water immersion objective (Zeiss C-Apochromat NA=1.2) was used for all experiments. Fluorescence single-photon detection is performed through the Avalanche Photo Diodes (APD) of the Confocor3 unit. The TTL signals corresponding to single-photon detection events are collected from the outputs on the Confocor3 unit rear panel and sent to the IOTech card. Signals from both channels can be acquired simultaneously even if only one channel is used as a feedback signal in the tracking algorithm.
Figure 1.
Schematic design of the experimental setup for Single Particle Tracking: a 3-axis piezo-stage mounted on a commercial confocal microscope (Zeiss LSM510-Confocor3) is used to move the sample with respect to the focal spot. The movement of the piezo-stage along the 3 axis is controlled by a PC through a card that generates the input voltages. The same card is used for acquisition of the signals from the detection unit of the microscope. The position of the piezo-scanner can be monitored connecting the capacitive sensors outputs to an oscilloscope.
2.2 Orbital scanning
During orbital scanning, the x and y axis of the piezo-stage are driven independently by π/2-phase shifted sine wave voltages generated in the card so that the specimen moves in a circular path at orbital frequency ω with respect to the laser spot. The position of the center of the orbit is determined by the offset values of the sine waves. The voltage inputs can be expressed as:
| (1) |
Depending on the frequency and the mechanical response of the scanner, the actual movement of the scanner can be of lower amplitude and with a phase delay with respect to the input. The x-axis and y-axis position sensor output voltages can be expressed as:
| (2) |
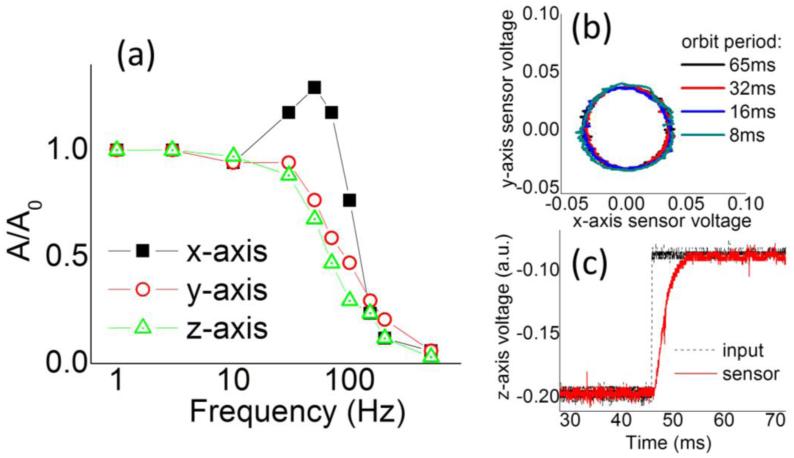
We determined the frequency response for each of the 3 axis of the piezo-scanner (figure 2(a)) by applying a sinusoidal wave of amplitude A0 and variable frequency and measuring the amplitude A and phase of the signal detected in the position sensor output. Each axis of the scanner can be driven at frequencies up to about 100Hz. For each orbital frequency the input parameters (Ax, Ay, φ0x, φ0y) of the x-axis and y-axis of the scanner can be calibrated so that effective motion pattern is a circular orbit (figure 2(b)) with Ax=Ay and φx–φ0x= φy–φ0y=0.
Figure 2.
(a) Frequency response of each axis of the piezo to a sinusoidal input voltage signal. (b) Orbital trajectory of the scanner monitored through the capacitive sensor for different orbit periods. (d) Response of the piezo to a step-like input along the z-axis.
The signal acquisition is synchronized with the orbital scanning. The intensity is sampled at a frequency which is equal to the orbital frequency times the number of pixels along the orbit. For instance for an orbit of period T=8.192ms and 256 pixels along the orbit, the pixel dwell time is Δt=8.192ms/256=32μs.
2.3 2D and 3D Orbital Tracking
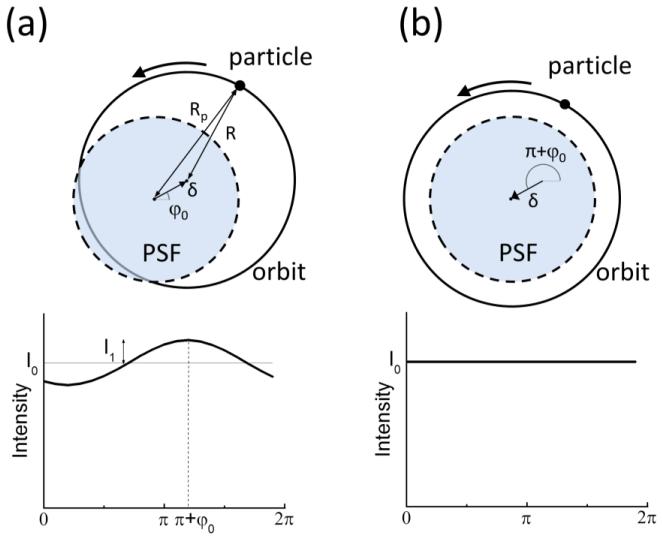
For 2D orbital Tracking the position of the center of the scanned orbit was updated according to the tracking mechanism every cycle of 8 orbits (tcycle=8T=65.5ms) using the Fast Fourier Transform (FFT)-based algorithm described previously (Kis-Petikova and Gratton, 2004). The algorithm has been originally implemented in setups using mirror scanners but it is also valid for orbital tracking using piezo-scanners. In this case the particle is moved along an orbit of radius R around its position whereas the focal spot is kept fixed (figure 3). If the particle position is shifted with respect to the focal spot of an amount δ in the direction φ0, then the intensity is given by:
| (3) |
Figure 3.
Schematic principle of the Orbital Tracking method using the piezo-scanner. (a) A fluorescent particle located at a distance δ and an angle φ0 from the focal spot is scanned along an orbit of radius R, generating a modulation in the intensity pattern along the orbit. Based on the values of phase and modulation of the intensity pattern the software calculates the position of the particle. (b) The calculated position of the particle is used as a feedback to correct the position of the scanner of an amount δ toward the direction π+φ0, so that the modulation of the intensity is minimized
Wherein Rp is the distance between the particle and the focal spot, w is the waist of the Point Spread Function (PSF) and F0 and I0 are constant. Considering for simplicity small values of 4Rδ/w2:
| (4) |
The algorithm updates the values of the offset voltages Vx and Vy in such a way as to minimize the modulation of the first harmonic in the Fourier spectrum of the intensity trace along the orbit. For the signal in Eq. (4) the modulation and phase of the first harmonic are by definition:
| (5) |
| (6) |
For each measured value of orbital modulation and phase the software calculates the values ΔVx and ΔVy corresponding to a shift δ of the piezo-scanner in direction π+φ0 (figure 3(b)). The value of δ is estimated according to a look-up-table obtained from previous calibration and stored in the computer. In this way the particle remains always close to laser spot while the piezo-stage is translated in opposite direction with respect to the movement of the particle.
For 3D orbital Tracking the orbits are sequentially scanned on two different z-axis positions. This is obtained by driving the z-axis of the piezo-scanner with a square wave whose period is a multiple of the orbital scanning period.
| (7) |
The response of the z-axis to a step-like input is in the order of few milliseconds (figure 2(c)) allowing us to use z-axis periods Tz of the order of 32ms or longer. The feedback along the z-axis is provided by measuring the difference in the average orbit intensity at two different z planes as described previously (Levi et al., 2005, Hellriegel and Gratton, 2009). In this case the modulation can be defined as:
| (8) |
Wherein I0[0,π] and I0[π,2π] represent the values of the average intensity in the first and second half of the z-axis period. For a Gaussian profile of the PSF along the z-axis we can write:
| (9) |
Wherein Rz is half of the distance between the orbits, wz is the waist of the PSF along the z direction, and δz is the distance between the focal spot and the plane at the center of the two orbits. The used approximation is rigorously valid only for small values of 4Rzδz/wz2. If the particle position is shifted of an amount δz then the modulation has opposite sign and the software updates the value of the offset voltage Vz of an amount ΔVz corresponding to a shift -δz of the piezo-scanner.
2.4 Software and data analysis
The software SimFCS (Global for Images) developed at the Laboratory for Fluorescence Dynamics (http://www.lfd.uci.edu/globals/) was used to control the scanning and acquisition in the tracking mode and for the data analysis. The total Mean Square Displacement (MSD) as a function of the delay time τ was calculated as the sum of the MSDs along each of the 3 axis:
| (10) |
Where the time average is performed on a given segment of the trajectory. In order to perform a segmentation of the trajectories and select the regions where significant particle movement occurs, we calculated for each time point t the square distance ΔR2(t) at which the particle is found after 50 time steps (3.25s). Then we selected the regions for which ΔR2(t)>3×10⁻² μm2 and minimum duration of 30 time steps as the regions where significant displacement occurs. The remaining parts were labeled as regions of non-significant displacement. This segmentation resulted in a subdivision of the trajectories in a number of segments ranging from 1 to 6. The average velocity of the particles in the segments of higher mobility was extracted by fitting the MSD to the following equation:
| (11) |
Where D is the diffusion coefficient and v is the linear velocity. This expression of the MSD corresponds to a model of directed transport plus a random diffusion component. The directed transport component could be interpreted as the motor-driven transport of the vesicles along cytoskeletal structures.
2.5 Fluorescent spheres
Yellow–green fluorescent microspheres (excitation/emission 505/515 nm, Invitrogen, Carlsbad, CA) of known diameter (0.11±0.01μm) were diluted, sonicated, and then fixed on a microscope slide. Fluorescence was excited at λexc=488nm and detected in the emission band 500-550nm. Confocal pinhole diameter was set to 1 Airy Unit (A.U.). Laser power was set at the relative value of 0.2% in the LSM software.
2.6 Cell culture and staining
Opossum kidney (OK) proximal tubule cells were kindly provided by Dr. M. Levi (University of Colorado, Denver) and cultured as described (Giral et al., 2011, Lanzano et al., 2011b). Cells were grown in DMEM/F-12 (Invitrogen, Carlsbad, CA) supplemented with 10 % fetal bovine serum, penicillin, streptomycin, and L-glutamine in 37 °CO2 controlled 95% humidified incubator. Prior to imaging, cells were trasnferred on poly-L-lysine-coated eight-well Nunc Lab-Tek chambered coverglass (Thermo Fisher Scientific) and grown until full confluence.
Selective staining of intracellular acidic vesicles was achieved using a solution of the pH-sensitive dye conjugate pHrodo Green Dextran (Life Technologies, Carlsbad, CA). According to manufacturer’s specifications pHrodo Green Dextran is essentially non-fluorescent outside the cell at neutral pH, but fluoresces brightly at acidic pH. Confluent OK cells were incubated with pHrodo Green Dextran at a concentration of 1μg/ml at 37°C for 10min. Then the cells were washed and the solution replaced with normal maintenance media. Fluorescence imaging was performed after 1h to allow internalization of the dye into acidic compartments. Fluorescence was excited at λexc=488nm and detected in the emission band 500-550nm. Confocal pinhole diameter was set to 1 Airy Unit (A.U.). Laser power was set at the relative value of 0.2% in the LSM software.
3. Results
3.1 Calibration using fixed fluorescent spheres
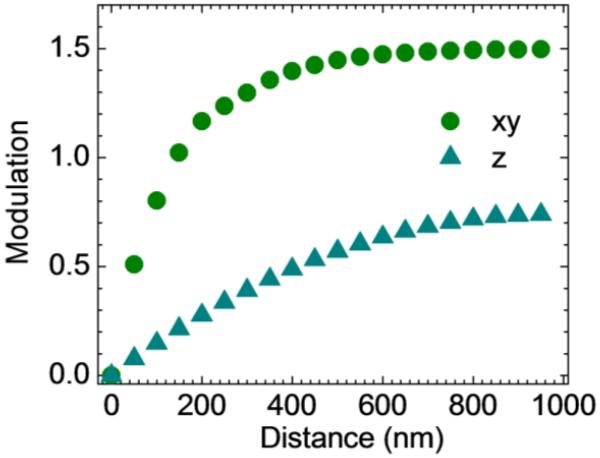
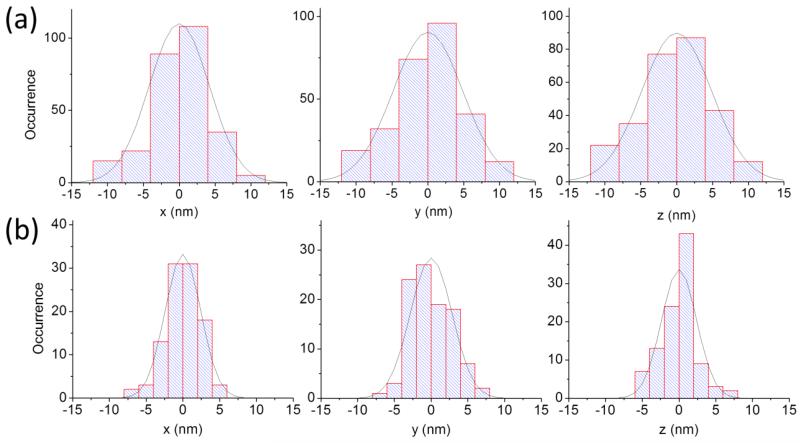
The modulation function of the setup can be determined experimentally by positioning a fixed particle at increasing distance from the beam. The modulation increases linearly as a function of the distance beam-particle with a slope which depends on the size of the PSF of the microscope setup according to the Eqs. (5) and (9). Since the waist of the confocal PSF is larger along the optical axis, the modulation varies more slowly when the particle is moved along the z direction than along the xy axis (figure 4(a)). The modulation function can be used as the base of the feedback to keep the particle centered with the beam. The position of the scanner is updated at each cycle based on the values of orbital modulation and z-modulation. The noise in the position of the scanner while tracking a fluorescent sphere fixed on a slide is shown in figure 5 for two different values of the intensity level. The standard deviation of the distribution approximately scales as the inverse of the square root of the intensity level.
Figure 4.
Characterization of the tracking setup. (a) Modulation versus distance beam-particle in the xy plane (dots) and z direction (triangles) respectively. This calibration curve has been obtained for 100nm fluorescent beads using an orbit radius of 150nm and a z-radius of 300nm.
Figure 5.
Relative position of the scanner while tracking a fluorescent 100nm bead fixed on a slide for two different intensity levels. The values of the standard deviation of the scanner position along each axis and intensity are (a) σx=4.2nm, σy=4.8nm, σz=4.9nm for an intensity level of 870 counts/cycle and (b) σx=2.4nm, σy=2.8nm, σz=2.4nm for an intensity level of 1843 counts/cycle (1 cycle=65.5ms).
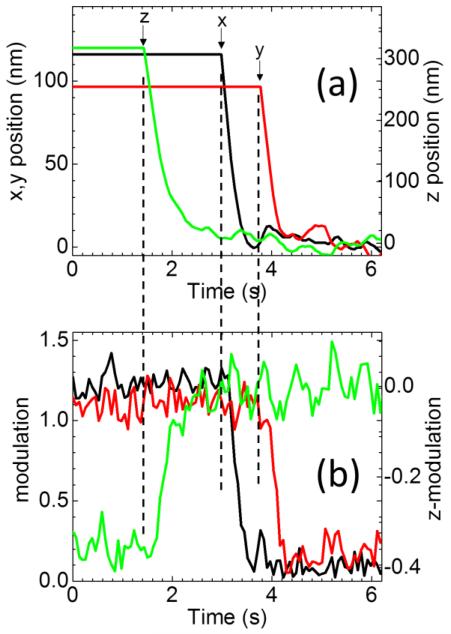
In order to test the tracking setup under dynamic conditions we positioned the particle at a given distance from the beam along the x, y or z axis (figure 6(a)), so that the value of modulation is different from zero (figure 6(b)). At a given instant the tracking algorithm is started so that particle is centered with the beam (figure 6(a)) and the modulation is minimized (figure 6(b)). The response of the tracking algorithm to a displacement of the particle is in the order of ~100ms. This limits the linear speed of the particles that can be tracked to values below vmax~1μm/s. In the case of particles diffusing randomly in 3D we estimate that tracking will be limited to values of diffusion coefficients below Dmax~0.01μm2/s.
Figure 6.
Response of the tracking algorithm to the displacement of the particle along the different axis. The particle is positioned at a given distance along x, y or z from the beam (a), so that the value of modulation is different from zero (b). At a given time (indicated by the arrows for each measurement) we start the tracking algorithm so that particle is centered with the beam (a) and the modulation minimized (b).
3.2 3D Single Particle Tracking in live cells
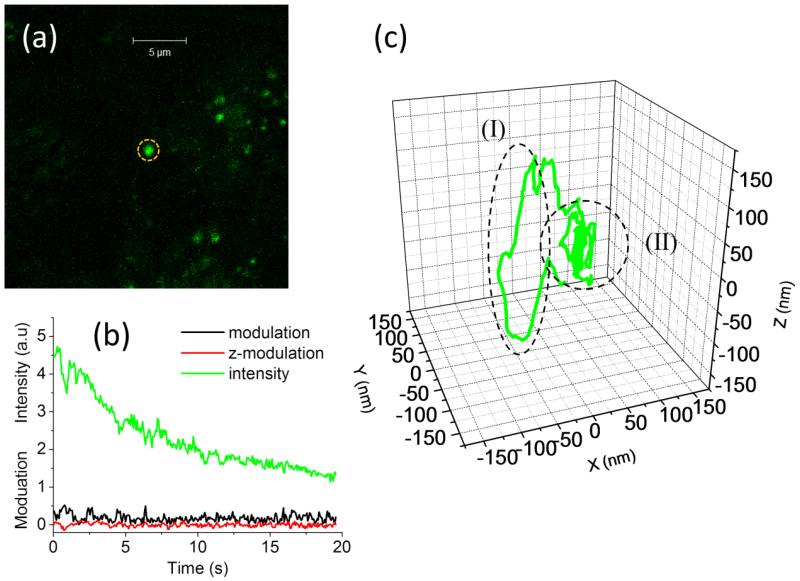
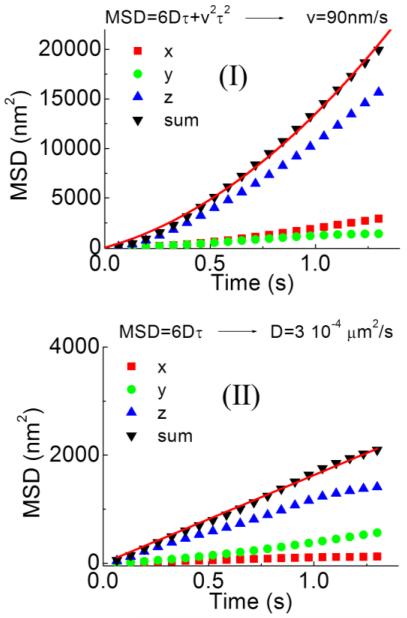
The 3D single particle tracking setup was tested in live polarized OK cells after internalization of the PH-sensitive dye conjugate pHrodo Green Dextran. After internalization of the dye, selective staining of intracellular acidic vesicles was obtained (figure 7(a)). The vesicles appear different in size and brightness. Using the commercial confocal microscope we can image the vesicles and locate an isolated one in the center of the field of view (figure 7(a)). At this point we switch to the tracking mode by keeping the laser beam steady and moving the external piezo-scanner. The tracked vesicle is kept close to laser beam by the feedback algorithm. The fluorescence intensity detected from the particle shows a continuous decay due to photobleaching (figure 7(b)). The values of orbital modulation and z-modulation are minimized and maintained close to zero (figure 7(b)). The movement of the scanner generated in response to the movement of the particle provides directly the 3D trajectory of the particle inside the cell (figure 7(c)). The 3D trajectories are characterized by the presence of segments where directed motion occurs and segments with only diffusive motion. For instance in the trajectory shown in figure 7(c) the directed motion in region (I) occurs along the z direction. The functional dependence of the Mean Square Displacement (MSD) on the delay time is different for the two regions analyzed (figure 8). In segment (I) the total MSD is well fitted by a parabola, indicating the presence of a directed transport component, whereas in segment (II) the total MSD is well fitted by a linear function, characteristic of random diffusion. The analysis of the trajectories (N=13) yields an average value of directed transport velocity of v=92±40nm/s (mean ± st. dev.) which is in keeping with values reported in literature for motor-based transport in polarized kidney tubule (MDCK) cells (Noda et al., 2001).
Figure 7.
3D single particle tracking of acidic vesicles in live polarized OK cells. (a) Confocal image of vesicles labeled with pHrodo Green Dextran in OK cells. An isolated vesicle is positioned in center of the field of view (dashed circle). (b) As the tracking algorithm is started, the particle is kept close to the laser beam, as demonstrated by the continuous photobleaching of the intensity and the value of modulation close to zero. (c) In the 3D trajectory we can distinguish a segment of directed motion (dashed oval, I) and a segment of diffusive motion (dashed circle, II).
Figure 8.
Analysis of a the 3D trajectory shown in figure 7(c). From the value of position as a function of time we can extract the MSD for each axis relative to the trajectory segment (I) and (II). In (I) the total MSD is well fitted by a parabola whereas in (II) the total MSD is well fitted by a linear function.
4. Discussion
The method described here falls in the category of the 3D tracking techniques based on a feedback strategy: the particle of interest is kept at the center of the focus and its position is determined in real-time by the displacement of the piezo-scanner. However, in this version of the orbital tracking method we are not using a homebuilt microscope but a commercially available confocal microscope. One great advantage of this setup configuration is that we can use the user-friendly software interface and pre-calibrated hardware components of the LSM to perform imaging. In this sense, the addition of an external stage represents certainly a minimal modification to the microscope which can be used in the very same way by the confocal microscope users to perform standard imaging. The use of an external piezoelectric stage does not require any special modification of the optical pathway. The tracking capability introduced by the external piezo-scanner represents effectively an additional option offered by the imaging setup.
The use of an external scanner is necessary since microscope manufacturers do not provide access to the scanning module and the scanning pattern is predetermined and cannot be modified to introduce feedback. The external scanner needs to be calibrated at least once and this operation requires trained personnel but, in principle, the calibration procedure could be automatized with the use of proper software and a standard fluorescent sample so that also non-expert users could perform it. The need to re-calibrate the scanner arises mainly in case there are huge changes in the load of the stage, but not if the weight of the specimen is approximately the same (as is the case for standard imaging dishes filled with cell culture media). The choice of using an external piezoelectric stage is the simplest in term of realization but the main disadvantage is that the mechanical response is generally limited to frequencies below 100Hz, an order of magnitude slower compared to galvano-mirror deflectors. The temporal response of the 3D tracking configuration is in the order of ~100ms resulting in an estimated maximum linear speed of the particles that can be tracked of vmax~1μm/s. This limit translates into a maximum diffusion coefficient Dmax~0.01μm2/s for particles diffusing randomly in 3D. This somewhat restricts the range of applicability for this type of setup to relatively slow moving particles.
The characterization of the setup shows that the modulation function depends on the size of the PSF, which in turn depends on several parameters of the confocal microscope (e.g. NA of the objective, excitation wavelength, pinhole size). In particular the modulation function is generally steeper along the radial direction than along to the axial direction, and the response of the feedback is calibrated accordingly. We showed measurement in which the particle is always in close proximity of the beam and the modulation is close to zero. In this case the movement of the scanner is exactly the opposite of the movement of the particle. Nevertheless, also in case the particle is temporarily lost, its position could be recovered by converting in distance the measured value of the modulation.
We showed that the method is suitable for measurements in live cells by tracking fluorescently labeled acidic vesicles in polarized epithelial cells. The cells can be imaged in the standard confocal mode and then the tracking can be activated to obtain the 3D trajectories of the vesicles. The trajectories show time segments in which the particles experience directed transport and segments where only a slow diffusion is observed. The directed motion has been observed in all three directions but we cannot conclude with enough statistical significance if there is or not a preferential direction of transport. The duration of a single measurement is limited mainly by photobleaching of the particles. This is not surprising because in the orbital tracking method, as compared for instance to raster scanning, the scanning is limited to a region always in close proximity of the particle and photobleaching occurs at a faster rate. The continuous photobleaching of the particle during tracking also affects how precise is the determination of the position of the particle. Indeed, the uncertainty in the position, which is a function of the number of detected photons, will not be the same for all the points of the trajectory but will be larger at longer times.
In conclusion, we presented a 3D SPT method based on a feedback approach implemented with minimal modification of a commercial confocal laser scanning microscope. Feedback-based scanning is obtained in the commercial microscope through addition of an external piezo-electric stage. The slow mechanical response of the scanner seems the main limitation to dynamic performance of this setup. On the other hand the availability of a setup for performing real time tracking in 3D on a commercial microscope seems an appealing feature of this orbital tracking configuration, especially for the biological applications where velocities are relatively low but imaging of the sample with a commercial system is preferred.
Acknowledgements
The authors thank Dr. M. Levi for kindly providing the OK cells. The authors also thank M. Stakic for help in the maintenance of the cells and preparation of the samples. This work was supported by the National Institute of Health (NIH) through the grant numbers NIH-8P41GM103540, NIH-RO1 DK066029.
Footnotes
PACS: 87.80.-y (Biophysical techniques (research methods)) 87.64.mk (confocal)
References
- Arhel N, Genovesio A, Kim KA, Miko S, Perret E, Olivo-Marin JC, Shorte S, Charneau P. Quantitative four-dimensional tracking of cytoplasmic and nuclear HIV-1 complexes. Nat Methods. 2006;3:817–24. doi: 10.1038/nmeth928. [DOI] [PubMed] [Google Scholar]
- Betzig E, Patterson GH, Sougrat R, Lindwasser OW, Olenych S, Bonifacino JS, Davidson MW, Lippincott-Schwartz J, Hess HF. Imaging intracellular fluorescent proteins at nanometer resolution. Science. 2006;313:1642–5. doi: 10.1126/science.1127344. [DOI] [PubMed] [Google Scholar]
- Bobroff N. Position measurement with a resolution and noise-limited instrument. Review of Scientific Instruments. 1986;57:1152–1157. [Google Scholar]
- Cang H, Shan Xu C, Yang H. Progress in single-molecule tracking spectroscopy. Chemical Physics Letters. 2008;457:285–291. [Google Scholar]
- Cardarelli F, Lanzano L, Gratton E. Fluorescence correlation spectroscopy of intact nuclear pore complexes. Biophys J. 2011;101:L27–9. doi: 10.1016/j.bpj.2011.04.057. [DOI] [PMC free article] [PubMed] [Google Scholar]
- Cardarelli F, Lanzano L, Gratton E. Capturing directed molecular motion in the nuclear pore complex of live cells. Proc Natl Acad Sci U S A. 2012;109:9863–8. doi: 10.1073/pnas.1200486109. [DOI] [PMC free article] [PubMed] [Google Scholar]
- Cornish PV, Ha T. A survey of single-molecule techniques in chemical biology. ACS Chem Biol. 2007;2:53–61. doi: 10.1021/cb600342a. [DOI] [PubMed] [Google Scholar]
- Dupont A, Lamb DC. Nanoscale three-dimensional single particle tracking. Nanoscale. 2011;3:4532–41. doi: 10.1039/c1nr10989h. [DOI] [PubMed] [Google Scholar]
- Elson EL. Fluorescence correlation spectroscopy: past, present, future. Biophys J. 2011;101:2855–70. doi: 10.1016/j.bpj.2011.11.012. [DOI] [PMC free article] [PubMed] [Google Scholar]
- Fields AP, Cohen AE. Electrokinetic trapping at the one nanometer limit. Proc Natl Acad Sci U S A. 2011;108:8937–42. doi: 10.1073/pnas.1103554108. [DOI] [PMC free article] [PubMed] [Google Scholar]
- Frymier PD, Ford RM, Berg HC, Cummings PT. Three-dimensional tracking of motile bacteria near a solid planar surface. Proc Natl Acad Sci U S A. 1995;92:6195–9. doi: 10.1073/pnas.92.13.6195. [DOI] [PMC free article] [PubMed] [Google Scholar]
- Fujiwara T, Ritchie K, Murakoshi H, Jacobson K, Kusumi A. Phospholipids undergo hop diffusion in compartmentalized cell membrane. J Cell Biol. 2002;157:1071–81. doi: 10.1083/jcb.200202050. [DOI] [PMC free article] [PubMed] [Google Scholar]
- Gelles J, Schnapp BJ, Sheetz MP. Tracking kinesin-driven movements with nanometre-scale precision. Nature. 1988;331:450–3. doi: 10.1038/331450a0. [DOI] [PubMed] [Google Scholar]
- Giral H, Lanzano L, Caldas Y, Blaine J, Verlander JW, Lei T, Gratton E, Levi M. Role of PDZK1 protein in apical membrane expression of renal sodium-coupled phosphate transporters. J Biol Chem. 2011;286:15032–42. doi: 10.1074/jbc.M110.199752. [DOI] [PMC free article] [PubMed] [Google Scholar]
- Han JJ, Kiss C, Bradbury AR, Werner JH. Time-resolved, confocal single-molecule tracking of individual organic dyes and fluorescent proteins in three dimensions. ACS Nano. 2012;6:8922–32. doi: 10.1021/nn302912j. [DOI] [PubMed] [Google Scholar]
- Hellriegel C, Gratton E. Real-time multi-parameter spectroscopy and localization in three-dimensional single-particle tracking. J R Soc Interface. 2009;6(Suppl 1):S3–14. doi: 10.1098/rsif.2008.0313.focus. [DOI] [PMC free article] [PubMed] [Google Scholar]
- Huang B, Wang W, Bates M, Zhuang X. Three-dimensional super-resolution imaging by stochastic optical reconstruction microscopy. Science. 2008;319:810–3. doi: 10.1126/science.1153529. [DOI] [PMC free article] [PubMed] [Google Scholar]
- Juette MF, Bewersdorf J. Three-dimensional tracking of single fluorescent particles with submillisecond temporal resolution. Nano Lett. 2010;10:4657–63. doi: 10.1021/nl1028792. [DOI] [PubMed] [Google Scholar]
- Katayama Y, Burkacky O, Meyer M, Brauchle C, Gratton E, Lamb DC. Real-time nanomicroscopy via three-dimensional single-particle tracking. Chemphyschem. 2009;10:2458–64. doi: 10.1002/cphc.200900436. [DOI] [PMC free article] [PubMed] [Google Scholar]
- Kis-Petikova K, Gratton E. Distance measurement by circular scanning of the excitation beam in the two-photon microscope. Microsc Res Tech. 2004;63:34–49. doi: 10.1002/jemt.10417. [DOI] [PubMed] [Google Scholar]
- Kubitscheck U, Kuckmann O, Kues T, Peters R. Imaging and tracking of single GFP molecules in solution. Biophys J. 2000;78:2170–9. doi: 10.1016/S0006-3495(00)76764-6. [DOI] [PMC free article] [PubMed] [Google Scholar]
- Lanzano L, Digman MA, Fwu P, Giral H, Levi M, Gratton E. Nanometer-scale imaging by the modulation tracking method. J Biophotonics. 2011a;4:415–24. doi: 10.1002/jbio.201100002. [DOI] [PMC free article] [PubMed] [Google Scholar]
- Lanzano L, Gratton E. Measurement of distance with the nanoscale precise imaging by rapid beam oscillation method. Microsc Res Tech. 2012;75:1253–64. doi: 10.1002/jemt.22058. [DOI] [PMC free article] [PubMed] [Google Scholar]
- Lanzano L, Lei T, Okamura K, Giral H, Caldas Y, Masihzadeh O, Gratton E, Levi M, Blaine J. Differential modulation of the molecular dynamics of the type IIa and IIc sodium phosphate cotransporters by parathyroid hormone. Am J Physiol Cell Physiol. 2011b;301:C850–61. doi: 10.1152/ajpcell.00412.2010. [DOI] [PMC free article] [PubMed] [Google Scholar]
- Levi V, Ruan Q, Gratton E. 3-D particle tracking in a two-photon microscope: application to the study of molecular dynamics in cells. Biophys J. 2005;88:2919–28. doi: 10.1529/biophysj.104.044230. [DOI] [PMC free article] [PubMed] [Google Scholar]
- Noda Y, Okada Y, Saito N, Setou M, Xu Y, Zhang Z, Hirokawa N. KIFC3, a microtubule minus end-directed motor for the apical transport of annexin XIIIb-associated Triton-insoluble membranes. J Cell Biol. 2001;155:77–88. doi: 10.1083/jcb.200108042. [DOI] [PMC free article] [PubMed] [Google Scholar]
- Pavani SR, Piestun R. Three dimensional tracking of fluorescent microparticles using a photon-limited double-helix response system. Opt Express. 2008;16:22048–57. doi: 10.1364/oe.16.022048. [DOI] [PubMed] [Google Scholar]
- Rust MJ, Bates M, Zhuang X. Sub-diffraction-limit imaging by stochastic optical reconstruction microscopy (STORM) Nat Methods. 2006;3:793–5. doi: 10.1038/nmeth929. [DOI] [PMC free article] [PubMed] [Google Scholar]
- Schutz GJ, Kada G, Pastushenko VP, Schindler H. Properties of lipid microdomains in a muscle cell membrane visualized by single molecule microscopy. Embo J. 2000;19:892–901. doi: 10.1093/emboj/19.5.892. [DOI] [PMC free article] [PubMed] [Google Scholar]
- Seisenberger G, Ried MU, Endress T, Buning H, Hallek M, Brauchle C. Real-time single-molecule imaging of the infection pathway of an adeno-associated virus. Science. 2001;294:1929–32. doi: 10.1126/science.1064103. [DOI] [PubMed] [Google Scholar]
- Shroff H, Galbraith CG, Galbraith JA, Betzig E. Live-cell photoactivated localization microscopy of nanoscale adhesion dynamics. Nat Methods. 2008;5:417–23. doi: 10.1038/nmeth.1202. [DOI] [PMC free article] [PubMed] [Google Scholar]
- Speidel M, Jonas A, Florin EL. Three-dimensional tracking of fluorescent nanoparticles with subnanometer precision by use of off-focus imaging. Opt Lett. 2003;28:69–71. doi: 10.1364/ol.28.000069. [DOI] [PubMed] [Google Scholar]
- Thompson RE, Larson DR, Webb WW. Precise nanometer localization analysis for individual fluorescent probes. Biophys J. 2002;82:2775–83. doi: 10.1016/S0006-3495(02)75618-X. [DOI] [PMC free article] [PubMed] [Google Scholar]
- Yildiz A, Forkey JN, McKinney SA, Ha T, Goldman YE, Selvin PR. Myosin V walks hand-over-hand: single fluorophore imaging with 1.5-nm localization. Science. 2003;300:2061–5. doi: 10.1126/science.1084398. [DOI] [PubMed] [Google Scholar]


