

Abstract
The placenta is a transient organ that develops upon the initiation of pregnancy and is essential for embryonic development and fetal survival. The rodent placenta consists of distinct lineages and includes cell types that are analogous to those that make up the human placenta. Trophoblast cells within the labyrinth layer, which lies closest to the fetus, fuse and come in contact with maternal blood, thus facilitating nutrient and waste exchange between the mother and the baby. Abnormalities of the placenta may occur as a result of cellular stress and have been associated with pregnancy-associated disorders: such as preeclampsia, intrauterine growth restriction, and placental insufficiency. Cellular stress has also been shown to alter proliferation and differentiation rates of trophoblast cells. This stress response is important for cell survival and ensures continued placental functionality. AMP-activated protein kinase is an important sensor of cellular metabolism and stress. To study the role of AMPK in the trophoblast cells, we used RNA interference to simultaneously knockdown levels of both the AMPK alpha isoforms, AMPKα1 and AMPKα2. SM10 trophoblast progenitor cells were transduced with AMPKα1/2 shRNA and stable clones were established to analyze the effects of AMPK knockdown on important cellular functions. Our results indicate that a reduction in AMPK levels causes alterations in cell morphology, growth rate, and nutrient transport, thus identifying an important role for AMPK in the regulation of placental trophoblast differentiation.
Introduction
The rodent placenta consists of distinct lineages: the trophoblast giant cells, spongiotrophoblast cells, and the labyrinthine cells. Each of these lineages develops from trophoblast stem cells and has analogous cell types in the human placenta [1]. The trophoblast giant cells, which are closest to the maternal decidua, are responsible for the invasion of the maternal blood supply and promote increased blood flow to the developing fetus. The spongiotrophoblast cells provide a source of progenitor cells for the giant cell layer and act as a barrier between the giant cells and the labyrinth. Finally, syncytiotrophoblast cells within the labyrinth, which are closest to the fetus, fuse and come in contact with maternal blood [2]. Through this connection with the blood supply, the labyrinthine cells help transport nutrients, gases, and exchange waste between the mother and the baby [3–5].
Placental abnormalities have been implicated in a number of pregnancy-associated disorders such as preeclampsia, intrauterine growth restriction (IUGR), and placental insufficiency [6–8]. The possible effects of these placental disorders are not restricted to the health of the baby early in life, but can also persist into adulthood. Even minor defects in placentation can have catastrophic effects on pregnancy [9,10]. The ability of trophoblast cells to properly develop is dependent upon the delicate balance of signals that control stem cell proliferation and differentiation.
Recent reports suggest that trophoblast differentiation may be regulated by a stress-activated enzyme, AMPK. AMP-activated protein kinase (AMPK, Prkaa1/2, or hydroxymethylglutaryl-CoA reductase NADPH kinase), is an important, evolutionarily conserved, master regulator of cellular metabolism and reduced levels of AMPK have been shown to be associated with several pathological conditions [11–16]. AMPK is a heterotrimeric serine/threonine kinase that consists of alpha, beta, and gamma subunits [17–20]. The alpha subunit of AMPK is the catalytic subunit and exists in two isoforms depending on the cell type: AMPKα1 and AMPKα2 [21]. When a cell is stressed, which is characterized by an increase in the AMP:ATP ratio, AMPK turns off genes that are involved in energy-consuming anabolic processes and turns on those genes useful in increasing cellular ATP levels [17–23].
AMPK has been shown to be activated in stress-inducing events that lead to early trophoblast differentiation [22,24]. Application of an AMPK inhibitor (compound C) blocked differentiation that would normally occur under cellular stress in trophoblast stem cells [22]. The stress induction of these differentiation events appears to be a normal part of postimplantation, but can be increased in stressful situations [24].
Because of the importance of AMPK in metabolic and stress-related regulation, certain drugs have been designed to activate AMPK, such as AICAR, or inhibit AMPK, such as compound C. While these drugs are effective in manipulating the levels of activated AMPK, they are also known to have off target effects, and therefore are not optimal in studying the role of the enzyme alone [25,26]. Another method of manipulating AMPK is the use of transgenic mice with a targeted knockout of either AMPKα1 or AMPKα2 alleles. Although α1−/− mice and α2−/− knockout mice survive with only some metabolic defects, creation of a double knockout results in embryonic lethality at day 10.5 of gestation [16].
To manipulate both AMPK isoforms, our lab has previously designed an shRNA to knockdown both AMPKα1 and AMPKα2 levels simultaneously [12]. This shRNA sequence is 100% conserved among humans, mice, and rats, and significantly reduces levels of AMPK in transduced cells and functionally inhibits direct targets of AMPK [11–13]. Using this shRNA sequence, the levels of AMPK in trophoblast progenitor cells can be reduced to observe morphological and functional effects.
In this study, the mouse trophoblast progenitor cell line, SM10, was analyzed [27–29]. These cells differentiate into labyrinthine trophoblasts in the presence of physiological concentrations of transforming growth factor-β (TGF-β) [27]. SM10 cells were transduced with lentivirus containing a control shRNA or the AMPKα1/2 shRNA sequence, as previously described, and stable clones were established [12]. These clones were then used to assess cell growth, morphology, glucose uptake, and amino acid transport to determine whether decreased AMPK affects these crucial trophoblast processes.
Materials and Methods
Materials
SM10 cells were cultured in RPMI-1640/l-glutamine medium (Thermo Scientific; SH30027.01) supplemented with 10% nonheat inactivated fetal bovine serum (Biowest; S01520), 1% antibiotic-antimycotic (Thermo Scientific; SV30079.01), 1 mM sodium pyruvate (Mediatech, Inc.; 25-000-CI), and 50 μM β-mercaptoethanol (Thermo Scientific; 35602). 293FT cells were cultured in DMEM/high glucose (Thermo Scientific; SH30022.01), 10% heat-inactivated fetal bovine serum, 1% antibiotic-antimycotic, 1 mM sodium pyruvate, 2 mM glutaGRO Supplement (Mediatech, Inc.; 25-015-CI), 0.1 mM NEAA Mixture (Lonza; 13-114E), and 500 μg/mL G418 (InvivoGen; ant-gn). Polybrene was purchased from Millipore (TR-10003-G). TGF-β2 was a kind gift of Dr. Steve Ledbetter (Genzyme, Inc.). AMPKα1 antibody was purchased from Novus Biologicals (Y365), AMPKα2 antibody was purchased from GeneTex (N1C3), and actin antibody was purchased from Seven Hills Bioreagents (LMAB-C4). Horseradish peroxidase-conjugated secondary antibodies were purchased from Promega (anti-rabbit IgG, W401B; and anti-mouse IgG, W402B). 1× RIPA buffer was purchased from Cell Signaling (No. 9806) and Protease Inhibitor Cocktail Tablets were purchased from Roche (No. 11836153001). Deoxy-d-glucose 2[1,2-3H(N)] (No. ART0103A), leucine L[4,5-3H(N)] (No. ART0140), and methylaminoisobutyric acid [N-methyl-3H] (No. ART0294) were purchased from American Radiolabeled Chemicals. Hoechst dye was obtained from Sigma (No. 33258) and rhodamine-conjugated phalloidin was a kind gift from Dr. Julian Cambronero (Wright State University).
Cell culture and infection
The murine SM10 cell line, kindly provided by Dr. Joan Hunt (U. Kansas Medical Center), was passaged prior to confluency and used before passage 29. Differentiation was induced by treating SM10 cells with 5 ng/mL TGF-β for 72 h [27]. Creation of lentivirus containing the AMPKα1/2 shRNA was performed using the ViraPower Lentiviral Gateway Expression Kit (Invitrogen, K4960-00). 293FT cells were passaged at 80–90% confluency and used before passage 18. Lentiviral production was performed following the manufacturer's suggestions. In short, virus was created by plating 3×10⁶ 293FT cells in 100 mm culture dishes 1 day before transfection. Transfection to make virus was completed by using the ViraPower Lentiviral Gateway Expression Kit and Metafectene (Biontex, T020-1.0). One day after transfection, media was changed. Forty-eight to 60 h after the media change, virus was collected and stored at −80°C. Transduction was performed according to the manufacturer's instructions.
Establishment of clonal cell lines
Seventy-two hours postinfection, SM10 cells were treated with 12 μg/mL of blasticidin (InvivoGen; ant-bl-1) for 14 days until stable pools were established. Cells from stable pools were then plated at 0.5 cells/well in a 96-well plate to generate stable clones that were then expanded and cultured under standard SM10 culture conditions containing blasticidin.
Western blotting
Whole cell lysates were collected when plates were ∼90% confluent in 1× RIPA buffer containing protease inhibitors. Lysates were sonicated on ice for 15 s and protein concentrations were determined using the Bradford method [12,30]. One hundred fifty micrograms of lysates were then boiled in Laemmli buffer and electrophoresed on a 10% sodium dodecyl sulfate polyacrylamide gel electrophoresis (SDS-PAGE) gel [31]. Proteins were transferred to an Immobilon-P Transfer Membrane (Millipore; IPVH00010) and blocked for 1 h in Tris-buffered saline (pH 7.4) containing 0.1% Tween-20 and 5% fat-free dry milk. Both AMPKα1 and α2 primary antibodies were incubated overnight at 4°C at a 1:2,000 dilution in Tris-buffered saline with 0.1% Tween-20 and 5% fat-free dry milk. The actin primary antibody was used at a dilution of 1:20,000 for 1 h at room temperature. Horseradish peroxidase-conjugated secondary antibodies were diluted to 1:25,000, and incubated for 1 h at room temperature. Membranes were developed using Super-Signal West Pico Chemiluminescent Substrate (Thermo Scientific; 34080) and exposed to X-ray film.
Reverse transcription-polymerase chain reaction
Cells were plated at 2×10⁵ cells/p60 and allowed to grow for 24 h. About 5 ng/mL TGF-β was added and cells were treated for 72 h to induce differentiation. RNA was collected by trypsinizing the cells and centrifugation at 2,000 rpm for 5 min at room temperature. Media was removed and RNA was extracted using the RNeasy Kit (Qiagen) following the manufacturer's directions. Reverse transcription was completed using 1 μg of RNA and Accuscript Reverse Transcriptase. Polymerase chain reaction (PCR) was then completed using Taq Polymerase. Briefly, PCR was performed using 2.5 U of Taq polymerase, 1× PCR buffer without MgCl2, 1.8 mM MgCl2, 0.2 mM dNTPs, and 200 nM of gene-specific forward and reverse primers. Around 40 nM of β-actin forward and reverse primers were coamplified in the same reaction as an internal control. Primers specific for Glut1 (forward: 5′-GTCCTATCTGAGCATCGTGG-3′, reverse: 5′-CAAGGTGAAGACTACAGTGTG-3′), Glut3 (forward: 5′-CCTTCTTTGAGATTGGACC-3′, reverse: 5′-CATTGGCGATCTGGTCA-3′), Glut4 (forward: 5′-CCCACAGAAGGTGATTGAAC-3′, reverse: 5′-TGAAGACCGTATTGACCACAC-3′), and beta-actin were used [28]. Denaturation of the DNA was performed for 3 min at 94°C, followed by 35 cycles at 94°C for 30 s, primer annealing at the appropriate Tm for 30 s (Glut1: 55°C, Glut3: 53°C, Glut4: 52°C), and elongation at 68°C for 45 s. Elongation was continued for 10 min at 68°C. The products were then analyzed by agarose gel electrophoresis and DNA detected by ethidium bromide.
Quantitative PCR
mRNA expression was assessed by quantitative PCR (q-PCR) using the SYBR green method as previously described [32,33]. One microgram of total RNA was reverse transcribed using the Quantitect Reverse Transcription Kit for SYBR green q-PCR (Qiagen; No. 205311). PCRs were then prepared using the Quantitect SYBR green PCR kit (Qiagen; No. 204143), according to the manufacturer's instructions, and thermocycling was conducted on an MJ Research, DNA Engine, Opticon2 thermocycler. Primer sequences for glial cells missing homolog 1 (gcm1) and syncytin A (synA) were previously reported [32]. Primers for ID2, Prl3b1 (Pl2), Tpbpa, and Ctsq were obtained from Qiagen (Quantitect Primer Assays, QT00255157, QT00123060, QT01749181, and QT00119707, respectively). Sequences for Proliferin (Plf) primers were as follows: forward, 5′-TGTGTGCAATGAGGAATGGT and reverse, 5′-TAGTGTGTGAGCCTGGCTTG. q-PCRs were conducted in triplicate on cDNA representing three independent experimental replicates for each gene. Peptidylprolyl isomerase A (PPIA) was used as an internal reference gene and data were compiled and analyzed for significant changes in gene expression using the Relative Expression Software Tool (REST) [34]. Significance was determined by Student's t-test, P<0.01.
Glucose and amino acid transport
Glucose and system L amino acid uptake were assayed as previously described [27,35]. Briefly, cells were plated at 1×10⁴ cells in a 24-well plate for use the following day. After overnight growth, media was removed and each well was washed thrice with 1× phosphate-buffered saline (PBS) at 37°C. One milliliter of transport buffer containing 25 mM HEPES, 0.8 mM MgSO4, 140 mM NaCl, and 1.8 mM CaCl2 was warmed to 37°C for each well to be tested. For glucose transport, 1 μCi/mL of [3H]2-deoxyglucose was added to the prewarmed transfer buffer. For analysis of system L amino acid transport, 1 μCi/mL of [3H]leucine was added. Cells were incubated at 37°C for 10 min for glucose or 20 min for leucine. The transport buffer was then removed and each well was washed thrice with ice-cold transport buffer. Cells were resuspended in 600 μL of 0.03% SDS and 400 μL of the suspension was added to 4 mL of Scintiverse II solution (Fisher Scientific). For system A amino acid transport, uptake was assayed as previously described, in transport buffer containing 137 mM NaCl, 2.7 mM KCl, 10.6 mM Na2HPO4, 1.5 mM KH2PO4, 0.49 mM MgCl2, and 0.9 mM CaCl2 [36,37]. Cells were incubated with 1 μCi/mL of α-[3H]methylaminoisobutyric acid (MeAIB) for 20 min at 37°C. Samples were then counted on the tritium channel for 1 min and counts were normalized to total protein concentration.
Phalloidin staining
SM10 cells were plated at 2×10⁵ cells/p60 and allowed to grow for 24 h. The following day the cells were treated with 5 ng/mL TGF-β for 72 h to induce differentiation. The cells were rinsed and fixed with a 4% paraformaldehyde solution in 1× PBS and permeabilized with a solution containing 3% goat serum, 250 mM KCl, 20 mM HEPES, 0.1% glycine, and 0.5% Triton X-100 in 1× PBS for 30 min. After incubation with 6.6 μM rhodamine-conjugated phalloidin in 1× PBS for 1 h, the cells were rinsed in 1× PBS, and incubated with 1 μg/mL of Hoechst dye for 2 min to stain the nuclei [38]. Coverslips were mounted on plates using ClearMount Mounting Solution (Invitrogen; No. 008010) and images were taken by epifluorescence and analyzed with MetaMorph software.
Glut3 immunofluorescence
SM10 cells were plated at 2×10⁵ cells/p60 and allowed to grow for 24 h. The following day, the cells were treated with 5 ng/mL of TGF-β for 72 h to induce differentiation. Cells were fixed in 4% paraformaldehyde/1× PBS, rinsed thoroughly, and permeabilized with a solution containing 0.25% Triton X-100 in 1× PBS for 10 min. Cells were then blocked for 1 h using a 3% BSA solution in 1× PBS and then incubated with a 1:50 dilution of Glut3 primary antibody (Santa Cruz Biotech; sc-7582) for 1 h at room temperature. After thoroughly rinsing with 1× PBS, cells were incubated with fluorochrome-conjugated secondary antibody (Santa Cruz Biotech; No. sc-2024) at a 1:100 dilution for 45 min in the dark and then incubated with 1 μg/mL of Hoechst dye for 2 min to stain nuclei. Coverslips were mounted on plates using ClearMount Mounting Solution (Invitrogen; No. 008010) and images were taken by epifluorescence and analyzed with MetaMorph software.
Statistical analysis
All experiments were performed a minimum of three independent times. Cell growth, glucose, and amino acid uptake experiments were analyzed by one-way ANOVA. Statistical significance was determined as P≤0.05.
Results
Generation of AMPK knockdown clones
To study the effects of AMPK knockdown, SM10 mouse trophoblast progenitor cells were transduced with lentivirus containing the AMPKα1/2 shRNA or the control shRNA sequence containing only five mismatches from the experimental shRNA [12]. The transduced cells were then selected and stable clones were generated. Multiple control shRNA clones were isolated and control shRNA clone B5 was chosen for further experimentation. Two clones containing the AMPKα1/2 shRNA were also selected for further analysis.
To determine the levels of AMPKα1 and AMPKα2 in both the control and knockdown shRNA clones, whole cell lysates were collected and SDS-PAGE performed. Western blotting was performed with AMPKα1, AMPKα2, and actin antibodies (Fig. 1). Wild-type SM10 cells were tested for AMPK levels as a base line for comparison to control B5 and AMPK knockdown clones. The control had AMPKα1 and AMPKα2 levels similar to the wild-type cells, confirming that the control shRNA sequence does not affect AMPK levels. AMPK knockdown clone F6 had a dramatic reduction in protein levels of AMPKα1 and AMPKα2. AMPK knockdown clone A11 also exhibited a reduction of both AMPKα1 and AMPKα2 protein levels, albeit to a lesser extent than clone F6. AMPK knockdown clone F6 was chosen for further experiments, as it demonstrated the highest level of AMPK knockdown.
FIG. 1.

AMPKα1/2 shRNA knockdown in SM10 trophoblast cells. Western blot analysis of whole cell lysates shows wild-type SM10 cells (WT SM10) compared to control shRNA B5 cells (Control B5), and two clonal cell lines infected with AMPKα1/2 shRNA (clones F6 and A11, respectively).
AMPK knockdown inhibits cell growth
To determine whether AMPK knockdown affects cell growth; wild-type, control shRNA B5, and AMPK shRNA knockdown F6 cells were plated at equal cell number. After 72 h in culture, cell number was determined (Fig. 2). The control shRNA clone had total cell numbers similar to wild-type cells, while the AMPKα1/2 knockdown cells had significantly less cell growth (<50%) after the 72-h period compared with the control. There was no evidence of increased cell death (data not shown).
FIG. 2.
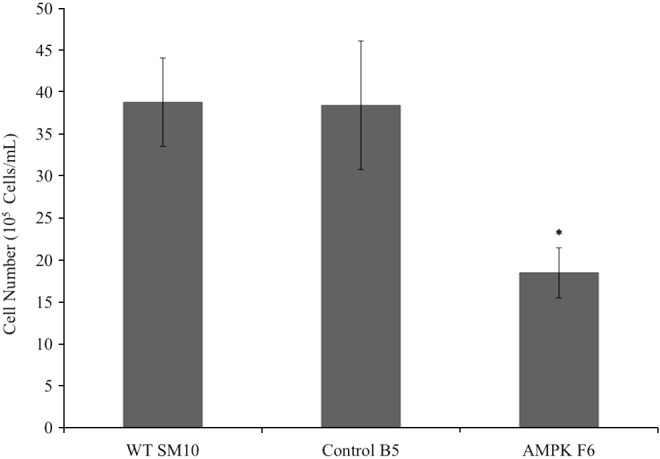
AMPKα1/2 knockdown inhibits cell growth of progenitor cells. The first column shows cell number, indicative of cell growth, in wild-type SM10 cells (WT SM10) compared to SM10 cells infected with the control shRNA clone B5 (Control B5) or AMPKα1/2 shRNA (AMPK F6). Statistical significance is denoted by (*) and has a P value of <0.05.
AMPK knockdown inhibits TGF-β-induced differentiation
To examine the effect of AMPK knockdown on cell morphology; wild-type, control clone B5, and AMPKα1/2 knockdown clone F6 were treated with TGF-β and analyzed after 72 h (Fig. 3). As previously shown, untreated progenitor SM10 cells do not readily form colonies in cell culture but primarily remain as single cells [27] (Fig. 3A). Treatment with TGF-β (Fig. 3B) induces differentiation and dramatic changes in morphology, including an increase in cell size and the formation of epithelial-like colonies, indicative of cell fusion. The control shRNA did not change the ability of TGF-β to induce differentiation (Fig. 3C, D). However, AMPKα1/2 knockdown drastically inhibited colony formation and the cells remained singular, albeit somewhat larger (Fig. 3E, F). Further analysis, using rhodamine-conjugated phalloidin, highlighted the lack of colony formation when comparing the differentiated shRNA control to the AMPKα1/2 shRNA knockdown cells (Fig. 4).
FIG. 3.

AMPKα1/2 shRNA knockdown inhibits colony formation. Bright field analysis of wild-type SM10 cells without (−) transforming growth factor-β (TGF-β) (A) and with (+) TGF-β (B), in the presence of control shRNA clone B5 without TGF-β (C) and with TGF-β (D), or in the presence of AMPKα1/2 shRNA clone F6 without TGF-β (E) and with TGF-β (F).
FIG. 4.

Morphological analysis of AMPKα1/2 knockdown. Phalloidin immunofluorescent staining of SM10 control shRNA (Control B5) and AMPKα1/2 shRNA (AMPK F6) cells with (+) and without (−) the addition of TGF-β after 72 h.
Analysis of trophoblast mRNA expression
To further investigate changes in proliferation and differentiation caused by the knockdown of AMPKα1/2 in SM10 cells, we conducted q-PCR to assess changes in mRNA expression. SM10 cells have previously been shown to express Id2, a marker of undifferentiated trophoblast cells, when maintained in culture conditions supporting proliferation [27,28]. Id2 expression in AMPKα1/2 knockdown F6 cells was reduced in comparison to control shRNA cells, both in proliferating cultures and when stimulated to differentiate by the addition of TGF-β (Fig. 5). Analysis of synA, a marker of differentiated labyrinthine syncytiotrophoblast cells, showed no change in expression in control shRNA or AMPKα1/2 shRNA knockdown cells (Fig. 5) [33]. Other nonlabyrinthine lineage markers; Prl3b1 (Pl2), Tpbpa, Ctsq, and Proliferin (Plf) were not detectable in control shRNA or TGF-β-treated AMPKα1/2 knockdown cells (data not shown).
FIG. 5.
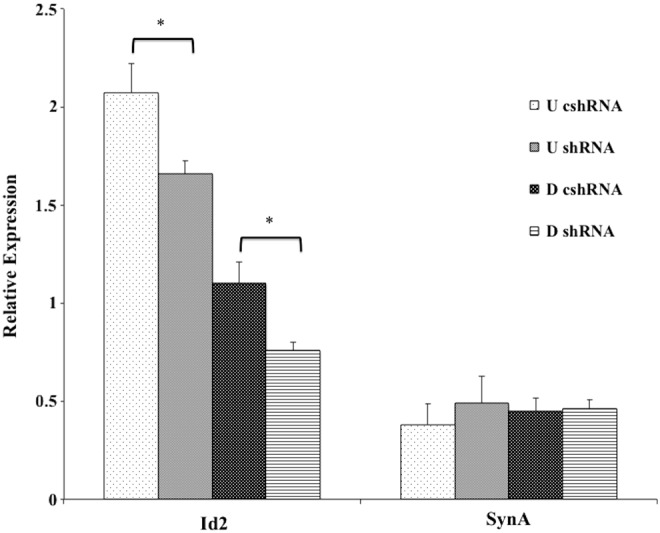
Analysis of progenitor and labyrinthine-specific marker syncytin A (synA) in SM10 cells. mRNA expression of Id2 (progenitor) and labyrinthine-specific marker synA were examined by quantitative polymerase chain reaction (PCR) in undifferentiated (U) and differentiated (D) SM10 cells. SM10 cell clones were cultured in proliferating or differentiating conditions after being infected with shRNA to knockdown AMPKα1/2 shRNA (shRNA, F6) and or control shRNA (cshRNA, B5). Expression levels shown are relative to PPIA. Statistical significance (*) was determined by a P value <0.01.
AMPK knockdown alters placental nutrient transport
Because placental labyrinthine cells are responsible for nutrient transport to the fetus, we determined whether AMPK knockdown affected critical nutrient transport functions. To determine whether AMPK knockdown affects the ability of the labyrinth cells to transport glucose, glucose transport assays were evaluated. In Fig. 6A, in both the progenitor and differentiated states, AMPKα1/2 knockdown cells had significantly less glucose transport when compared with controls. This decrease in glucose transport was more pronounced in the progenitor cells than the differentiated cells. To further determine the mechanism behind the impaired glucose transporter ability, mRNA levels of glucose transporter expression were analyzed via reverse transcription-PCR. Levels of Glut1 were comparable between the control shRNA cells and the AMPKα1/2 knockdown cells (Fig. 6B). Glut4 was not detected in either the control B5 or AMPK F6 SM10 cells. Glut3 mRNA expression, however, was decreased in the AMPKα1/2 knockdown progenitor cells when compared with the control SM10 cells (Fig. 6B, C).
FIG. 6.

AMPK knockdown inhibits glucose transport. (A) Glucose uptake was analyzed in treated (+TGF-β) or untreated (−TGF-β) SM10 cell clones as indicated. Glucose transport was normalized to total protein and reported as pmol/min/ug. Statistical significance (*) was determined by a P value <0.05. (B) GLUT1, GLUT3, and GLUT4 glucose transporter mRNA levels in control shRNA or AMPKα1/2 knockdown cells were determined by reverse transcription-PCR, which was coamplified with β-actin (<), without TGF-β (−) and with TGF-β (+). (C) Relative RNA levels of GLUT3 expression were normalized to β-actin expression. Data were analyzed by densitometry using GIMP software. Statistical significance (*) was determined by a P value <0.0001
Since Glut3 mRNA expression was decreased in AMPK knockdown cells versus controls, immunofluorescence was performed to determine the cellular localization of the GLUT3 transporter. In control cells, the distribution of GLUT3 exhibited a generalized cell surface expression indicative of proper transport (Fig. 7). In AMPKα1/2 knockdown cells, however, Glut3 remained localized near the nucleus, suggesting a reduction in Glut3 transport to the membrane (Fig. 7).
FIG. 7.

AMPK alters Glut3 transporter localization. Glut3 immunofluorescence of SM10 control shRNA (Control B5) and AMPKα1/2 shRNA (AMPK F6) clones with (+) and without (−) the addition of TGF-β after 72 h. Arrows indicate localization of Glut3 near the nucleus.
Because amino acid transport is also a critical function of labyrinthine trophoblast cells, we analyzed system L and system A amino acid transport (Fig. 8A, B). In both the control shRNA cells and AMPKα1/2 knockdown cells, system L transport, treated with or without TGF-β, was not affected (Fig. 8A). Similar to system L, system A transport was not affected in differentiated cells treated with TGF-β in control shRNA or AMPKα1/2 knockdown cells. However, AMPKα1/2 knockdown cells had significantly more system A transport activity in the undifferentiated state when compared with the shRNA control cells (Fig. 8B).
FIG. 8.

Analysis of system L and system A transport. (A) The left two columns show system L transport in SM10 control clone B5 and SM10 AMPKα1/2 clone F6 without TGF-β and the right two columns show these cells in the presence of TGF-β under differentiated conditions. System L and system A uptake was normalized to total protein and reported as pmol/min/μg. (B) The left two columns show system A transport in SM10 control clone B5 and SM10 AMPKα1/2 clone F6 without TGF-β and the right two columns show these cells in the presence of TGF-β under differentiated conditions. System L and system A uptake were normalized to total protein and reported as pmol/min/μg with statistical significance (*) determined by a P value <0.05.
Discussion
In this study, we have demonstrated that simultaneous knockdown of AMPKα1 and α2 subunits in SM10 trophoblast progenitor cells leads to dramatically altered trophoblast morphology and function. The SM10 cell line is derived from the labyrinth layer of the mouse placenta, which is primarily involved in the transport of nutrients, such as glucose and amino acids, between the mother and the growing baby [3–5]. Proper development of the placenta is crucial for maintaining a healthy pregnancy, and abnormal development of the labyrinthine lineage could lead to reduced or altered transport of nutrients, which has been implicated in pregnancy-associated disorders such as preeclampsia, IUGR, and placental insufficiency [5–8].
SM10 cells are proliferative trophoblast progenitor cells that specifically differentiate into the labyrinthine lineage [27]. Their ability to continue to grow and replicate are important in ensuring the placenta is well formed and the flow of nutrients is uninterrupted. Our studies indicate that when AMPKα1/2 expression is reduced in SM10 cells, there is a significant decrease in the rate of cell growth, suggesting an impaired proliferative ability. Since AMPK has been reported to be a critical regulator of cellular metabolism, a reduction in the levels of active AMPKα1/2 may signal cells to stop using energy and remain in a low-energy state [16,39]. A reduction in ATP levels may be responsible for the reduction in cellular growth we observed in the AMPKα1/2 knockdown cells. Our results are also consistent with the work of Awonuga et al. in trophoblast stem cells, which showed that cell stress and altered metabolic capacity of AMPK can lead to defective differentiation [40].
SM10 cells, in the presence of physiological levels of TGF-β, differentiate into mature labyrinthine cells. This study has shown that AMPKα1/2 knockdown leads to a decreased ability of SM10 cells to differentiate and form colonies, indicative of cell fusion. This morphological change is important because proper fusion of the trophoblast cells in the labyrinth allows for enhanced nutrient transport ability. This failure to differentiate properly would lead to a decrease in the ability to transport nutrients from the mother to the fetus in vivo.
Our analysis of gene expression also supports the hypothesis that AMPK is important for regulating cell proliferation and differentiation of SM10 trophoblast cells. q-PCR analysis was consistent with our results that knockdown of AMPKα1/2, in undifferentiated cells, caused a reduction in cell growth accompanied by a significant reduction in Id2 expression (Fig. 5). The expression of synA was unaffected by AMPK knockdown, indicating that lineage specificity was maintained and AMPKα1/2 knockdown did not alter placental lineage. This was further supported by data indicating that lineage-specific markers of other nonlabyrinth trophoblasts were not detectable by q-PCR in SM10 cells. Our data indicate that AMPK is important for cell growth and strongly suggests that AMPK signaling is important both for proliferation and differentiation of labyrinthine trophoblast progenitor cells.
Glucose is the primary source of energy for the growing baby [38]. The fetus has very little gluconeogenic ability and therefore relies on the mother for most of its energy supply [41]. Glucose transport in the placenta occurs via facilitated glucose transporters (GLUTs) [42]. GLUT isoforms 1, 3, and 4 have been reported to be present in the mouse and human placenta and are thought to play an important role in glucose transport ability [41–43]. Glut1 has been found on both the maternal and fetal sides of the rodent placenta and functions to provide glucose for the metabolic needs of these cells [42]. Glut4 has been difficult to isolate in the rodent placenta but can be found in human syncytiotrophoblast, though its role is currently unclear [41]. The Glut3 transporter is primarily located on the fetal side of the placenta, the labyrinthine layer in rodents, and is used to transport glucose from the mother to the fetus [42]. Glut3 has been shown to be reduced in pregnancies with IUGR, while the Glut1 isoform remains unchanged [44,45].
The results of our study indicate that AMPKα1/2 knockdown in SM10 cells leads to a significant reduction in glucose transport ability. This reduction is found in both the progenitor and differentiated trophoblasts, with the progenitor cells displaying a more dramatic difference in transport ability than differentiated cells. Analysis of the mRNA levels of glucose transporters in SM10 cells showed no change in Glut1 but a significant decrease in Glut3 mRNA levels. Our results are consistent with a report indicating that AMPK can phosphorylate the Glut3 transporter and facilitate its movement to the plasma membrane to increase glucose transport in neuronal cells [46].
A reduction in cellular glucose transport can also affect the levels of amino acid transport. Two types of amino acid transport systems have been shown to account for the majority of transport in the placenta: System A and system L [47]. System A facilitates sodium-dependent uptake of nonessential amino acids such as alanine, serine, and glycine [5]. System L is sodium-independent and facilitates transport of neutral and essential amino acids [48]. Our study shows no change in system L transport upon AMPK reduction, but a significant increase in system A transport. This increase in system A is consistent with the work of Ganguly et al., in which they reported a decrease in GLUT3 leads to an increase in system A transport [44,49]. It is possible that this increase in system A transport may be attempting to compensate for the reduction in glucose uptake [47].
In conclusion, our data demonstrate that AMPKα1/2 is an important regulator of SM10 placental cell differentiation and function. It has been shown that stress has the ability to induce markers of differentiation in trophoblast cells and may be important in regular placental differentiation and implantation [24]. Our data indicate AMPKα1/2 as a key regulator of the normal differentiation of placental cells since AMPKα1/2 knockdown in SM10 placental trophoblast cells leads to decreased cell growth, colony formation, and glucose transport ability in progenitor and differentiated labyrinthine cells. Decreased differentiation and nutrient transport have been shown to be associated with several placental disorders, particularly IUGR and placental insufficiency [41,50–52]. Further research on the effects of AMPK in placental abnormalities is currently underway and may help to identify genetic and/or metabolic explanations for pregnancy-associated disorders.
Acknowledgments
We would like to thank Dr. Steve Ledbetter from Genzyme Inc. for providing us with TGF-β2, Dr. Julian Cambronero, Wright State University, for the gift of phalloidin, and Dr. Joan Hunt, University of Kansas, for providing us with the SM10 cell line. Additionally, we would like to thank Bev Grunden and the Statistical Consulting Center at Wright State University for assistance with statistical analysis and Melissa Kaufman for critical analysis of this article. This research was funded in part by NIH grants R01 HD059969 (TLB), R01 HL091836 (CNW), and The Wright State University Endowment for Research on Pregnancy-Associated Disorders (TLB).
Author Disclosure Statement
No competing financial interests exist.
References
- 1.Malassine A, Frendo JL. and Evain-Brion D. (2003). A comparison of placental development and endocrine functions between the human and mouse model. Hum Reprod Update 9:531–539 [DOI] [PubMed] [Google Scholar]
- 2.Coan PM. (2005). Ultrastructual changes in the interhaemal membrane and junctional zone of the murine chorioallantoic placenta across gestation. J Anat 207:783–796 [DOI] [PMC free article] [PubMed] [Google Scholar]
- 3.Cross JC. (2000). Genetic insights into trophoblast differentiation and placenta morphogenesis. Semin Cell Dev Biol 11:105–113 [DOI] [PubMed] [Google Scholar]
- 4.Jansson T, Aye ILMH. and Goberdhan DCI. (2012). The emerging role of mTORC1 signaling in placental nutrient-sensing. Placenta 33:e23–e29 [DOI] [PMC free article] [PubMed] [Google Scholar]
- 5.Lager S. and Powell TL. (2012). Regulation of nutrient transport across the placenta. J Pregnancy Article ID 179827 [DOI] [PMC free article] [PubMed] [Google Scholar]
- 6.Ishihara N, Matsuo H, Murakoshi H, Laoag-Fernandez JB, Samoto T. and Maruo T. (2002). Increased apoptosis in the syncytiotrophoblast in human term placentas complicated by either preeclampsia or intrauterine growth retardation. Am J Obstet Gynecol 186:158–166 [DOI] [PubMed] [Google Scholar]
- 7.Cross JC. (2006). Placental function in development and disease. Reprod Fertil Dev 18:71–76 [DOI] [PubMed] [Google Scholar]
- 8.James JL, Srinivasan S, Alexander M. and Chamley LW. (2014). Can we fix it?. Evaluating the potential of placental stem cells for the treatment of pregnancy disorders. Placenta 35:77–84 [DOI] [PubMed] [Google Scholar]
- 9.Cross JC, Werb Z. and Fisher SJ. (1994). Implantation and the placenta: key pieces of the developmental puzzle. Science 266:1508–1518 [DOI] [PubMed] [Google Scholar]
- 10.Hayes EK, Lechowicz A, Petrik JJ, Storozhuk Y, Paez-Parent S, Dai Q, Samjoo IA, Mansell M, Gruslin A, Holloway AC. and Raha S. (2012). Adverse fetal and neonatal outcomes associated with a life-long high fat diet: role of altered development of the placental vasculature. PLoS One 7:e33370. [DOI] [PMC free article] [PubMed] [Google Scholar]
- 11.Hardie DG, Ross FA. and Hawley SA. (2012). AMPK: a nutrient and energy sensor that maintains energy homeostasis. Nat Rev Mol Cell Biol 13:251–262 [DOI] [PMC free article] [PubMed] [Google Scholar]
- 12.Tangeman L, Wyatt CN. and Brown TL. (2012). Knockdown of AMP-activated protein kinase alpha 1 and alpha 2 catalytic subunits. J RNAi Gene Silencing 8:470–478 [PMC free article] [PubMed] [Google Scholar]
- 13.Hardie GD. (2007). AMP-activated/SNF1 protein kinases: conserved guardians of cellular energy. Nature 8:774–785 [DOI] [PubMed] [Google Scholar]
- 14.Mungai PT, Waypa GB, Jairaman A, Prakriya M, Dokic D, Ball MK. and Schumacker PT. (2011). Hypoxia triggers AMPK activation through reactive oxygen species-mediated activation of calcium release-activated calcium channels. Mol Cell Biol 31:3531–3545 [DOI] [PMC free article] [PubMed] [Google Scholar]
- 15.Steinberg GR. and Kemp BE. (2009). AMPK in health and disease. Physiol Rev 89:1025–1078 [DOI] [PubMed] [Google Scholar]
- 16.Viollet B, Athea Y, Mounier R, Guigas B, Zarrinpashneh E, Horman S, Lantier L, Hebrard S, Devin-Leclerc J, et al. (2009). AMPK: lessons from transgenic and knockout animals. Front Biosci 14:19–44 [DOI] [PMC free article] [PubMed] [Google Scholar]
- 17.Evans MA, Mustard KJ, Wyatt CN, Peers C, Dipp M, Kumar P, Kinnear NP. and Hardie DG. (2005). Does AMP-activated protein kinase couple inhibition of mitochondrial oxidative phosphorylation by hypoxia to calcium signaling in O2-sensing Cells?. J Biol Chem 280:41404–41511 [DOI] [PubMed] [Google Scholar]
- 18.Wyatt CN, Mustard KJ, Pearson SA, Dalas ML, Atkison L, Kumar P, Peers C, Hardie DG. and Evans AM. (2007). AMPK-activated protein kinase mediates carotid body excitation by hypoxia. J Biol Chem 282:8092–8098 [DOI] [PMC free article] [PubMed] [Google Scholar]
- 19.Peyton KJ, Liu X, Yu Y, Yates B. and Durante W. (2012). Activation of AMP-activated protein kinase inhibits the proliferation of human endothelial cells. J Pharmacol Exp Ther 342:827–834 [DOI] [PMC free article] [PubMed] [Google Scholar]
- 20.Hardie GD. (2007). Ampk and Snf1: snuffing out stress. Cell Metab 6:339–340 [DOI] [PMC free article] [PubMed] [Google Scholar]
- 21.Shirwany NA. and Zou MH. (2014). AMPK: a cellular metabolic and redox sensor. A minireview. Front Biosci (Landmark Ed) 19:447–474 [DOI] [PMC free article] [PubMed] [Google Scholar]
- 22.Zhong W, Xie Y, Abdallah M, Awonuga AO, Slater JA, Sipahi L, Puscheck EE, and Rappolee DA. (2010). Cellular stress causes reversible, PRKAA1/2-, and proteasome-dependent ID2 protein loss in trophoblast stem cells. Reproduction 140:921–930 [DOI] [PMC free article] [PubMed] [Google Scholar]
- 23.Lee M, Hwang JT, Lee HJ, Jung SN, Kang I, Chi SG, Kim SS. and Ha J. (2003). AMPK-activated protein kinase activity is critical for hypoxia-inducible factor-1 transcriptional activity and its target gene expression under hypoxic conditions in DU145 cells. J Biol Chem 278:39653–39661 [DOI] [PubMed] [Google Scholar]
- 24.Liu J, Xu W, Sun T, Wang F, Puscheck EE, Brigstock D, Wang QT, Davis R. and Rappolee DA. (2009). Hyperosmolar stress induces global mRNA responses in placental trophoblast stem cells that emulate early post-implantation differentiation. Placenta 30:66–73 [DOI] [PMC free article] [PubMed] [Google Scholar]
- 25.Guigas B, Taleux N, Foretz M, Detaille D, Andrellii F, Viollet B. and Hue L. (2007). Amp-activated protein kinase-independent inhibition of hepatic mitochondrial oxidative phosphorylation by AICA riboside. Biochem J 404:499–507 [DOI] [PMC free article] [PubMed] [Google Scholar]
- 26.Harno E, Cottrell EC, Yu A, DeSchoolmeester J, Gutierrez PM, Denn M, Swales JG, Goldberg FW, Bohlooly YM, et al. (2013). 11β-Hydroxysteroid dehydrogenase type 1 (11β-HSD1) inhibitors still improve metabolic phenotype in male 11β-HSD1 knockout mice suggesting off-target mechanisms. Endocrinology 154:4580–4589 [DOI] [PMC free article] [PubMed] [Google Scholar]
- 27.Selesniemi K, Reedy M, Glutice A, Guilbert LJ. and Brown TL. (2005). Transforming growth factor-β induces differentiation of the labyrinthine trophoblast stem cell line SM10. Stem Cells Dev 14:697–711 [DOI] [PubMed] [Google Scholar]
- 28.Selesniemi KL, Reedy MA, Glutice AD. and Brown TL. (2005). Identification of committed placental stem cell lines for studies of differentiation. Stem Cells Dev 14:535–547 [DOI] [PubMed] [Google Scholar]
- 29.Sharma RK. (1998). Mouse trophoblastic cell lines: I—relationship between invasive potential and TGF-beta 1. In Vivo 12:431–440 [PubMed] [Google Scholar]
- 30.Bradford MM. (1976). A rapid and sensitive method for the quantitation of microgram quantities of protein utilizing the principle of protein-dye binding. Anal Biochem 72:248–254 [DOI] [PubMed] [Google Scholar]
- 31.Laemmli UK. (1970). Cleavage of structural proteins during the assembly of the head of bacteriophage T4. Nature 227:680–685 [DOI] [PubMed] [Google Scholar]
- 32.Watson ED, Hughes M, Simmons DG, Natale DR, Sutherland AE. and Cross JC. (2011). Cell-cell adhesion defects in Mrj mutant trophoblast cells are associated with failure to pattern the chorion during early placental development. Dev Dyn 240:2505–2519 [DOI] [PubMed] [Google Scholar]
- 33.Hughes M, Natale BV, Simmons DG. and Natale DR. (2013). Ly6e expression is restricted to the syncytiotrophoblast cells of the mouse placenta. Placenta 34:831–835 [DOI] [PubMed] [Google Scholar]
- 34.Pfaffl MW, Horgan GW. and Dempfle L. (2002). Relative expression software tool (REST©) for group-wise comparison and statistical analysis of relative expression results in real-time PCR. Nucleic Acids Res 30:e36. [DOI] [PMC free article] [PubMed] [Google Scholar]
- 35.Ogura K, Sakata M, Yamaguchi M, Kurachi H. and Murata Y. (1999). High concentration of glucose decreases glucose transporter-1 expression in mouse placenta in vitro and in vivo. J Endocrinol 160:443–452 [DOI] [PubMed] [Google Scholar]
- 36.Su TZ, Campbell GW. and Oxender DL. (1997). Glutamine transport in cerebellar granule cells in culture. Brain Res 757:69–78 [DOI] [PubMed] [Google Scholar]
- 37.Su TZ, Wang M, Oxender DL. and Saltiel AR. (1998). Troglitazone increases system A amino acid transport in 3T3-L1 cells. Endocrinology 139:832–837 [DOI] [PubMed] [Google Scholar]
- 38.Gultice AD, Kulkarni-Datar K. and Brown TL. (2009). Hypoxia-inducible factor 1 alpha mediates distinct steps of rat trophoblast differentiation in gradient oxygen. Biol Reprod 80:184–193 [DOI] [PMC free article] [PubMed] [Google Scholar]
- 39.Carling D, Sanders MJ. and Woods A. (2008). The regulation of AMP-activated protein kinase by upstream kinases. Int J Obes (Lond) 32:S55–S59 [DOI] [PubMed] [Google Scholar]
- 40.Awonuga AO, Zhong W, Abdallah ME, Slater JA, Zhou SC, Xie YF, Puscheck EE. and Rappolee DA. (2011). Eomesodermin, HAND1 and CSH1 proteins are induced by cellular stress in a stress-activated protein kinase-dependent manner. Mol Reprod Dev 78:519–528 [DOI] [PMC free article] [PubMed] [Google Scholar]
- 41.Ericsson A, Hamark B, Powell TL. and Jansson T. (2005). Glucose transporter isoform 4 is expressed in the syncytiotrophoblast of first trimester human placenta. Hum Repord 20:521–530 [DOI] [PubMed] [Google Scholar]
- 42.Boileau P, Mrejen C, Girard J. and Hauguel-de Mouzon S. (1995). Overexpression of GLUT3 placental glucose transporter in diabetic rats. J Clin Invest 96:309–317 [DOI] [PMC free article] [PubMed] [Google Scholar]
- 43.Lesage J, Hahn D, Leonhardt M, Blondeau B, Breant B. and Dupouy JP. (2002). Maternal undernutrition during late gestation-induced intrauterine growth restriction in the rat is associated with impaired placental GLUT3 expression, but does not correlate with endogenous corticosterone levels. J Endocrinol 174:37–43 [DOI] [PubMed] [Google Scholar]
- 44.Ganguly A, McKnight RA, Raychaudhuri S, Shin B, Ma Z, Moley K. and Devaskar SU. (2007). Glucose transporter isoform-3 mutations cause early pregnancy loss and fetal growth restriction. Am J Physiol Endocrinol Metab 292:E1241–E1255 [DOI] [PubMed] [Google Scholar]
- 45.Jansson T, Ylven K, Wennergren M. and Powell TL. (2002). Glucose transport and system A activity in syncytiotrophoblast microvillous and basal plasma membranes in intrauterine growth restriction. Placenta 23:392–399 [DOI] [PubMed] [Google Scholar]
- 46.Weisová P, Concannon CG, Devocelle M, Prehn JH. and Ward MW. (2009). Regulation of glucose transporter 3 surface expression by the AMP-activated protein kinase mediates tolerance to glutamate excitation in neurons. J Neurosci 29:2997–3008 [DOI] [PMC free article] [PubMed] [Google Scholar]
- 47.Avagliano L, Garo C. and Marconi AM. (2012). Placental amino acids transport in intrauterine growth restriction. J Pregnancy Article ID 972562. [DOI] [PMC free article] [PubMed] [Google Scholar]
- 48.Chrostowski MK, McGonnigal BG, Stabila JP. and Padbury JF. (2010). Role of the L-amino acid transporter-1 (LAT-1) in mouse trophoblast cell invasion. Placenta 31:528–534 [DOI] [PMC free article] [PubMed] [Google Scholar]
- 49.Ganguly A, Collis L. and Devaskar SU. (2012). Placental glucose and amino acid transport in calorie-restricted wild-type and GLUT3 null heterozygous mice. Endocrinology 153:3995–4007 [DOI] [PMC free article] [PubMed] [Google Scholar]
- 50.Simmons DG, Natale DR, Begay V, Hughes M, Leutz A. and Cross JC. (2008). Early patterning of the chorion leads to the trilaminar trophoblast cell structure in the placental labyrinth. Development 135:2083–2091 [DOI] [PMC free article] [PubMed] [Google Scholar]
- 51.Glazier JD, Sibley CP. and Carter AM. (1996). Effect of fetal growth restriction on system A amino acid transporter activity in the maternal facing plasma membrane of rat sybcytiotrophoblast. Pediatr Res 40:325–329 [DOI] [PubMed] [Google Scholar]
- 52.Glazier JD, Cetin I, Perugino G, Ronzoni S, Grey AM, Mahendran D, Marconi AM, Pardi G. and Sibley C. (1997). Association between the activity of the system A amino acid transporter in the microvillous plasma membrane of the human placenta and severity of fetal compromise in intrauterine growth restriction. Pediatr Res 42:514–519 [DOI] [PubMed] [Google Scholar]