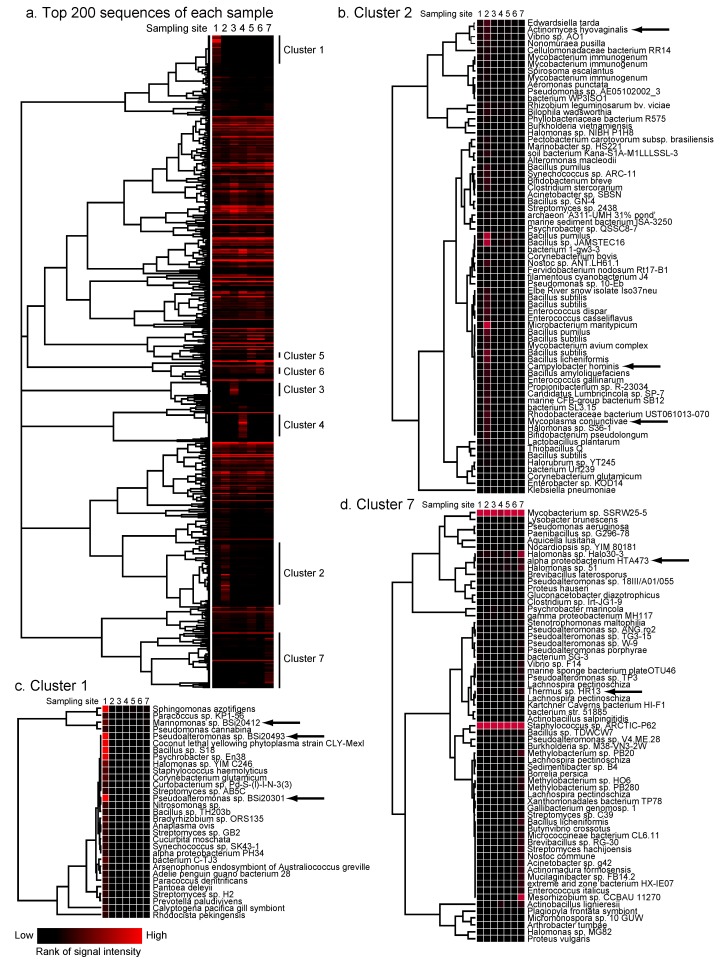
Figure 3.
Cluster analysis of sequences detected on the microarray. Sequences with the top 200 signal intensities in each sample were selected. The rank of the signal intensity in each microarray was changed to the reciprocal number, analyzed with Cluster 3.0, and visualized using Treeview 1.0. (a) The clusters that exhibited specific, strong signals only in one of the sampling sites 1 to 7 are marked as clusters 1 to 7. The detail of clusters 2 (b), 1 (c) and 7 (d) are shown with species names. Species indicated by arrows are the characteristic types in each cluster.

