

Abstract
The goals of the present study are to establish an in vitro co-culture model of osteoblast and osteoclast function and to quantify the resulting bone remodeling. The bone is tissue engineered using well-defined silk protein biomaterials in 2D and 3D formats in combination with human cells expressing tethered agonists for selected G protein-coupled receptors (GPCRs). The tethered constructs are introduced with the objective of triggering sustained and localized GPCR signaling. The cell-modified biomaterial surfaces are reconstructed from SEM images into 3D models using image processing for quantitative measurement of surface characteristics. Parathyroid hormone (PTH) and glucose-dependent insulinotropic peptide (GIP) are selected because of their roles in bone remodeling for expression in tethered format on bone marrow derived human mesenchymal stem cells (hMSCs). Increased calcium deposition and increased surface roughness are found in 3D digital surface models constructed from SEM images of silk protein films remodeled by the co-cultures containing the tethered PTH, and decreased surface roughness is found for the films remodeled by the tethered GIP co-cultures. Increased surface roughness is not found in monocultures of hMSCs expressing tethered PTH, suggesting that osteoclast-osteoblast interactions in the presence of PTH signaling are responsible for the increased mineralization. These data point towards the design of in vitro bone models in which osteoblast-osteoclast interactions are mimicked for a better understanding of bone remodeling.
Keywords: biomineralization, biomedical applications, characterization tools, tissue engineering
1. Introduction
Most studies related to bone tissue engineering in vitro focus on maximizing bone matrix deposition on tissue culture plastic or assess various 3D biomaterial scaffolds with osteoblastic cell lines or differentiated stem cells.[1–3] However, bone is a dynamic tissue characterized by constant remodeling in vivo. Bone formation by osteoblasts and resorption by osteoclasts are tightly coupled so that microfractures sustained during normal activity are repaired and bone size, morphology, and mechanical properties are maintained.[4] When serum estrogen begins to decrease with age, osteoclast activity is increased.[5] If osteoblast activity is not sufficient to replace bone loss, osteoporosis may occur, which can lead to fractures, decreased quality of life and permanent disability.[6] As the population ages, a better understanding of this disease is essential as all current therapies to treat the disease symptoms present significant limitations. These therapies include the bisphosphonates which may lead to rare side effects such as jaw necrosis and atypical fractures.[7] Recombinant parathyroid hormone (PTH) carries a black box warning regarding carcinogenic potential and thus can only be used for short-term treatments.[8] Calcium supplementation can increase the risk of cardiac events.[9] As a result of these serious limitations with current osteoporosis therapeutics there is significant disagreement in the field regarding which patients should be treated.[10,11] Despite attempts to predict fracture risk, uncertainty remains regarding which patients would benefit from therapy.[11] This uncertainty necessitates a better understanding of osteoporosis and options for new therapeutic paths.
Since osteoporosis is a disease in which healthy osteoblast-osteoclast coupling is altered, both cell types are necessary in an in vitro osteoporosis human tissue model. In vivo, osteoblasts differentiate from mesenchymal stem cells, which are fibroblastic stem cells capable of differentiation into a variety of tissue types.[12] Osteoclasts differentiate from macrophages into multinucleated cells capable of secreting enzymes that degrade bone.[13] While some studies have incorporated osteoclasts into bone tissue models, this co-culture approach remains relatively rare.[14]
In order to modify the remodeling behavior of hMSCs differentiated to osteoblasts and THP-1 cells differentiated to osteoclasts, tethered constructs which incorporate ligands known to alter bone metabolism were selected for the study. Tethered ligands have been used previously to study the effects of signaling on biological systems.[15–17] Lentiviral transduction was used to express tethered ligands on the surface of undifferentiated hMSCs with the goal of studying how perturbations in receptor mediated signaling alter matrix remodeling. Lentivirus infects cells in dividing and non-dividing states, and expression is maintained in progeny cells out to at least five months.[18] Transduced hMSCs maintain differentiation potential and are suitable for long-term culture.[19] The use of tethered ligands avoids transport limitations associated with 3D scaffolds as well as providing more consistent dosing in both 2D and 3D while also maintaining ligands in close proximity to receptors for efficient binding.[20]
The ligands selected to alter bone remodeling in this study were parathyroid hormone and glucose-dependent insulinotropic peptide (GIP). PTH was initially believed to have a simple role in bone metabolism limited to maintaining blood calcium homeostasis. However, it has since been found to interact with bone cells in a variety of ways, including regulation of bone differentiation transcription factors, decreased synthesis of bone matrix proteins, [21] and increased synthesis of resorptive agents.[22] In addition, the timing and duration of PTH exposure, along with other factors, have been found to determine whether a predominately anabolic or catabolic response will result. While PTH is not a direct cause of osteoporosis, the sustained high levels of the hormone present during menopause have been linked to the pathology. At the same time, recombinant PTH is used as an osteoporosis therapy when given as a bolus. Glucose-dependent insulinotropic peptide (GIP) is also involved in the balance of osteoblast and osteoclast activity. GIP is secreted immediately following ingestion of food. Receptors for GIP are present in osteoblasts and osteoclasts, and GIP is implicated in the transient altering of bone formation/resorption dynamics that occurs following food ingestion when osteoclast activity is diminished.[23]
For this study, transduced hMSCs were cultured alone or with THP-1 derived osteoclasts on silk protein biomaterials. A wide variety of biomaterials have been used in bone tissue engineering. Ceramics are frequently used because their stiffness is conducive to osteogenic differentiation.[24] Polymers have also been modified in a variety of ways to enhance bone differentiation.[25,26] Specifically, silk protein has been used as a biomaterial for osteogenesis, with and without modifications to enhance osteogenesis.[27–30] Modified materials are helpful for generating implantable bone, while allowing cells to form their own matrix can provide a more useful approach to gain improved insight into osteogenesis.
Quantifying bone matrix remodeling in tissue-engineered systems is challenging because of the variety of length scales that need to be characterized, from micron-sized deposits of mineralization to millimeter-sized engineered bone constructs. A variety of tools, from analytical chemistry to atomic force microscopy (AFM) are often used to assess bone remodeling. Colorimetric detection of calcium is a useful standard analytical tool, however this assay provides no information about surface morphology. Surface morphology is an important aspect of bone remodeling in vitro since changes in bone morphology are hallmarks of bone diseases and bone remodeling is regulated in part by highly localized cues.[31] AFM is time-intensive and limited to small areas of about 150 μm2 per scan, while features such as steep walls cannot typically be measured. Mechanical profilometry is limited to single lines rather than areas and scanning electron microscopy (SEM) provides qualitative comparisons of remodeling activity. However, surface roughness and feature heights can not be quantified from standard 2D SEM images. MeX surface metrology software allows a digital 3D model of the surface to be generated from SEM images taken at any magnification for subsequent surface metrology of individual features or large areas.[32–34]
The objectives of the present study were to perturb matrix remodeling by osteoblasts and osteoclasts in a tissue engineered human bone model, and to quantify the differences in remodeling based on 3D surface changes from SEM images. In the long term, we anticipate that quantitative insights into the role of selective cells and cell combinations in bone remodeling should provide improved utility for in vitro tissue systems to assess new therapeutic strategies to address bone-related diseases.
2. Results
2.1. Study design
The study procedure is outlined in Figure 1. In all cases, hMSCs were transduced on day -2 at passage 1 to express green fluorescent protein (GFP) as a control, or tethered GIP (tGIP) or tethered PTH (tPTH). Day 0 was the point at which hMSCs were seeded on films, sponges, or tissue culture plastic in the presence (co-culture) or absence (monoculture) of THP-1 cells. Differentiation was then initiated. Sponges were assayed for surface metrology at 5 weeks. Cells grown on tissue culture plastic were assayed for calcium deposition at 2 weeks and surface metrology was performed on films at 3 weeks.
Figure 1.
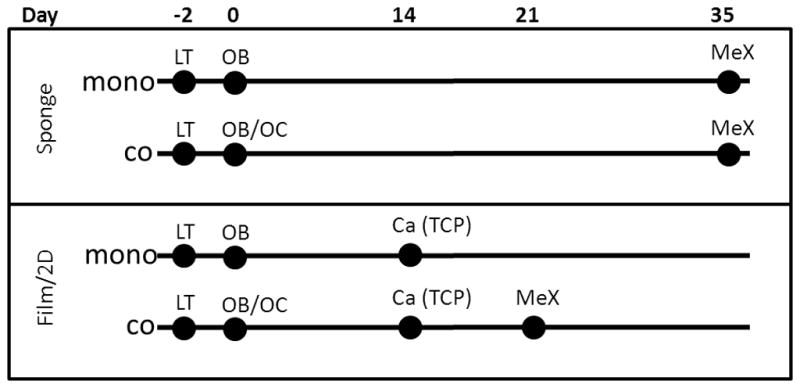
Schematic of experimental time course. Lentiviral transduction (LT) of hMSCs for the expression of tethered ligands occurred on day −2. On day 0 cells were seeded on silk films and sponges and differentiation was initiated. For the monoculture condition hMSCs were seeded and differentiated to osteoblasts (OB). For the co-culture condition THP-1 cells were also seeded and differentiated to osteoclasts (OB/OC). MeX surface metrology was performed at 5 weeks on sponges. 2D cultures on tissue culture plastic (TCP) were analyzed for calcium deposition at 2 weeks and surface metrology was performed at on films at 3 weeks.
2.2. myc tag and EGFP expression
A myc tag was included in the tethered constructs but not in the GFP control construct. Immunocytochemistry of non-permeabilized transduced hMSCs demonstrated the presence of the extracellular myc tag in cells expressing tPTH as shown in Figure 2a. GFP is present throughout the cells (left), but myc tag staining is localized to the plasma membrane (right). ELISA for myc tag expression demonstrated presence of the myc tag in hMSCs transduced to express tGIP and tPTH, but not in mock transduction controls or hMSCs transduced to express GFP as shown in Figure 2b. The enhanced green fluorescent protein (EGFP) sequence included in the tGIP and tPTH constructs differed from the GFP sequence in the GFP control, permitting qPCR for EGFP specific to the tethered constructs. EGFP was present in hMSCs transduced to express tGIP and tPTH, but not in hMSCs transduced to express GFP or in hMSCs differentiated to osteoblasts as shown in Figure 2c.
Figure 2.

Verification of the expression of tethered ligands. (a) Immunocytochemistry for the myc tag. Overlay with DAPI and GFP (left) and single channel (right). (b) ELISA for the myc tag. (c) qPCR for the EGFP sequence of the tethered ligands. ***p<0.001, error bar is mean ± SD.
2.3. Endogenous ligand and receptor expression
Endogenous expression of GIP, PTH, and their receptors in both cell types was tested by quantitative real time polymerase chain reaction (qPCR). GIP and PTH did not amplify by cycle 30 in either hMSC osteoblasts or THP-1 osteoclasts, suggesting minimal to absent endogenous GIP or PTH in this model. The PTH receptor amplified at cycle 23.64 +/− 0.22 in hMSC osteoblasts, and the GIP receptor amplified at cycle 26.44 +/− 0.33 in THP-1 osteoclasts.
2.4. Calcium deposition
Calcium deposition by GFP and tPTH expressing hMSCs was measured in monocultures and co-cultures cultured on tissue culture plastic at two weeks, the timepoint at which pilot studies suggested that calcium deposition is reliably detectable (Figure 3). Calcium deposition was not significantly different between monocultures of hMSCs expressing GFP or tPTH, but calcium deposition by co-cultured hMSCs expressing tPTH was increased 1.76-fold with a p value of 0.0007 compared with co-cultured hMSCs expressing GFP.
Figure 3.
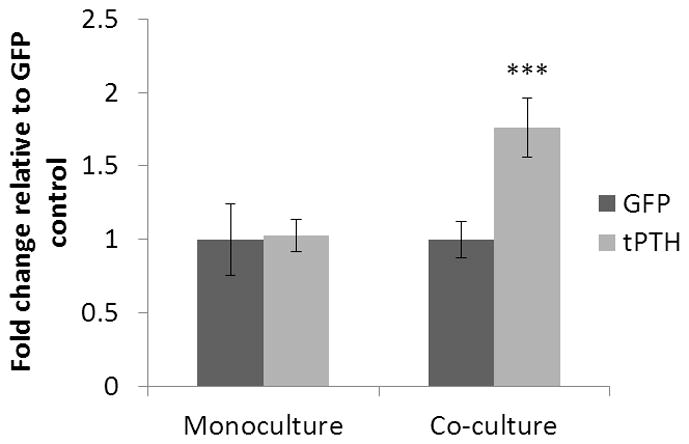
Calcium deposition in monoculture and co-culture. Calcium deposition was determined by cresolphthalein complexone methodology at two weeks by hMSCs transduced to express GFP or tPTH and differentiated to osteoblasts in monoculture or co-cultured with THP-1 osteoclasts. ***p<0.001, error bar is mean ± SD.
2.5. Surface metrology of films
150 μm by 100 μm surfaces were reconstructed from the silk films remodeled in culture for three weeks (Figure 4). While calcium is detectable by colorimetric assay at 2 weeks in this system, more significant mineralization is necessary for MeX analysis. For each of the surface roughness parameters (average height, RMS height, RMS gradient, developed interfacial area ratio, maximum peak height, maximum valley depth, maximum height, and ten point height), the films remodeled by tPTH co-cultures had the highest means and films remodeled by tGIP co-cultures had the lowest means. Films remodeled by GFP control co-cultures had the highest means for skewness (more points above the reference plane than below) and kurtosis (most outliers), while films remodeled by tGIP co-cultures had the lowest means.
Figure 4.
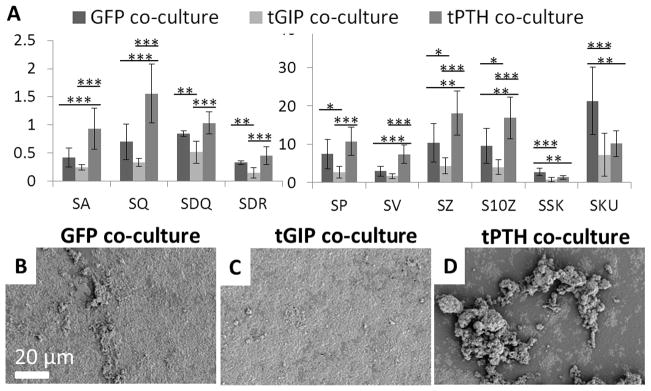
Surface roughness of silk films remodeled in co-culture. Films were remodeled for three weeks by hMSCs transduced to express GFP, tethered GIP, or tethered PTH in co-culture with THP-1 cells differentiated to osteoclasts. (a) SA - average height (μm), SQ - RMS height (μm), SDQ - RMS gradient, and SDR - developed interfacial area ratio, SP - maximum peak height (μm), SV - maximum valley depth (μm), SZ - maximum height (μm), S10Z - ten point height (μm), SSK – skewness, SKU – kurtosis, *p<0.05, **p<0.01, ***p<0.001, error bar is mean ± SD. (b, c, d) Representative SEM images of GFP, tGIP, and tPTH films.
2.6. Surface metrology of sponges
150 μm by 100 μm surfaces were reconstructed from porous aqueous silk sponges remodeled in co-culture for five weeks (Figure 5). The large surface area of the sponges requires longer remodeling time. For each of the surface roughness parameters the sponges remodeled by the tGIP co-cultures had the lowest means. Sponges remodeled by GFP control co-cultures and those remodeled by tPTH co-cultures had similar values for surface roughness parameters. Sponges remodeled by tGIP co-cultures had the highest mean kurtosis, while sponges remodeled by GFP control co-cultures and tPTH co-cultures had similar kurtosis values.
Figure 5.
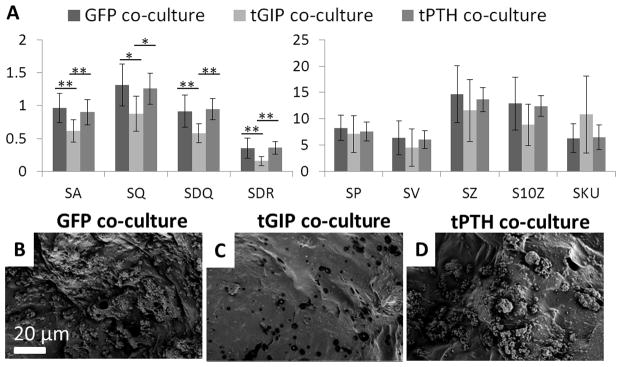
Surface roughness of silk sponges remodeled in co-culture. Sponges were remodeled for five weeks by hMSCs transduced to express GFP, tethered GIP, or tethered PTH in co-culture with THP-1 cells differentiated to osteoclasts. (a) Roughness parameters (see Figure 4) *p<0.05, **p<0.01, ***p<0.001, error bar is mean ± SD. (b, c, d) Representative SEM images of GFP, tGIP, and tPTH co-culture sponges.
Similarly, surfaces were reconstructed from silk sponges remodeled in monoculture for five weeks (Figure 6). For most surface roughness parameters (average height, RMS height, RMS gradient, developed interfacial area ratio, and maximum valley depth), the sponges remodeled by tGIP monocultures had the highest means.
Figure 6.
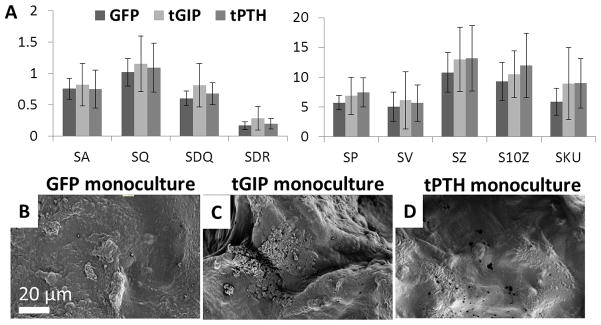
Surface roughness of silk sponges remodeled in monoculture. Sponges were remodeled for five weeks by hMSCs transduced to express GFP, tethered GIP, or tethered PTH in monoculture. (a) Roughness parameters (see Figure 4), error bar is mean ± SD. (b, c, d) Representative SEM images of GFP, tGIP, and tPTH monoculture sponges.
3. Discussion
We have previously shown that silk supports long-term tissue engineering of bone and that silk biomaterials can be used to study bone remodeling. Silk sponges were used for bone tissue engineering alone and with hMSCs in vivo in mouse, rat, and dog models, as well as to study cancer metastasis and osteoarthritis.[28,29,35–38] We have also studied the degradation of bone on silk films by osteoclasts in vitro.[39] In all of these prior studies, the silk-bone systems have proven to be relevant model systems for studying human bone formation and function. In the present study we used tethered ligands to modulate the remodeling behavior of hMSCs differentiated to osteoblasts and THP-1 cells differentiated to osteoclasts. To explore the effects of tethered agonists on bone remodeling in vitro we compared overall roughness parameters as well as localized patterns of matrix remodeling.
Calcium assays and 3D digital surface models generated from SEM images were used to quantitatively examine surface remodeling and quantify differences in roughness parameters in addition to total deposited calcium. We demonstrated similar trends with 2D silk films and 3D porous aqueous silk sponges, with improved quantification in the 2D silk film model. This improved quantification is probably because silk films are more uniform in size, surface area, and cell seeding, resulting in less variation between samples. Additionally, silk films provide a flat surface upon which cells deposit a 3D matrix, resulting in reduced measurement error. While 3D scaffolds are preferable to 2D cultures because of their similarity to the in vivo environment, silk films support remodeling throughout long term cultures resulting in a cell-generated psuedo-3D environment.
Different effects were found for tPTH expression on calcium deposition depending on whether the tPTH-expressing hMSC osteoblasts were in co-cultures with THP-1 osteoclasts. Osteoblasts and osteoclasts are normally tightly coupled so that matrix deposition and resorption are balanced.[31] Because of this coupling it is not unexpected that monocultures and co-cultures displayed different effects in terms of calcium deposition and surface remodeling. If osteoclasts are present, PTH increases RANKL expression by osteoblasts, resulting in increased osteoclast differentiation, survival, and activity.[40] The resulting increase in matrix resorption triggers the release of insulin-like growth factor 1 (IGF-1) and transforming growth factor β 1 (TGF-β1) which in turn couples matrix formation to resorption.[31] Increased expression of RANKL by osteoblasts has also been shown to result in production of Semaphorin-4D by osteoclasts, which regulates osteoblast differentiation.[41] We suspect that in co-culture these feedback mechanisms were responsible for increased overall calcium deposition as shown in Figure 7. In the absence of osteoclasts, osteoclast-dependent RANKL-mediated increase in osteoblast activity will not occur.[42]
Figure 7.
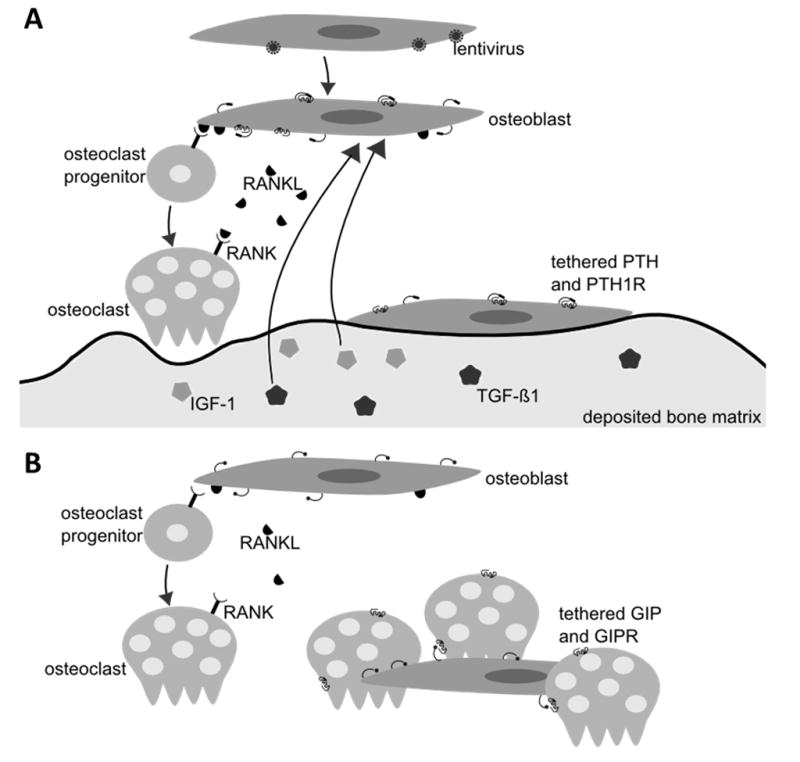
Hypothesized experimental schematic. (a) hMSCs are infected with lentivirus and subsequently express tethered PTH. hMSCs are then differentiated to osteoblasts. Tethered PTH binds to the PTH receptor to trigger the release of RANKL. RANKL increases differentiation of osteoclast progenitors and survival and activity of osteoclasts. Resorption of deposited bone matrix by osteoclasts results in the release of TGF-β1 and IGF-1 which increases bone formation in the vicinity of absorption. (b) hMSCs are transduced to express tethered GIP and differentiated to osteoblasts. Tethered GIP binds to the GIP receptor on osteoclasts resulting in reduced osteoclast activity. Reduced matrix resorption leads to reduced matrix deposition.
Surface roughness measurements of co-culture films remodeled for three weeks were consistent with the calcium results, suggesting increased deposition of mineral. In addition to increased overall roughness, films remodeled by cells expressing tPTH had larger mineralization deposits. We hypothesize that these large deposits were due to the localized cues of IGF-1 and TGF-B1 triggering deposition of mineral at the sites of increased osteoclast activity. Films remodeled by cells expressing tGIP had an overall decreased roughness. We hypothesize that the decreased osteoclast activity known to occur in the presence of GIP prevented osteoclast-driven deposition of mineralization by osteoblasts.
Roughness trends were similar in porous aqueous silk sponges remodeled by co-cultures for five weeks, however statistical power was reduced due to complicating factors in 3D image processing. While MeX software is capable of filtering out low frequency variation in a sample that is not perfectly flat, the large pores and absence of horizontal surfaces in silk sponges resulted in larger error. Therefore, in the present work we focused on data comparisons for the 2D systems, while drawing analogies in terms of trends to the 3D systems.
Surface roughness measurements of porous aqueous silk sponges remodeled in monoculture were consistent with calcium results that suggested that the presence of osteoclasts is necessary for tPTH to result in increased mineral deposition. Although error was again large, trends were the opposite of those seen in co-cultured scaffolds. In co-culture, GIP and PTH cause changes in osteoclast activity that feed back into changes in osteoblast activity, but these feedback mechanisms are absent in monoculture.
Tethered ligands were used for this study in order to achieve consistent dosing over long culture periods. Tethered ligands are advantageous because they increase the effective concentration of ligand by maintaining the ligand only in the vicinity of transduced cells, including cells in the middle of a 3D construct subject to transport limitations. Additionally, tethered ligands make long term studies economically feasible when they otherwise might not be because the cost of producing virus to infect cells once is much less expensive than the cost of supplementing media throughout an experiment. While expression of tethered ligands will trigger receptor mediated signaling, the downstream effects may be complicated by the constructs also resulting in some degree of receptor desenzitiation (functional antagonism). Despite these limitations, tethered ligands are an intriguing method for studying the effects of sustained signaling over a long time frame.
In order to further enhance our in vitro bone remodeling model for future studies, immune cells will be included. Although the co-culture presented in this study is a much better model of osteogenesis than traditional monoculture, the inclusion of additional cell types would further increase the biological relevance of the model. Inflammation is known to contribute to bone disease, with increases in pro-inflammatory cytokines implicated in post-menopausal osteoporosis and rheumatoid arthritis.[43] Localized areas of inflammation in bone have also been correlated with areas of osteoporosis.[44,45] We expect that induction of an inflammatory phenotype in the model through the use of activated leukocytes may be sufficient to generate an osteoporosis phenotype.
4. Conclusions
We have shown that tethered ligands can be used to alter remodeling behavior in our in vitro tissue engineered human bone model, and that 3D reconstruction of surfaces from SEM images using MeX enables quantification of this remodeling. This quantification of remodeling behavior in the in vitro bone model is a platform from which further studies of bone remodeling, bone disease states, and drug screening will be possible. As the population ages, understanding the remodeling behavior that occurs in healthy and diseased bone is a fundamental aspect of preventing and treating bone disease. The importance of understanding bone remodeling is clear as is evident in current controversies surrounding osteoporosis treatment. The relationship between bone matrix deposition and resorption is intricate and requires additional research. In addition to enhancing the understanding of the effects of current therapies, in vitro models that mimic disease states will reduce reliance on expensive and inaccurate animal models by enabling drug screening.
5. Experimental
Cell Culture
Unless otherwise noted, cell culture reagents were purchased from Life Technologies (Grand Island, NY). hMSCs were isolated from bone marrow aspirate (Lonza, Walkersville, MD) as described previously [46]. Briefly, aspirate from a male donor under 25 years old was combined with hMSC proliferation medium (MEM α with 10% FBS, 1% antibiotic/antimycotic, 1% non-essential amino acids (NEAA)) and cultured at 37°C with 5% CO2 in a humidified environment. Flasks were rocked every day to allow hMSCs to adhere and media was added every 3- 4 days until hMSCs reached 80% confluence. hMSCs were used at passage 1. All cultures were in osteoblast/osteoclast differentiation medium, containing a half and half mixture of RPMI 1640 and MEM α supplemented with 10% FBS, 1% antibiotic/antimycotic, 1% NEAA, 100 nM dexamethasone (Sigma Aldrich, St. Louis, MO), 10 mM B-glycerol phosphate (Sigma Aldrich, St. Louis, MO), 0.05 mM ascorbic acid (Sigma Aldrich, St. Louis, MO), 40ng/ml phorbol 12-myristate 13-acetate (PMA) (Sigma Aldrich, St. Louis, MO) and 10 ng/ml receptor activator of nuclear factor kappa-B ligand (RANKL) with medium changes every 3–4 days.
Silk Film and Sponge Preparation
Aqueous silk solution was prepared as described previously [47]. Briefly, cocoons of Bombyx mori were cut to pieces approximately 1.5 cm2 and boiled for 30 minutes in water containing 0.02 M Na2CO3, and then rinsed thoroughly with water to remove sericin. The remaining silk fibroin was then dried and dissolved in 9.3 M LiBr (Sigma Aldrich, St. Louis, MO) solution at 60°C for 4 hours. This solution was dialyzed in distilled water using a Slide-A-Lyzer dialysis cassette (MWCO 3,500, Pierce) for 2 days resulting in an 8% silk solution. Silk films approximately 50 μm thick were cast onto polystyrene from aqueous silk solution and allowed to dry overnight. Beta sheet formation was induced by water annealing at room temperature for six hours [48].
Porous aqueous silk sponges were prepared using a salt leaching technique as reported previously with salt particles 500 to 600 μm [47]. Sponges were cut to 4 mm diameter using biopsy punches. Films and sponges were sterilized by autoclaving. Sterilized sponges and films were incubated overnight in medium prior to cell seeding. Cells (1 million per sponge/ 15,000/cm2 for films) were seeded onto sponges and films in a 20 μl drop and incubated for 2 hours to allow attachment. For co-cultures, hMSCs and THP-1 cells were seeded in equal number for the same total number of cells as the monoculture.
Plasmid Production, Viral Production, and Transduction
Tethered ligands were constructed as previously described [20]. To produce virus, tethered GIP-GFP (tGIP) and tethered PTH-GFP (tPTH) plasmids were generated by insertion of the relevant sequence into the pLL3.7 plasmid. Lentivirus was produced as described previously using the 293FT cell line derived from human embryonic kidney cells modified to express the large T antigen (Life Technologies, Grand Island, NY) [49]. Briefly, 300 μl Lipofectamine 2000 (Life Technologies, Grand Island, NY) was added to 2.7 ml MEM α and incubated for 5 minutes. 3 ml MEM α containing packaging plasmids (24 μg each REV, RRE, and VSV) and the plasmid of interest (48 μg) was added and incubated for 30 minutes. The mixture was applied to a triplet flask of 293FT cells and cultured for 24 hours, at which time media was removed and discarded. Fresh media was applied and after 24 hours of culture media containing virus was collected. Media was centrifuged at 3000 rpm and filtered to remove cells, and then ultracentrifuged at 23,000 rpm in an SW32Ti rotor at 4°C for 90 minutes. The virus pellet was resuspended in MEM α and virus was titered for equal multiplicity of infection using RETRO-TEK HIV-1 p24 Antigen ELISA (ZeptoMetrix, Franklin, MA). Virus was used at 4500 pg p24 per cm2. hMSCs were transduced at 50% confluence in infection media consisting of virus and 100 μl media with 0.05 μl polybrene (Millipore, Billerica, MA) per cm2. After 20 hours media containing virus was removed and cells were washed with PBS. 48 hours after transduction cells were seeded on films and sponges.
Immunocytochemistry
Cells for immunocytochemistry were grown on collagen-coated glass coverslips. Prior to staining, cells were washed in PBS and fixed in formalin for 10 minutes. Cells were incubated in 3% bovine serum albumin for 1 hour prior to incubation in 2% Anti-Myc tag antibody (ab9106, Abcam, Cambridge, MA) for 3 hours. Following washing, samples were incubated in 1% Cy5-conjugated secondary antibody (ab6564, Abcam, Cambridge, MA) for 3 hours. Following washing, coverslips were mounted with media mount containing 4′,6-diamidino-2-phenylindole (DAPI) and imaged using a Leica TCS SP2 confocal microscope with a 63x (N.A. 1.2) objective. Sequential images of GFP (λex = 488 nm; λex = 500–600 nm), Cy5 (λex = 633 nm; λex = 650–750 nm), and DAPI (λex = 740 nm, two-photon excitation ; λex = 400–550 nm) fluorescence were collected and overlaid.
Myc Tag Expression ELISA
Surface expression of the myc tag in transduced hMSCs was measured using an ELISA as described previously [20]. hMSCs at passage 1 were grown in a clear 96 well plate and transduced to express GFP, tGIP, or tPTH. 72 hours after transduction, cells were washed in PBS and fixed in 4% paraformaldehyde for 10 minutes at room temperature. Cells were washed with 100 mM glycine in PBS and incubated for 30 minutes in PBS supplemented with 20% FBS. Cells were then incubated in the horseradish peroxidase anti-c-myc antibody (ab19312, Abcam, Cambridge, MA, 1:1,500 dilution) for 1 hour. Cells were then washed 5 times with PBS and peroxidase substrate solution (Roche Applied Science, Indianapolis, IN) was applied. Following a 30 minute incubation, 2 M sulfuric acid was added. Absorbance was read at 450 nm.
qPCR
Samples for qPCR were rinsed in PBS and stored in Trizol (Life Technologies, Grand Island, NY) at −80°C prior to analysis. RNA was isolated following the single step acid-phenol guanidinium method. RNA was purified using the Qiagen RNEasy kit (Qiagen, Valencia, CA). Reverse transcription was performed on RNA using the High Capacity cDNA Reverse Transcription kit (Life Technologies, Grand Island, NY). Assays on demand (Life Technologies, Grand Island, NY) were used for the housekeeping gene glyceraldehyde 3-phosphate dehydrogenase (GAPDH), GIP, PTH, GIPR and PTH1R. SYBR green and the forward primer CCACTACCTGAGCACCCAGTC and reverse primer CACGAACTCCAGCAGGACCA were used for GFP. Expression levels were quantified with a Stratagene Mx3000P QPCR System (Stratagene, La Jolla, CA) and normalized to GAPDH.
Calcium Deposition Analysis
Samples for calcium analysis were rinsed in PBS and kept at −20°C prior to testing. Sponges were chopped using microscissors and all samples were incubated in 5% trichloroacetic acid for 30 minutes. Following centrifugation the calcium content of the supernatant was assessed using the Stanbio (Boerne, TX) calcium cresolphthalein complexone (CPC) assay according to the manufacturer’s protocol.
Scanning Electron Microscopy
Scaffolds and films were incubated in ddH2O overnight at 4°C in order to remove cells. Scaffolds and films were then dried and sputter-coated with platinum/palladium at 40 mA for 60 seconds. Samples were imaged using a Zeiss (Germany) Supra55VP Field Emission Scanning Electron Microscope using an SE detector. Eucentric images were taken from tilt angles of −4 degrees and 4 degrees at 2000X magnification.
Surface Metrology
MeX software (Alicona, Graz, Austria) was used for surface metrology. 3D surfaces were generated from eucentric image pairs with an eight degree tilt differential and area analysis was performed using a reference plane generated from all points and a filter to exclude low frequency changes in topography associated with how flat the sample laid upon desiccation. Reported parameters are SA - average height (μm), SQ – root mean square (RMS) height (μm), SDQ - RMS gradient, SDR - developed interfacial area ratio, SP - maximum peak height (μm), SV - maximum valley depth (μm), SZ - maximum height (μm), S10Z - ten point height (μm), SSK – skewness, and SKU – kurtosis.
Statistical Analysis
All values are presented as mean +/− SD. Statistical significance was determined by Tukey’s HSD post-hoc ANOVA using R: A Language and Environment for Statistical Computing.
Acknowledgments
This work has been funded by NIH grant number P41 EB002520 for the Tissue Engineering Resource Center. Additional funding support was provided by grant number F32AR061933 from NIAMS/NIH and NIH/NIBIB R01EB007542. This work was performed in part at the Center for Nanoscale Systems (CNS), a member of the National Nanotechnology Infrastructure Network (NNIN), which is supported by the National Science Foundation under NSF award no. ECS-0335765. CNS is a Harvard University affiliate.
Contributor Information
Rebecca S. Hayden, 4 Colby St., Medford, MA 02155 (USA)
Dr. Jean-Philippe Fortin, 800 Washington Street, Box 7703, Boston, MA 02111 (USA)
Benjamin Harwood, 800 Washington Street, Box 7703, Boston, MA 02111 (USA).
Dr. Balajikarthick Subramanian, 4 Colby St., Medford, MA 02155 (USA)
Dr. Kyle P. Quinn, 4 Colby St., Medford, MA 02155 (USA)
Dr. Irene Georgakoudi, 4 Colby St., Medford, MA 02155 (USA)
Dr. Alan S. Kopin, 800 Washington Street, Box 7703, Boston, MA 02111 (USA)
Dr. David L. Kaplan, Email: david.kaplan@tufts.edu, 4 Colby St., Medford, MA 02155 (USA)
References
- 1.Murphy CM, Haugh MG, O’Brien FJ. Biomaterials. 2010;31:461. doi: 10.1016/j.biomaterials.2009.09.063. [DOI] [PubMed] [Google Scholar]
- 2.Liu X, Smith La, Hu J, Ma PX. Biomaterials. 2009;30:2252. doi: 10.1016/j.biomaterials.2008.12.068. [DOI] [PMC free article] [PubMed] [Google Scholar]
- 3.Yilgor P, Tuzlakoglu K, Reis RL, Hasirci N, Hasirci V. Biomaterials. 2009;30:3551. doi: 10.1016/j.biomaterials.2009.03.024. [DOI] [PubMed] [Google Scholar]
- 4.Henriksen K, Neutzsky-Wulff AV, Bonewald LF, Karsdal MA. Bone. 2009;44:1026. doi: 10.1016/j.bone.2009.03.671. [DOI] [PubMed] [Google Scholar]
- 5.Khosla S, Melton LJ, Riggs BL. J Bone Miner Res. 2011;26:441. doi: 10.1002/jbmr.262. [DOI] [PMC free article] [PubMed] [Google Scholar]
- 6.U.S. Department of Health and Human Services. Bone health and osteoporosis: a report of the Surgeon General. U.S. Department of Health and Human Services, Office of the Surgeon General; Rockville, MD: 2004. [Google Scholar]
- 7.Cartsos VM, Zhu S, Zavras AI. J Am Dent Assoc. 2008;139:23. doi: 10.14219/jada.archive.2008.0016. [DOI] [PubMed] [Google Scholar]
- 8.Subbiah V, Madsen VS, Raymond AK, Benjamin RS, Ludwig JA. Osteoporos Int. 2010;21:1041. doi: 10.1007/s00198-009-1004-0. [DOI] [PubMed] [Google Scholar]
- 9.Boucher BJ. Evid Based Med. 2012;17:16. doi: 10.1136/ebm.2011.100113. [DOI] [PubMed] [Google Scholar]
- 10.Hillier TA, Cauley JA, Rizzo JH, Pedula KL, Ensrud KE, Bauer DC, Lui LY, Vesco KK, Black DM, Donaldson MG, Leblanc ES, Cummings SR. J Bone Miner Res. 2011;26:1774. doi: 10.1002/jbmr.372. [DOI] [PMC free article] [PubMed] [Google Scholar]
- 11.Kanis J, Oden A, Johansson H, Borgström F, Ström O, McCloskey E. Bone. 2009;44:734. doi: 10.1016/j.bone.2009.01.373. [DOI] [PubMed] [Google Scholar]
- 12.Oreffo ROC, Cooper C, Mason C, Clements M. Stem Cell Rev. 2005;1:169. doi: 10.1385/SCR:1:2:169. [DOI] [PubMed] [Google Scholar]
- 13.Asagiri M, Takayanagi H. Bone. 2007;40:251. doi: 10.1016/j.bone.2006.09.023. [DOI] [PubMed] [Google Scholar]
- 14.Tortelli F, Pujic N, Liu Y, Laroche N. Tissue Eng Part A. 2009;15:2373. doi: 10.1089/ten.tea.2008.0501. [DOI] [PubMed] [Google Scholar]
- 15.Harwood BN, Fortin JP, Gao K, Chen C, Beinborn M, Kopin AS. Mol Pharmacol. 2013;83:814. doi: 10.1124/mol.112.081570. [DOI] [PMC free article] [PubMed] [Google Scholar]
- 16.Choi C, Fortin JP, McCarthy EV, Oksman L, Kopin AS, Nitabach MN. Curr Biol. 2009;19:1167. doi: 10.1016/j.cub.2009.06.029. [DOI] [PMC free article] [PubMed] [Google Scholar]
- 17.Ibañez-Tallon I, Nitabach MN. Curr Opin Neurobiol. 2012;22:72. doi: 10.1016/j.conb.2011.11.003. [DOI] [PMC free article] [PubMed] [Google Scholar]
- 18.Zhang X. Mol Ther. 2002;5:555. doi: 10.1006/mthe.2002.0585. [DOI] [PubMed] [Google Scholar]
- 19.Ricks D, Kutner R, Zhang X. Stem Cells Dev. 2008;450:441. doi: 10.1089/scd.2007.0194. [DOI] [PMC free article] [PubMed] [Google Scholar]
- 20.Fortin JP, Zhu Y, Choi C, Beinborn M, Nitabach MN, Kopin AS. Proc Natl Acad Sci U S A. 2009;106:8049. doi: 10.1073/pnas.0900149106. [DOI] [PMC free article] [PubMed] [Google Scholar]
- 21.Bogdanovic Z, Huang YF, Dodig M, Clark SH, Lichtler aC, Kream BE. J Cell Biochem. 2000;77:149. doi: 10.1002/(sici)1097-4644(20000401)77:1<149::aid-jcb15>3.0.co;2-n. [DOI] [PubMed] [Google Scholar]
- 22.Datta NS, Abou-Samra AB. Cell Signal. 2009;21:1245. doi: 10.1016/j.cellsig.2009.02.012. [DOI] [PMC free article] [PubMed] [Google Scholar]
- 23.Zhong Q, Itokawa T, Sridhar S, Ding KH, Xie D, Kang B, Bollag WB, Bollag RJ, Hamrick M, Insogna K, Isales CM. Am J Physiol Endocrinol Metab. 2007;292:E543. doi: 10.1152/ajpendo.00364.2006. [DOI] [PubMed] [Google Scholar]
- 24.Engler AJ, Sen S, Sweeney HL, Discher DE. Cell. 2006;126:677. doi: 10.1016/j.cell.2006.06.044. [DOI] [PubMed] [Google Scholar]
- 25.Prabhakaran MP, Venugopal J, Ramakrishna S. Acta Biomater. 2009;5:2884. doi: 10.1016/j.actbio.2009.05.007. [DOI] [PubMed] [Google Scholar]
- 26.Porter JR, Henson A, Popat KC. Biomaterials. 2009;30:780. doi: 10.1016/j.biomaterials.2008.10.022. [DOI] [PubMed] [Google Scholar]
- 27.Bhumiratana S, Grayson WL, Castaneda A, Rockwood DN, Gil ES, Kaplan DL, Vunjak-novakovic G. Biomaterials. 2011;32:2812. doi: 10.1016/j.biomaterials.2010.12.058. [DOI] [PMC free article] [PubMed] [Google Scholar]
- 28.Goldstein R, Reagan M, Anderson K, Kaplan D. Cancer Res. 2010;70:10044. doi: 10.1158/0008-5472.CAN-10-1254. [DOI] [PMC free article] [PubMed] [Google Scholar]
- 29.Mandal BB, Grinberg A, Gil ES, Panilaitis B, Kaplan DL. Proc Natl Acad Sci U S A. 2012;109:7699. doi: 10.1073/pnas.1119474109. [DOI] [PMC free article] [PubMed] [Google Scholar]
- 30.Mieszawska AJ, Fourligas N, Georgakoudi I, Ouhib NM, Belton DJ, Perry CC, Kaplan DL. Biomaterials. 2010;31:8902. doi: 10.1016/j.biomaterials.2010.07.109. [DOI] [PMC free article] [PubMed] [Google Scholar]
- 31.Cao X. Nat Med. 2011;17:1344. doi: 10.1038/nm.2499. [DOI] [PubMed] [Google Scholar]
- 32.Mills OP, Rose WI. Geosphere. 2010;6:805. [Google Scholar]
- 33.Chen X, Ostadi H, Jiang K. Anal Biochem. 2010;403:63. doi: 10.1016/j.ab.2010.04.003. [DOI] [PubMed] [Google Scholar]
- 34.Ostadi H, Jiang K, Prewett PD. Microelectron Eng. 2009;86:1021. [Google Scholar]
- 35.Meinel L, Fajardo R, Hofmann S, Langer R, Chen J, Snyder B, Vunjak-Novakovic G, Kaplan D. Bone. 2005;37:688. doi: 10.1016/j.bone.2005.06.010. [DOI] [PubMed] [Google Scholar]
- 36.Kirker-Head C, Karageorgiou V, Hofmann S, Fajardo R, Betz O, Merkle HP, Hilbe M, von Rechenberg B, McCool J, Abrahamsen L, Nazarian a, Cory E, Curtis M, Kaplan D, Meinel L. Bone. 2007;41:247. doi: 10.1016/j.bone.2007.04.186. [DOI] [PMC free article] [PubMed] [Google Scholar]
- 37.Moreau JE, Anderson K, Mauney JR, Nguyen T, Kaplan DL, Rosenblatt M. Cancer Res. 2007;67:10304. doi: 10.1158/0008-5472.CAN-07-2483. [DOI] [PubMed] [Google Scholar]
- 38.Sun L, Wang X, Kaplan DL. Biomaterials. 2011;32:5581. doi: 10.1016/j.biomaterials.2011.04.028. [DOI] [PMC free article] [PubMed] [Google Scholar]
- 39.Sengupta S, Park SH, Seok GE, Patel A, Numata K, Lu CL, Kaplan DL. Biomacromolecules. 2010;11:3592. doi: 10.1021/bm101054q. [DOI] [PMC free article] [PubMed] [Google Scholar]
- 40.Ma Y, Cain R, Halladay D, Yang X. Endocrinology. 2001;142:4047. doi: 10.1210/endo.142.9.8356. [DOI] [PubMed] [Google Scholar]
- 41.Ryu J, Kim HJ, Chang EJ, Huang H, Banno Y, Kim HH. EMBO J. 2006;25:5840. doi: 10.1038/sj.emboj.7601430. [DOI] [PMC free article] [PubMed] [Google Scholar]
- 42.Jilka RL, O’Brien Ca, Bartell SM, Weinstein RS, Manolagas SC. J Bone Miner Res. 2010;25:2427. doi: 10.1002/jbmr.145. [DOI] [PMC free article] [PubMed] [Google Scholar]
- 43.Mundy G. Nutr Rev. 2007;65:S147. doi: 10.1111/j.1753-4887.2007.tb00353.x. [DOI] [PubMed] [Google Scholar]
- 44.Yun AJ, Lee PY. Med Hypotheses. 2004;63:532. doi: 10.1016/S0306-9877(03)00326-8. [DOI] [PubMed] [Google Scholar]
- 45.Ginaldi L, Di Benedetto MC, De Martinis M. Immun Ageing. 2005;2:14. doi: 10.1186/1742-4933-2-14. [DOI] [PMC free article] [PubMed] [Google Scholar]
- 46.Altman GH, Horan RL, Martin I, Farhadi J, Stark PRH, Volloch V, Richmond JC, Vunjak-Novakovic G, Kaplan DL. FASEB J. 2002;16:270. doi: 10.1096/fj.01-0656fje. [DOI] [PubMed] [Google Scholar]
- 47.Kim UJ, Park J, Kim HJ, Wada M, Kaplan DL. Biomaterials. 2005;26:2775. doi: 10.1016/j.biomaterials.2004.07.044. [DOI] [PubMed] [Google Scholar]
- 48.Jin HJ, Park J, Karageorgiou V, Kim UJ, Valluzzi R, Cebe P, Kaplan DL. Adv Funct Mater. 2005;15:1241. [Google Scholar]
- 49.Kang JH, Gimble JM, Kaplan DL. Tissue Eng Part A. 2009;15:2227. doi: 10.1089/ten.tea.2008.0469. [DOI] [PMC free article] [PubMed] [Google Scholar]