

Abstract
In this study, we compared gene transfer efficiency and host response to ultrasound-assisted, nonviral gene transfer with a conventional plasmid and a minicircle vector in the submandibular salivary glands of mice. Initially, we looked at gene transfer efficiency with equimolar amounts of the plasmid and minicircle vectors, corroborating an earlier report showing that minicircle is more efficient in the context of a physical method of gene transfer. We then sought to characterize the physiological response of the salivary gland to exogenous gene transfer using global proteomic profiling. Somewhat surprisingly, we found that sonoporation alone, without a gene transfer vector present, had virtually no effect on the salivary gland proteome. However, when a plasmid vector was used, we observed profound perturbations of the salivary gland proteome that compared in magnitude to that seen in a previous report after high doses of adeno-associated virus. Finally, we found that gene transfer with a minicircle induces only minor proteomic alterations that were similar to sonoporation alone. Using mass spectrometry, we assigned protein IDs to 218 gel spots that differed between plasmid and minicircle. Bioinformatic analysis of these proteins demonstrated convergence on 68 known protein interaction pathways, most notably those associated with innate immunity, cellular stress, and morphogenesis.
Introduction
Gene transfer for therapeutic purposes is now an established and promising treatment strategy in disease paradigms where conventional treatments are unavailable or inadequate. Despite decades of frustratingly slow progress, several recent successes1–3 demonstrate the vital and transformative role that gene therapy will play in the future of medicine. In general, the field has progressed beyond proof-of-principle into a new focus on research questions related to clinical practicality. Delivery of genetic payloads remains, as it has always been, the greatest challenge to realizing the full clinical potential of gene therapy. With clinically efficacious gene transfer now a demonstrated reality, current research is exploring more nuanced delivery issues, such as changes in intracellular programming that may occur as the result of gene transfer to target tissues.
Nonviral gene transfer overcomes one of the most vexing challenges to clinical implementation of gene therapy, namely the introduction of viral vector antigens into host cells and tissues.4–6 However, due to the vanguard role viral vectors have historically played in advancing gene therapy from the theoretical to clinical reality, research examining host response to nonviral vectors has understandably lagged. Because nonviral vectors lack the protein antigens necessary to initiate classical humoral or cell-mediated extracellular immunity, these vectors have often been assumed to be modestly or negligibly immunogenic provided they encode a therapeutic protein that is native to the host.7 This assumption is reasonable as far as it goes, but intracellular host response to nonviral vectors has not been well studied and may present an additional challenge for gene therapy.
Our group has successfully applied the principle of ultrasound-assisted gene transfer (UAGT) to the salivary gland,8 relying upon the biophysical effect referred to as sonoporation9 to allow a plasmid to physically transit the membranes of salivary gland epithelial cells. This gene transfer model relies upon bloodless cannulation of the salivary duct, and infusion of the vector and microbubbles into the intraductal labyrinth of the salivary gland.10 As such, the volume, concentration, and composition of the gene transfer solution can be precisely controlled and isolated from blood or mucosal defenses, allowing us to parse out vector-specific physiological responses in the target tissue. UAGT does not stimulate inflammation or cellular infiltration of the gland, and thus, we can profile the proteome of the homogenized organ without concern for contributions from exogenous cells.
In this study, we took advantage of these characteristics of salivary gland gene transfer as a model system to explore the impact of nonviral gene transfer upon the proteome of the gland. Gel-based proteomic profiling has limitations,11 but it provides a global, unbiased look at gene transfer–associated changes in organ physiology as manifested in the proteome. Our goal was to understand the overall magnitude of changes in the proteomic profile of the gland, if any, following UAGT with first-generation plasmids and advanced minicircle12,13 vectors. We theorize that subcellular proteomic alterations associated with nonviral gene transfer to the salivary gland will give us broadly generalizable insights into intracellular response to nonviral vectors in a variety of target tissues and thus advance our understanding of the potential for vector-associated intracellular toxicity in gene therapy.
Results
Generation of minicircle vectors based upon pCMV-GL3enh
The expression cassette from pCMV-GL3enh was successfully transferred to the pMC.BESPX-MCS1 parental vector and confirmed by sequence analysis. This vector was used to transform the ZYCY10P3S2T bacterial strain, and transformed bacteria were then exposed to arabinose, resulting in excision and recircularization of the cytomegalovirus (CMV)-GL3enh minicircle and the release and degradation of the parental backbone. The structure of the isogenic pCMV-GL3enh plasmid and CMV-GL3enh minicircle are shown in Figure 1a. Figure 1b shows bands of the appropriate size for the CsCl-purified products of the excision reaction, including the 7710bp parental vector and the 3290bp minicircle.
Figure 1.
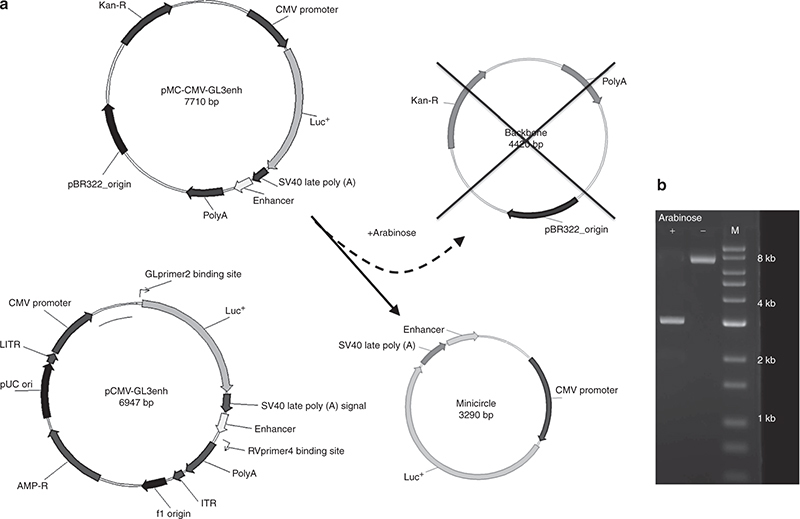
Generation of Minicircle plasmid DNA. (a) The expression cassette was excised from the first-generation plasmid vector, pCMV-GL3enh and ligated into the parental plasmid, pMC-Gl3-Enhancer. After the addition of arabinose, the parental vector is cleaved, and the progeny minicircle (C) and backbone, containing the bacterial origin of replication and antibiotic resistance, are religated. The backbone sequence contains several engineered I-SecI restriction sites that ultimately lead to the degradation of the parental DNA but not the Minicircle DNA. (b) DNA gel of the minicircle prep shows the intact parental vector (7.7 kb) in the absence (−) of arabinose, and the minicircle in the presence (+) of arabinose (3.29 kb, note the absence of the degraded backbone). Lane M indicates the reference ladder. Plasmids were cut by EcoRV to achieve linearization prior to electrophoresis.
UAGT to the salivary gland results in global but heterogeneous gene transfer and does not result in cellular infiltration or tissue disruption
In our initial report describing UAGT to the mouse salivary gland,8 we reported that the process appeared to be stochastic and without preference to cell type, but our analysis was somewhat confounded by autofluorescence of the salivary gland tissue. To improve our approach, we relied upon HRP-based staining of tissue sections and utilized gene transfer of human α-1-antitrypsin (A1AT) as the marker and the results are shown in Figure 2. Some background staining was observed in the extracellular matrix, but there was no background staining in any of the cellular elements when the A1AT antibody was excluded (right lower panel). Specific staining for the marker transgene was observed in both ductal (left lower panel) and acinar cells (right upper panel). Globally, staining was observed throughout the gland with occasional regions of intense staining (upper left panel).
Figure 2.
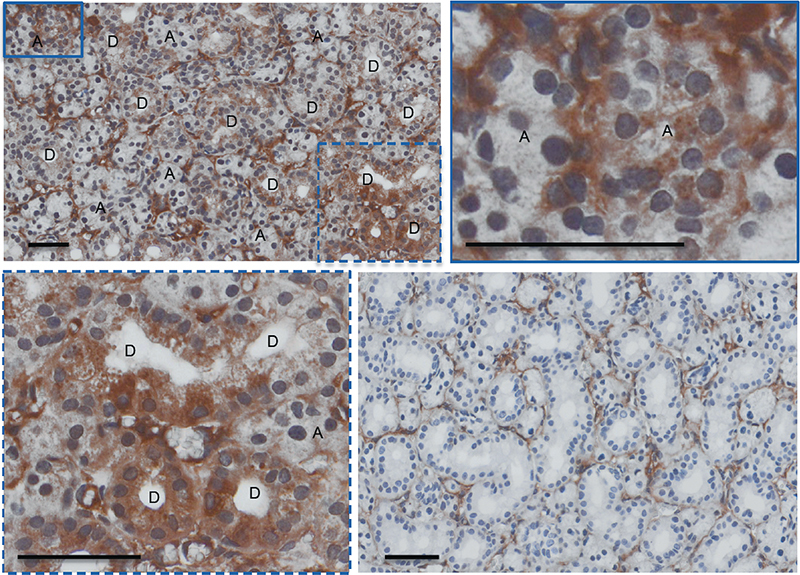
Immunohistochemical analysis of mouse salivary glands 24 hours following ultrasound-assisted gene transfer (UAGT) of a α-1-antitrypsin-expressing plasmid. Sections stained in the presence of the polyclonal anti-A1AT antibody (upper left) show a global but heterogeneous staining pattern that labels both ductal (D) and acinar (A) cells. Sections stained in the absence of the antibody (lower right panel) reveal some background staining in the interstitial connective tissues, but cell bodies are clear of staining. Bar = 50 µm.
Additionally, we utilized these sections to evaluate whether UAGT of a foreign gene results in cellular infiltration or tissue disruption of the mouse salivary gland. This question was particularly pertinent to our present study because if cellular infiltration is absent, we can assume that proteomic changes that occur in the tissue as a result of plasmid or minicircle gene transfer are primarily attributable to the intracellular response of native salivary gland cells to the vectors. The lower right panel in Figure 2 shows negative control (i.e., staining without antibody) tissue sections serial to those stained for A1AT, demonstrating a lack of cellular infiltration and no noticeable disruption of tissue architecture following UAGT with a plasmid vector encoding A1AT. Formal scoring of the study tissue for these indices was performed by a blinded oral pathologist (Dr. Paul Edwards) and results indicated no difference between naive control glands and experimental (data not shown).
Minicircle vectors mediate superior UAGT relative to first-generation plasmids
In initial testing of our minicircle vectors, we used bioluminescent imaging following UAGT to compare the gene transfer efficiency of the minicircle to our conventional pCMV-GL3enh vector, a vector system that is routinely utilized in our laboratory. Using our standard UAGT conditions, with eqimolar concentrations of pCMV-GL3enh or pMC-CMV-GL3enh, we found that the minicircle was more efficient in the magnitude of transgene expression (see Figure 3). This finding is consistent with an earlier report of a similar phenomenon following electrotransfer to muscle.14
Figure 3.
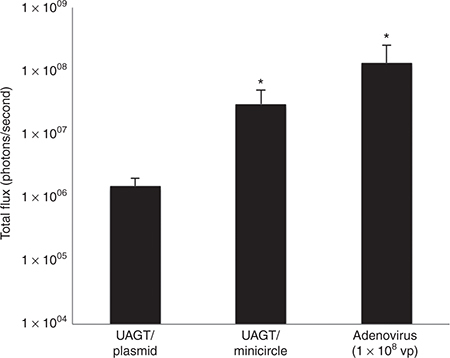
Quantification of luciferase activity 24 hours following gene transfer to the salivary gland. Average total flux (photons/second) is measured by the charge-coupled devices camera system over a 60-second sampling period. Gene transfer with ultrasound-assisted gene transfer (UAGT)/plasmid (n = 6), UAGT/minicircle (n = 8), and adenovirus at a dose of 1 × 10⁸ viral particles (n = 6) is compared. “*” indicates statistically significant differences (P < 0.05, Mann–Whitney U-test).
Sonoporation without gene transfer exerts negligible effects upon salivary gland protein expression
The mechanism underlying UAGT is thought to occur primarily through the formation of transient pores in the cell membrane created by the inertial cavitation that occurs when microbubbles implode in the presence of an acoustic field of the appropriate frequency and power.15–18 While not fatal to cells under optimal conditions, we assumed that the biophysical insult resulting from sonoporation would elicit a physiological response within target cells that would be reflected in the proteomic profile. Using gel-based proteomic profiling (see Figure 4 for diagram of workflow), we sought to measure the magnitude of this response for later comparison with UAGT. Figure 5b shows the composite proteomic fingerprint of a mouse salivary gland, created by the DeCyder software (GE Healthcare, Piscataway, NJ) by integrating eight salivary gland samples, taken from mice 24 hours after sonoporation alone, versus a composite proteome of a naive gland integrated across six samples. To our surprise, sonoporation alone exerted only minor effects (>6%) upon the proteomic profile of the gland using our standard thresholds.
Figure 4.
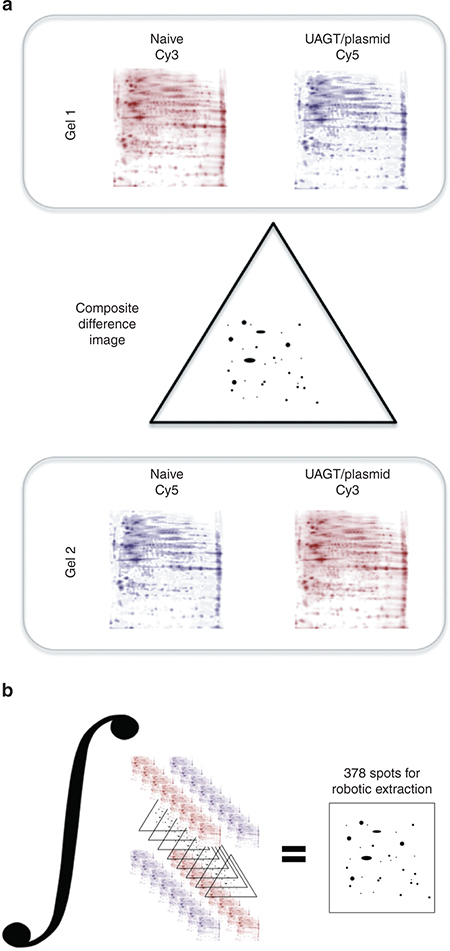
Diagram of our bioinformatic workflow. (a) Comparison of two randomly paired samples from the two groups to be compared (e.g., naive and ultrasound-assisted gene transfer/plasmid) is carried out by labeling one sample with Cy3 and the other sample with Cy5 and running on the same gel to obtain a difference image. Cy dyes are then swapped and a second get is run to correct for Cy dye intensity differences. (b) The step shown in (a) is repeated for each randomly paired sample set and the difference images are integrated across all eight sample pairings. Analysis of variance is performed on a spot-by-spot basis to arrive at a final dataset of protein spots significantly different between the two groups.
Figure 5.
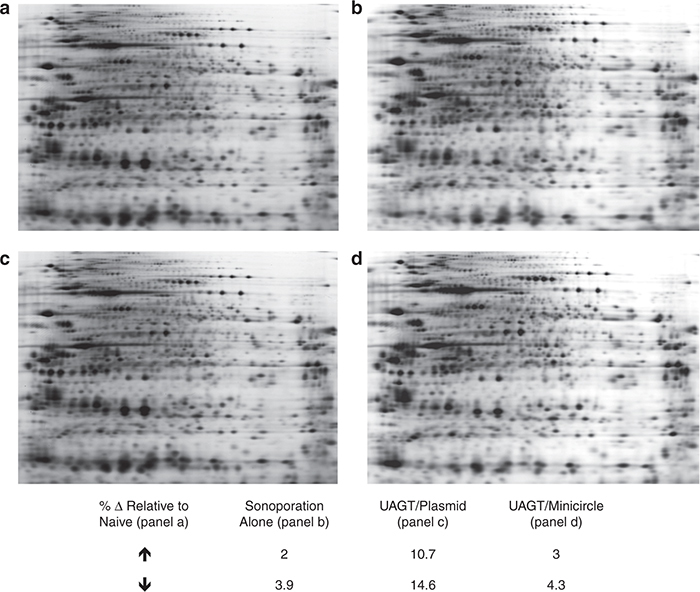
Composite proteomic profiles of salivary glands following gene transfer with nonviral vectors. (a) naive salivary gland, (b) salivary gland 24 hours following sonoporation in the absence of a plasmid vector, (c) salivary gland 24 hours following sonoporation in the presence of pCMV-GL3enh plasmid, (d) and salivary gland 24 hours following sonoporation in the presence of the CMV-GL3enh minicircle. Calculated differences as determined by DeCyder analysis (threshold = 2, P value = <0.05) are presented in the table, with each experimental condition being compared to naive.
Proteomic profiling of salivary gland following UAGT reveals major alterations in the proteomic profile that are attributable to the plasmid backbone
We have previously shown that adeno-associated virus vector-mediated gene transfer to the salivary gland results in profound alterations of the salivary gland proteome in the absence of histological manifestations of inflammation or tissue damage.19 After finding that sonoporation alone had little effect upon the proteome of the salivary gland, we wondered whether the addition of a plasmid vector to sonoporation (i.e., UAGT) would have a detectable effect on the proteome. Figure 5c shows results of this experiment. We found >25% of all proteins were altered 24 hours after UAGT relative to naive gland. These results indicate that plasmid-mediated gene transfer exerts a profound effect upon the mouse salivary gland, approaching in magnitude that seen with virus-mediated gene transfer.
UAGT with minicircles eliminates >95% of the proteomic alterations associated with first-generation plasmids
Based upon these results, we could not be certain whether these effects were due to noneukaryotic sequences in the plasmid backbone, generalized effects of foreign gene transfer, or a combination of the two. In order to parse these potential contributions to the observed phenomenon, we performed UAGT dose of minicircle vector equimolar to that of plasmid used in the experiment reported in Figure 5c. The minicircle contained an expression cassette identical in all respects to the first-generation plasmid. Figure 5d shows results of these experiments, demonstrating that the minicircle construct obviates the proteomic alterations seen with the first-generation plasmid, making it nearly indistinguishable from sonoporation alone.
Proteins identified and pathway analysis
In order to make an initial exploration into the organ response to plasmid-mediated gene transfer, we picked 378 spots that were altered in plasmid versus naive but not altered in minicircle versus naive. Of these, 237 were conclusively identified using matrix-assisted laser desorption/ionization time-of-flight mass spectrometry, and their identities are listed in Table 1. Briefly, protein identification by peptide mass fingerprinting was done using the Bruker Daltonics FLEX series software includes several engines called flexAnalysis, BioTools, and Matrix Science MASCOT Search. The MASCOT search utility reports the highest probable hits with as a histogram of Mowse scores. Positive protein ID’s were reported only in those cases where one hit, and only one hit, achieved a Mowse score greater than 73. All proteins identified thusly were then brought back to BioTools and the MS spectrum was annotated with matched peptides as an additional quality control step. In cases where multiple hits exceeded a Mowse score of 73, those proteins were not reported. Table 1 therefore reflects proteins identified with the highest level of confidence, and 141 of the protein spots picked were omitted due to failure to meet this standard.
Table 1. Identified proteins.
| Protein name | Accession |
|---|---|
| 1-phosphatidylinositol 4,5-bisphosphate phosphodiesterase Δ-3 | PLCD3_MOUSE |
| 2′-5′-oligoadenylate synthase 3 | OAS3_MOUSE |
| 26S protease regulatory subunit 8 | PRS8_MOUSE |
| 2-amino-3-carboxymuconate-6-semialdehyde decarboxylase | ACMSD_MOUSE |
| 6-phosphofructo-2-kinase/fructose-2,6-bisphosphatase 2 | F262_MOUSE |
| 72 kDa inositol polyphosphate 5-phosphatase | INP5E_MOUSE |
| A disintegrin and metalloproteinase with thrombospondin motifs 4 | ATS4_MOUSE |
| Abhydrolase domain-containing protein FAM108C1 | F108C_MOUSE |
| Actin-binding Rho-activating protain | ABRA_MOUSE |
| Actin-related protein T2 | ACTT2_MOUSE |
| Activator of apoptosis harakiri | HRK_MOUSE |
| Acylphosphatase-1 | ACYP1_MOUSE |
| Adenylsuccinate synthetase isozyme 1 | PURA1_MOUSE |
| ADP-ribosylation factor-like protein 4D | ARL4D_MOUSE |
| AF4/FMR2 family member 1 | AFF1_MOUSE |
| Alcohol dehydrogenase [NADP(+)] | AK1A1_MOUSE |
| Aldehyde dehydrogenase family 3 member B1 | AL3B1_MOUSE |
| α-N-acetylgalactosaminidase | NAGAB_MOUSE |
| Alsin | ALS2_MOUSE |
| AN1-type zinc finger protein 1 | ZFAN1_MOUSE |
| Angiogenin | ANGI_MOUSE |
| Angiopoietin-2 | ANGP2_MOUSE |
| Angiopoietin-related protein | ANGL1_MOUSE |
| Ankyrin repeat domain-containing protein 24 | ANR24_MOUSE |
| Aspartate-tRNA ligase cytoplasmic | SYDC_MOUSE |
| Ataxin-7 | ATX7_MOUSE |
| ATP-binding cassette subfamily B member 8 | ABCB8_MOUSE |
| Autophagy-related protein 2 homolog B | ATG2B_MOUSE |
| Bcl10-interacting CARD protein | BINCA_MOUSE |
| Bcl-2 homologous antagonist/killer | BAK_MOUSE |
| BEN domain-containing protein 3 | BEND3_MOUSE |
| β-1,4 N-acetylgalactosan-minyltransferase 1 | B4GN1_MOUSE |
| β-1-syntrophin | SNTB1_MOUSE |
| BTB/POZ domain containing protein KCTD11 | KCD11_MOUSE |
| Calcium uptake protein 1, mitochondrial | MICU1_MOUSE |
| Calcium-transporting ATPase Type 2C member 1 | AT2C1_MOUSE |
| Calpain-7 | CAN7_MOUSE |
| cAMP-specific 3′,5′-cyclic phosphodiesterase 4A | PDE4A_MOUSE |
| CAP-Gly domain-containing linker protein 1 | CLIP1_MOUSE |
| Casein kinase II subunit α | CSK22_MOUSE |
| CB1 cannabinoid receptor-interaction protein 1 | CNRP1_MOUSE |
| CD48 antigen | CD48_MOUSE |
| Centrisomal protein of 170 kDa protein B | C170B_MOUSE |
| Cholesterol 7-α-monooxygenase | CP7A1_MOUSE |
| Choline dehydrogenase, mitochondrial | CHDH_MOUSE |
| Coatomer subunit β | COPB2_MOUSE |
| Coiled-coil domain-containing protein 148 | CC148_MOUSE |
| Coiled-coil domain-containing protein 164 | CC164_MOUSE |
| COMM domain-containing protein 9 | COMD9_MOUSE |
| COP9 signalosome complex subunit 4 | CSN4_MOUSE |
| C-type lectin domain family 2 member I | CLC2I_MOUSE |
| Cystatin-C | CYTC_MOUSE |
| Cytochrome b-c1 complex subunit 9 | QCR9_MOUSE |
| Cytochrome p450 | CP1A2_MOUSE |
| Cytochrome P450 2C50 | CY250_MOUSE |
| Cytoplasmic dynein 1 light intermediate chain 1 | DC1L1_MOUSE |
| Cytoplasmic dynein 2 heavy chain 1 | DYHC2_MOUSE |
| DCC-interacting protein 13-β | DP13B_MOUSE |
| Disintegrin and metalloproteinase domain-containing protein 15 | ADA15_MOUSE |
| DNA replication licensinf factor MCM7 | MCM7_MOUSE |
| DnaJ homolog subfamily C member 28 | DJC28_MOUSE |
| Docking protein 1 | DOK1_MOUSE |
| Docking protein 6 | DOK6_MOUSE |
| Dual specificity mitogen-activated protein kinase 4 | MP2K4_MOUSE |
| Dynamin-1-like protein | DNM1L_MOUSE |
| E3 SUMO-protein ligase PIAS4 | PIAS4_MOUSE |
| E3 ubiquitin-protein ligase MARCH3 | MARH3_MOUSE |
| E3 ubiquitin-protein ligase RNF169 | RN169_MOUSE |
| Echinoderm microtubule-associated protein-like 4 | EMAL4_MOUSE |
| Ecto-ADP-ribosyltransferase 5 | NAR5_MOUSE |
| Ectoderm-neural cortex protein 2 | ENC2_MOUSE |
| Ecto-NOX disulfide-thiol exchanger 2 | ENOX2_MOUSE |
| Electron transfer flavoprotein subunit α, mitochondrial | ETFA_MOUSE |
| Ephrin type-B receptor 1 | EPHB1_MOUSE |
| Ethanolamine-phosphate cytidylyltransferase | PCY2_MOUSE |
| Exophilin-5 | EXPH5_MOUSE |
| Fibronectin Type 3 and ankyrin repeat domains 1 protein | FANK1_MOUSE |
| Flotillin-2 | FLOT2_MOUSE |
| Fragile X mental retardation syndrome-related protein 1 | FXR1_CRIGR |
| Fragile X mental retardation syndrome-related protein 2 | FXR2_MOUSE |
| G patch domain-containing protein 2 | GPTC2_MOUSE |
| γ-crystallin A | CRGA_MOUSE |
| GAS2-like protein 2 | GA2L2_MOUSE |
| GDNF-inducible zinc finger protein 1 | GZF1_MOUSE |
| General transcription factor 3C polypeptide 4 | TF3C4_MOUSE |
| Glial fibrillary acidic protein | GFAP_MOUSE |
| Glyceraldehyde-3-phosphate dehydrogenase | G3P_MOUSE |
| Glycine receptor subunit α-4 | GLRA4_MOUSE |
| Glycogen phosphorylase | PYGM_MOUSE |
| Glyoxalase domain-containing protein 5 | GLOD5_MOUSE |
| Golgi SNAP receptor complex member 1 | GOSR1_MOUSE |
| Golgin subfamily A member 3 | GOGA3_MOUSE |
| GRB2-associated and regulator of MAPK protein-like | GAREL_MOUSE |
| GS homeobox 1 | GSX1_MOUSE |
| GTPase Hras | RASH_MOUSE |
| Guanine nucleotide-binding protein subunit β-2-like 1 | GBLP_MOUSE |
| Heat shock cognate 71 kDa protein | HSP7C_MOUSE |
| Hemojuvelin | RGMC_MOUSE |
| Huntingtin-interacting protein 1-related protein | HIP1R_MOUSE |
| Hydrocephalus-inducing protein | HYDIN_MOUSE |
| Ig heavy chain V region J558 | HVM13_MOUSE |
| Influenza virus NS1BP-binding protein homolog | NS1BP_MOUSE |
| Inhibitor of nuclear factor κ-B kinase subunit epsilon | IKKE_MOUSE |
| Initiation factor 4A-III | IF4A3_MOUSE |
| Integrator complex subunit 6 | INT6_MOUSE |
| Integrin β-2 | ITB2_MOUSE |
| Interleukin-22 | IL22_MOUSE |
| Interleukin-22b | IL22B_MOUSE |
| Intraflagellar transport protein 57 | IFT57_MOUSE |
| Intraflagellar transport protein 74 homolog | IFT74_MOUSE |
| Kelch-like protein 36 | KLH36_MOUSE |
| Kinesin-like protein KLP6 | KLP6_MOUSE |
| Kinocilin | KNCN_MOUSE |
| Laminin subunit α-5 | LAMA5_MOUSE |
| Lens epithelial cell protein LEP503 | LENEP_MOUSE |
| Leucine-rich repeat-containig protein 23 | LRC23_MOUSE |
| Leucine-rich repeat-containing protein 7 | LRRC7_MOUSE |
| Long-chain-fatty-acid-CoA ligase | ACSL6_MOUSE |
| Macoilin | MACOI_MOUSE |
| MAGE-like protein 2 | MAGL2_MOUSE |
| MAGUK p55 subfamily member 2 | MPP2_MOUSE |
| Megakaryocyte-associated tyrosine-protein kinase | MATK_MOUSE |
| Methylmalonate-semialdehyde dehydrogenase [acylating], mitochondrial | MMSA_MOUSE |
| Microphage scavenger receptor Types 1 and 2 | MSRE_MOUSE |
| Mitogen-activated kinase | M3KL4_MOUSE |
| Mitotic-spindle organizing protein 2 | MZT2_MOUSE |
| MORN repeat-containing protein 4 | MORN4_MOUSE |
| Muscular LMNA-interactiong protein | MLIP_MOUSE |
| Myoferlin | MYOF_MOUSE |
| Myosin-1 | MYH1_MOUSE |
| Myosin-4 | MYH4_MOUSE |
| Myotubularin | MTM1_MOUSE |
| NACHT, LRR and PYD daomains-containing protein 5 | NALP5_MOUSE |
| Nephronectin | NPNT_MOUSE |
| Neutrophil cytosol factor 1 | NCF1_MOUSE |
| Nuclear pore complex protein Nup85 | NUP85_MOUSE |
| Nucleolar GTP-binding protein 1 | NOG1_MOUSE |
| Nucleolar protein 16 | NOP16_MOUSE |
| Nucleolar transcription factor 1 | UBF1_MOUSE |
| Opalin | OPALI_MOUSE |
| Pantothenate kinase 4 | PANK4_MOUSE |
| Paraspeckle component 1 | PSPC1_MOUSE |
| Peptidyl-prolyl cis-trans isomerase FKBP5 | FKBP5_MOUSE |
| Peroxiredoxin-1 | PRDX1_MOUSE |
| Phenylalanine-4-hydroxylase | PH4H_MOUSE |
| Phosphate carrier protein mitochondrial | MPCP_MOUSE |
| Phosphatidylinositol 3-kinase catalytic subunit Type 3 | PK3C3_MOUSE |
| Phosphatidylinositol transfer protein β isoform | PIPNB_MOUSE |
| Phosphorylated CTD-interacting factor 1 | PCIF1_MOUSE |
| Plexin-B2 | PLXB2_MOUSE |
| Poly (a) polymerase γ | PAPOG_MOUSE |
| Poly(U)-specific endoribonuclease | ENDOU_MOUSE |
| Prickle-like protein | PRIC1_MOUSE |
| Probable ATP-dependent RNA helicase DDX6 | DDX6_MOUSE |
| Programmed cell death protein 4 | PDCD4_MOUSE |
| Prolactin-7D1 | PR7D1_MOUSE |
| Protein Asterix | ASTER_MOUSE |
| Protein Daple | DAPLE_MOUSE |
| Protein FAM216B | F216B_MOUSE |
| Protein FAM229B | F229B_MOUSE |
| Protein kinase C delta-binding protein | PRDBP_MOUSE |
| Protein naked cuticle homolog 1 | NKD1_MOUSE |
| Protein N-terminal asparagine amidohydrolase | NTAN1_MOUSE |
| Protein RER1 | RER1_MOUSE |
| Protein TCL1B1 | TCLB1_MOUSE |
| Putative ATP-dependent RNA helicase TDRD9 | TDRD9_MOUSE |
| Putative polycomb group protein ASXL2 | ASXL2_MOUSE |
| Pyridoxal-dependent decarboxylase domain-containing protein 1 | PDXD1_MOUSE |
| Pyroglutamyl-peptidase 1-like protein | PGPIL_MOUSE |
| Pyruvate dehydrogenase (acetyl-transferring)-phosphatase 1 | PDP1_MOUSE |
| Pyruvate dehydrogenase (lipoamide) kinase isozyme 2 mitochondrial | PDK2_MOUSE |
| Pyruvate dehydrogenase (lipoamide) kinase isozyme 3 mitochondrial | PDK3_MOUSE |
| Rap guanine nucleotide exchange factor 5 | RPGF5_MOUSE |
| Ras-related protein Rab-19 | RAB19_MOUSE |
| Receptor-transporting protein 4 | RTP4_MOUSE |
| Receptor-type tyrosine-protein phosphatase U | PTPRU_MOUSE |
| Regulator of G-protein signaling 4 | RGS4_MOUSE |
| Rho GTPase-activating protein 1 | RHG01_MOUSE |
| Sarcolemmal membrane-associated protein | SLMAP_MOUSE |
| Semaphorin-3A | SEM3A_MOUSE |
| Semaphorin-7A | SEM7A_MOUSE |
| Seminal vesicle secretory protein 5 | SVS5_MOUSE |
| Septin-2 | SEPT2_MOUSE |
| Septin-8 | SEPT8_MOUSE |
| Serine/threonine-protein kinase ICK | ICK_MOUSE |
| Serine/threonine-protein kinase Nek11 | NEK11_MOUSE |
| Serine/threonine-protein kinase Nek5 | NEK5_MOUSE |
| Serine/threonine-protein kinase PLK4 | PLK4_MOUSE |
| Serine/threonine-protein kinase SMG1 | SMG1_MOUSE |
| Serpin B12 | SPB12_MOUSE |
| Serpin H1 | SERPH_MOUSE |
| Serum albumin | ALBU_MOUSE |
| Small nuclear ribonucleoprotein-associated protein N | RSMN_MOUSE |
| Son of sevenless homolog 1 | SOS1_MOUSE |
| Spermatogenesis-associated protein 7 homolog | SPAT7_MOUSE |
| SRC kinase signaling inhibitor 1 | SRCN1_MOUSE |
| Sulfite oxidase, mitochondrial | SUOX_MOUSE |
| SUN domain-containing protein 1 | SUN1_MOUSE |
| Synaptotagmin-6 | SYT6_MOUSE |
| T-box transcription factor TBX21 | TBX21_MOUSE |
| Testin | TES_MOUSE |
| TIR domain-containing adapter molecule 1 | TCAM1_MOUSE |
| Torsin-1B | TOR1B_MOUSE |
| Trafficing protein particle complex subunit 3-like protein | TPC3L_MOUSE |
| TRAF-interacting protein | TRAIP_MOUSE |
| Trans-2-enoyl-CoA reductase mitochondrial | MECR_MOUSE |
| Transketolase-like protein 2 | TKTL2_MOUSE |
| Translocase of inner mitochondrial membrane domain-containing protein 1 | TIDC1_MOUSE |
| tRNA guanine(26)-N(2)-dimethyltransferase | TRM1_MOUSE |
| Tubulin β-2B chain | TBB2B_MOUSE |
| Tudor domain-containing protein 3 | TDRD3_MOUSE |
| Tumor protein p63-regulated gene 1 protein | TPRG1_MOUSE |
| Tyrosine-protein kinase ABL1 | ABL1_MOUSE |
| Tyrosine-protein kinase ZAP-70 | ZAP70_MOUSE |
| Tyrosine-protein phosphatase non-receptor Type 12 | PTN12_MOUSE |
| Tyrosine-protein phosphatase non-receptor Type 13 | PTN13_MOUSE |
| U7 snRNA-associated Sm-like protein LSm11 | LSM11_MOUSE |
| Ubiquitin carboxyl-terminal hydrolase 13 | UBP13_MOUSE |
| Ubiquitin carboxyl-terminal hydrolase 36 | UBP36_MOUSE |
| UBX domain-containing protein | UBXN8_MOUSE |
| UDP-glucuronic acid decarboxylase | UXS1_MOUSE |
| UDP-N-acetylglucosamine-peptide N-acetylglucosaminyltransferase 110kDa subunit | OGT1_MOUSE |
| Uncharacterized protein C11orf89 homolog | CK089_MOUSE |
| Uncharacterized protein C2orf47 homolog | CB047_MOUSE |
| Uncharacterized protein C9orf114 homolog | CI114_MOUSE |
| Uncharacterized protein C9orf172 homolog | CI172_MOUSE |
| Upoplakin-1b | UPK1B_MOUSE |
| UV-stimulated scaffold protein A | UVSSA_MOUSE |
| Vacuolar fusion protein MON1 homolog B | MON1B_MOUSE |
| Vomeronasal Type 2 receptor 1 | V2R1_MOUSE |
| V-set and immuniglobulin domain-containing protein 8 | VSIG8_MOUSE |
| V-type proton ATPase subunit B | VATB2_MOUSE |
| WAP four-disulfide core domain protein 6B | WFC6B_MOUSE |
| WD repeat-containig protein 93 | WDR93_MOUSE |
| Xin actin-binding repeat-containing protein2 | XIRP2_MOUSE |
| Zinc finger protein 182 | ZN182_MOUSE |
| Zinc finger protein 90 | ZEP90_MOUSE |
Using the GO-Elite pathway analysis tool,20 the proteins identified were compiled into 68 common interaction pathways, containing 2 or more identified proteins, and these are listed in Table 2. Visual output of the pathway analysis highlighting our proteins-of-interest are presented in full in the Supplementary Material. Of the 68 pathways implicated, 18 contained >3 of our proteins of interest, and several of these are reviewed in the discussion below.
Table 2. Pathways identified.
| WikiPathway ID | 3pp Specification | Number of protein(s) |
|---|---|---|
| WP310 | mRNA processing | 12 |
| WP246 | TNF-α NF-κB signaling pathway | 7 |
| WP1763 | PluriNetWork | 7 |
| WP407 | Kit receptor signaling pathway | 6 |
| WP572 | EGFR1 signaling pathway | 6 |
| WP6 | Integrin-mediated cell adhesion | 5 |
| WP65 | Insulin signaling | 5 |
| WP539 | Wnt signaling pathway NetPath | 5 |
| WP1253 | Type 2 interferon signaling (IFNG) | 5 |
| WP85 | Focal adhesion | 4 |
| WP251 | MAPK cascade | 4 |
| WP274 | B cell receptor signaling pathway | 4 |
| WP373 | IL-3 signaling pathway | 4 |
| WP431 | Nuclear receptors in lipid metabolism and toxicity | 4 |
| WP480 | T-cell receptor signaling pathway | 4 |
| WP1261 | ErbB signaling pathway | 4 |
| WP2087 | miRNA regulation of DNA damage response | 4 |
| WP79 | Tryptophan metabolism | 3 |
| WP190 | Cell cycle | 3 |
| WP216 | Striated muscle contraction | 3 |
| WP387 | IL-6 signaling pathway | 3 |
| WP434 | TCA cycle | 3 |
| WP488 | α6-β4 integrin signaling pathway | 3 |
| WP493 | MAPK signaling pathway | 3 |
| WP662 | Amino acid metabolism | 3 |
| WP1251 | Metapathway biotransformation | 3 |
| WP1254 | Apoptosis | 3 |
| WP1262 | Aflatoxin B1 metabolism | 3 |
| WP1267 | Senescence and autophagy | 3 |
| WP1271 | Toll-like receptor signaling pathway:KEGG | 3 |
| WP1983 | Splicing factor NOVA-regulated synpatic proteins | 3 |
| WP2185 | Purine metabolism:KEGG-mmu00230 | 3 |
| WP2292 | Chemokine signaling pathway:KEGG-mmu04062 | 3 |
| WP88 | Toll-like receptor signaling | 2 |
| WP93 | IL-4 signaling pathway | 2 |
| WP151 | IL-5 signaling pathway | 2 |
| WP163 | Cytoplasmic ribosomal proteins | 2 |
| WP193 | Signaling of hepatocyte growth factor receptor | 2 |
| WP232 | G Protein signaling pathways | 2 |
| WP240 | Alanine and aspartate metabolism | 2 |
| WP258 | TGF-β receptor signaling pathway | 2 |
| WP297 | IL-7 signaling pathway | 2 |
| WP336 | Fatty acid biosynthesis | 2 |
| WP339 | ESC pluripotency pathways | 2 |
| WP350 | p38 MAPK signaling pathway (BioCarta) | 2 |
| WP413 | G1 to S cell cycle control | 2 |
| WP447 | Adipogenesis | 2 |
| WP450 | IL-2 signaling pathway | 2 |
| WP458 | Inflammatory response pathway | 2 |
| WP519 | Proteasome degradation | 2 |
| WP523 | Regulation of actin cytoskeleton | 2 |
| WP544 | Circadian exercise | 2 |
| WP571 | FAS pathway and stress induction of HSP regulation | 2 |
| WP723 | Wnt signaling pathway and pluripotency | 2 |
| WP730 | Glutathione and one carbon metabolism | 2 |
| WP1244 | Estrogen signalling | 2 |
| WP1249 | EPO receptor signaling | 2 |
| WP1264 | Estrogen metabolism | 2 |
| WP1270 | Endochondral ossification | 2 |
| WP1274 | Cytochrome P450 | 2 |
| WP1496 | Oxidative damage | 2 |
| WP1560 | MicroRNAs in cardiomyocyte hypertrophy | 2 |
| WP1770 | One carbon metabolism and related pathways | 2 |
| WP2074 | Neural crest differentiation | 2 |
| WP2310 | PodNet: protein-protein interactions in the podocyte | 2 |
| WP2316 | PPAR signaling pathway:KEGG-mmu03320 | 2 |
| WP2432 | Spinal cord injury | 2 |
Discussion
UAGT to the salivary gland presents a unique model system in which to answer fundamental questions of nonviral vectorology. The salivary gland is an epithelium-derived, encapsulated structure that communicates with the oral cavity via the salivary duct. This anatomy facilitates delivery of gene transfer material via bloodless cannulation of the salivary duct and retrograde infusion. Because the contents of the intraductal labyrinth of the salivary gland can be controlled by external manipulation, we are able to precisely control the gene transfer conditions. This in turn allows us to parse out the effects on organ physiology of various viral and nonviral vectors using sonoporation. We previously utilized this technique to examine the effect of adeno-associated virus-mediated gene transfer on the mouse salivary gland proteome19 and documented profound global proteomic alterations that were dose dependent, even in the absence of extracellular inflammatory host response.
We were initially surprised to find that sonoporation alone, without the addition of a gene transfer vector, had minimal effects upon the proteome of the salivary gland. We had assumed that the inertial cavitation phenomenon underlying sonoporation would have substantial short-term effects upon membrane physiology and possibly structural proteins, even though we have documented that UAGT does not cause overt histological damage to the salivary gland. Nevertheless, our observation that sonoporation alone does not substantially alter the proteome presents a unique opportunity to study organ responses to various nonviral vectors, specifically first-generation plasmids and minicircles, in isolation from other confounding factors.
The limitations of gel-based proteomic profiling have been described11 and include the following: (i) failure to visualize high pI proteins, (ii) a focus on magnitude of change in spot intensity, which will not detect small but potentially important changes in proteins such as phosphorylation of G proteins, and (iii) inability to visualize hydrophobic (e.g., membrane-associated) or highly glycosylated proteins. Thus, our results are best viewed as the selected pieces of a much larger puzzle that implicate some pathways in the host response to plasmid vectors but may not detect all pathways of importance. These limitations notwithstanding, there is no doubt that these results accurately reflect the relative magnitude of proteomic alterations following plasmid versus minicircle gene transfer, and these results implicate the plasmid backbone, whether due to its size, sequence, or both, as a major stimulator of innate immunity even in the absence of viral antigens. It should be noted that while efforts were made to ensure that the plasmid and the minicircle vector were as isogenic as possible, with the sequence differing only in the backbone region, they were prepared in different Escherichia coli lines, raising the possibility that methylation patterns and secondary structure may differ between the two vectors.
In instances where our analysis revealed clustering of our identified proteins in common pathways, the convergence was upon innate immunity, including most prominently Type 2 interferon, tumor necrosis factor-α/NF-κB, and Wnt. Additional innate signaling pathways implicated were interleukins 2, 3, 4, 5, 6, and 7, as well as Toll-like receptor signaling. Our findings may be considered relative to an earlier study by Mann et al.21 that documented changes in gene expression 1, 4, 7, and 14 days following gene electrotransfer to muscle tissue. Mann et al. also reported upregulation of Type 2 interferon and a number of interleukins (2, 6, and 12) following plasmid electrotransfer, a finding that is consistent with our results and may reflect the downstream gene expression consequences of the early proteomic changes that we have described. Notably, Mann et al. also reported that the effects of electroporation with a plasmid vector present were ~20-fold greater than electroporation alone, strikingly similar to our observations. The identities of proteins identified as being substantially altered as a result of UAGT with first-generation plasmid vectors, but not with minicircle vectors, present an interesting albeit incomplete picture of intracellular host response to nonviral vectors that highlights innate immune response and morphogenesis.
It should be appreciated that the present state of open-source pathway analysis in proteomics is extremely limited, with Wikipathways only coming online in 2008. In fact, of the 237 proteins (Table 1) identified as significantly altered between naive salivary gland and salivary gland following UAGT with a first-generated plasmid vector, only a few dozen were classified to known Wikipathways by the GO-ELITE analysis. Of these, a clear signaling cascade could be observed in only two cases, that of the Sos1-Hras1-Araf axis (leading to MEK/ERK activation)22 and the TRIF-Traf3-IKKepsilon axis (stimulated by Tlr3/4 and leading to Irf3 activation).23 This demonstrates in stark detail both the power and limitations of whole-proteome profiling. With respect to the former, we can generate “hits”, allowing us to focus on implicated pathways for more nuanced analysis of cell biology. With respect to the latter, the vast majority of our data cannot yet be reduced to a known pathway and thus teaches us relatively little beyond a quantitative measure of the extent of global proteomic alteration stimulated by the plasmid backbone.
If we accept the premise that gene transfer should have the most minimal collateral effects upon the target tissue as possible, then these results clearly demonstrate advantages of minicircle vectors as gene transfer agents in the salivary gland, both with regard to gene transfer efficiency and what might be termed “intracellular toxicity”. Our group is developing a nonviral approach to attempt to mimic positive reports of therapeutic efficacy in a human clinical trial utilizing adenovirus-mediated gene transfer of aquaporin-1 to the salivary glands of humans suffering from radiation-induced xerostomia.24,25 In this effort, the translational relevance of these findings should be directly relevant to the design of nonviral vectors for salivary gland gene therapy. Further, a number of clinical trials involving plasmid-mediated gene transfer to such tissues as skin, muscle, and heart have shown promising results.26–29 It remains to be seen whether other organs or tissues show a similar intracellular reaction to plasmid vectors, but this seems likely to be the case, as Mann et al.21 suggest. Going forward, the clinical importance of these intracellular responses must be evaluated, particularly in applications requiring episodic readministration of plasmid-mediated gene transfer. The assumption that plasmid-mediated gene transfer has minimal impact upon the host immune response should be reconsidered, and a minimalist approach to vector construction (e.g., minicircles or mini-intronic plasmids)30 is appealing not just with regard to expression duration but also with regard to potential tissue toxicity.
Materials and Methods
Animals
All animal studies were conducted at Allegheny General Hospital, Pittsburgh, PA and were approved by the Institutional Animal Care and Use Committee. Wild-type C57/BL6 animals were bred at Allegheny General Hospital and male mice were used for all studies.
Construction and preparation of vectors
The pGL3-enhancer vector was purchased from Promega (Madison, WI) and a canonical CMV promoter was inserted in the multiple cloning site. The entire expression cassette, including promoter, luciferase open reading frame, polyA, and enhancer were subcloned into the pAAV-MCS (Stratagene, La Jolla, CA) vector, resulting in pCMV-GL3enh. The expression cassette was then excised from pCMV-GL3enh and ligated into the pMC.BESPX-MCS1 vector (System Biosciences, Mountain View, CA; #MN100A-1), resulting in pMC-CMV-GL3enh (both vectors shown in Figure 1a). Full sequence information for both of these vectors is provided in the Supplementary Material. Minicircle construction was performed in the ZYCY10P3S2T bacterial strain per manufacturer’s instructions. Both vectors were prepared for experiments by purification using CsCl gradient centrifugation. Absorbance ratios were 1.89 (260/280) and 1.86 (260/230) for the plasmid and 1.98 (260/280) and 1.47 (260/230) for the minicircle. Endotoxin levels were measured in the final preps using a ToxinSensor kit (GenScript, Piscataway, NJ) according to manufacturer’s instructions. Endotoxin levels in the plasmid and minicircle were 0.082 and 0.041 EU/ml, respectively and did not differ substantially from a plasmid purified using a PureYield Plasmid Mini kit (0.097 EU/ml) including the endotoxin removal step (Promega, Madison, WI).
UAGT to salivary glands
UAGT was performed as previously described.8 Briefly, the submandibular duct was cannulated bilaterally and a 50 µl solution containing 15% v/v Definity microbubbles and 1 g/l of plasmid vector (or the equimolar equivalent of minicircle vector) in phosphate-buffered saline (PBS) was infused. Bubbles were destroyed by 4 × 30 seconds bursts from a Sonigene device (Visualsonics, Toronto, ON, Canada) set for 1 MHz, 50% duty cycle, and 2 W/cm2, with 10 seconds between pulses. Following the four pulses, the emitter was withdrawn and the animal allowed to rest for 10 minutes before the catheter was removed.
Bioluminescent imaging
Mice were anesthetized and injected intraperitoneally with the D-Luciferin substrate (Caliper Life Sciences, Hopkinton, MA) at a dose of 150 mg/10 g body weight. The mice were then placed in the IVIS Lumina II chamber containing a cryogenically cooled charge-coupled device camera to quantify photons spontaneously emitted by the animal. A standardized area-of-interest centered on the salivary gland was applied and total flux within this area was quantified as the average photons emitted/second/cm2 over a 60-second sampling period.
Histological analysis
A cohort of animals (n = 6) underwent UAGT with a plasmid encoding human α-1-antitrypsin and were sacrificed 48 hours later and salivary gland removed and fixed in 5% paraformaldehyde in PBS pH 7.4 overnight. After processing for paraffin embedding, slices of 5 µm were cut per sample. The tissues were then deparaffinized and rehydrated. Hydrated tissues were subjected to antigen retrieval by incubating in 20 g/l proteinase K in buffer TE pH 8.0 at 37 °C during 10 minutes. The endogenous peroxidase was quenched for 10 minutes using 3% H2O2 in methanol followed by washing in PBS buffer pH 7.4. Prior to incubation with primary antibody, the sections were blocked with 10% fetal bovine serum, 04% saponin, 0.02% NaN3 in PBS buffer pH 7.4. A rabbit anti-A1AT polyclonal antibody (Dako, Glostrup, Denmark) diluted 1/800 in blocking buffer was incubated with the sections overnight at 4 °C. After a PBS wash step to remove unbound antibody, the detection of the primary antibody was realized using Histostain Plus 3rd Gen IHC detection kit (Invitrogen, Carlsbad, CA). Before mounting in CitraMount medium, the nuclei were counterstained with Mayer’s hematoxylin. The slides were scanned in a VS120 microscope slide scanner (Olympus, Japan) and pictures were taken using an objective of ×20 and ×40. For the histopathological analysis, the deparaffinized sections were stained using hematoxylin/eosin following standard procedures.
Proteomic profiling using 2-D difference gel electrophoresis
Twenty-four hours after UAGT, animals were sacrificed and salivary glands were harvested and homogenized in ice-cold T-PER (Pierce, Rockford, IL) with a protease inhibitor cocktail (Roche Diagnostics, Mannheim, Germany). Difference gel electrophoresis analysis was performed as previously described in detail.19 Technical details of difference gel electrophoresis analysis were duplicated exactly as described in this earlier report, including dye swapping and manual quality control of DeCyder output. Figure 4 graphically illustrates the workflow of the proteomic profiling technique.
Image analysis
Gel analysis was performed using DeCyder DIA and BVA engines (GE Healthcare, Piscataway, NJ), a 2-D gel analysis software package designed specifically for the analysis of multiple difference gel electrophoresis experiments. This software package utilizes proprietary software to manage background subtraction, in-gel normalization, gel artifact removal, gel-to-gel matching, and statistical analysis. Manual input is restricted to setting threshold, P values, and manual spot checking as a final quality-control step to ensure that automated exclusion and inclusion of spots is appropriate. The estimated number of spots for each codetection procedure was set to 4,000. As recommended, an exclusion filter was applied to remove spots with a slope greater than one in order to reject spots that were likely to be contaminated with dust particles. A fixed value of 2.0 (±2) was used as the threshold to determine differentially expressed proteins, and P values were set at <0.05 to determine statistically significant differences between groups.
Protein spot extraction and identification
Based upon DeCyder analysis, 378 spots were chosen for extraction from the gels using an Ettan Spot Piker automated robot arm. This device integrates with the DeCyder software and allows precise extraction of spots-of-interest without manual input. Extracted spots were then in-gel digested. Briefly, gel slices (1.4 mm in diameter) were soaked in 200 µl of 25 mmol/l ammonium bicarbonate and incubated at room temperature for 15 minutes. The supernatant was removed and discarded and this step was repeated three times. Next, gel slices were immersed in 200 µl 100% acetonitrile and incubated at room temperature for 30 seconds. The supernatant was removed and discarded. Remaining liquid in the gel pieces was removed by SpeedVac for 5 minutes and then rehydrated in trypsin-containing solution (Promega; #V5280) for 20 minutes at a concentration of 20 ng/ml and then covered above with 25 mmol/l ammonium bicarbonate. Protein was digested at 37 °C overnight (16–18 hours). Tryptic peptides were extracted from gel slices using 0.2 µl C18 resin ZipTip procedure (EMD Millipore, Billerica, MA; #ZTC18M960) according to manufacturer’s protocol. Final extract was eluted with TA30 solvent (30:70 [v/v] acetonitrile: 0.1% trifluoroacetic acid in water) containing a-cyano-4-hydroxycinnamic acid at 10 mg/ml (Bruker Daltonik GmbH, Bremen, Germany; #255344) and applied on ground steel matrix-assisted laser desorption target plate. A Bruker matrix-assisted laser desorption/ionization time-of-flight ultraflextreme mass spectrometer was used to characterize the protein fingerprint spectra. Spectra were queried on an in-house MASCOT server to determine protein identities, and estimated pI and molecular weight were determined from gels and considered in positively identifying proteins where spectra alone identified multiple identity candidates.
Pathway and protein function analysis
GO-Elite (http://www.genmapp.org/go_elite) was used for the integration of identified proteins with biomolecular interaction networks (WikiPathways).31 All calculations and visual integration of the network with expression profiles (the final gene list) was done with probe sets at P < 0.05. For the interpretation, crosschecking, and visualization of the data, we also used AmiGO Term Enrichment and GO Slimmer (http://www.geneontology.org), GO Term Finder Cluster, and Tree View to perform cluster analysis using Euclidean distance algorithms of log-transformed, normalized raw data.
Acknowledgments
This work was supported by National Institutes of Health grants 5R03DE020118 and 1R01DE022973 (to M.J.P.). The authors wish to thank Alexander Zambon and Nathan Salomonis for their assistance with the GO-Elite pathway analysis software.
The authors declare no conflicts of interest.
References
- Nathwani AC, Tuddenham EG, Rangarajan S, Rosales C, McIntosh J, Linch DC. Adenovirus-associated virus vector-mediated gene transfer in hemophilia B. N Engl J Med. 2011;365:2357–2365. doi: 10.1056/NEJMoa1108046. [DOI] [PMC free article] [PubMed] [Google Scholar]
- Miller JW. Preliminary results of gene therapy for retinal degeneration. N Engl J Med. 2008;358:2282–2284. doi: 10.1056/NEJMe0803081. [DOI] [PubMed] [Google Scholar]
- Hacein-Bey-Abina S, Hauer J, Lim A, Picard C, Wang GP, Berry CC. Efficacy of gene therapy for X-linked severe combined immunodeficiency. N Engl J Med. 2010;363:355–364. doi: 10.1056/NEJMoa1000164. [DOI] [PMC free article] [PubMed] [Google Scholar]
- Shayakhmetov DM, Di Paolo NC, Mossman KL. Recognition of virus infection and innate host responses to viral gene therapy vectors. Mol Ther. 2010;18:1422–1429. doi: 10.1038/mt.2010.124. [DOI] [PMC free article] [PubMed] [Google Scholar]
- Muruve DA. The innate immune response to adenovirus vectors. Hum Gene Ther. 2004;15:1157–1166. doi: 10.1089/hum.2004.15.1157. [DOI] [PubMed] [Google Scholar]
- Zaiss AK, Liu Q, Bowen GP, Wong NC, Bartlett JS, Muruve DA. Differential activation of innate immune responses by adenovirus and adeno-associated virus vectors. J Virol. 2002;76:4580–4590. doi: 10.1128/JVI.76.9.4580-4590.2002. [DOI] [PMC free article] [PubMed] [Google Scholar]
- Vandermeulen G, Marie C, Scherman D, Préat V. New generation of plasmid backbones devoid of antibiotic resistance marker for gene therapy trials. Mol Ther. 2011;19:1942–1949. doi: 10.1038/mt.2011.182. [DOI] [PMC free article] [PubMed] [Google Scholar]
- Passineau MJ, Zourelias L, Machen L, Edwards PC, Benza RL. Ultrasound-assisted non-viral gene transfer to the salivary glands. Gene Ther. 2010;17:1318–1324. doi: 10.1038/gt.2010.86. [DOI] [PubMed] [Google Scholar]
- Bao S, Thrall BD, Miller DL. Transfection of a reporter plasmid into cultured cells by sonoporation in vitro. Ultrasound Med Biol. 1997;23:953–959. doi: 10.1016/s0301-5629(97)00025-2. [DOI] [PubMed] [Google Scholar]
- Mastrangeli A, O’Connell B, Aladib W, Fox PC, Baum BJ, Crystal RG. Direct in vivo adenovirus-mediated gene transfer to salivary glands. Am J Physiol. 1994;266 6 Pt 1:G1146–G1155. doi: 10.1152/ajpgi.1994.266.6.G1146. [DOI] [PubMed] [Google Scholar]
- Rabilloud T, Chevallet M, Luche S, Lelong C. Two-dimensional gel electrophoresis in proteomics: Past, present and future. J Proteomics. 2010;73:2064–2077. doi: 10.1016/j.jprot.2010.05.016. [DOI] [PubMed] [Google Scholar]
- Chen ZY, He CY, Ehrhardt A, Kay MA. Minicircle DNA vectors devoid of bacterial DNA result in persistent and high-level transgene expression in vivo. Mol Ther. 2003;8:495–500. doi: 10.1016/s1525-0016(03)00168-0. [DOI] [PubMed] [Google Scholar]
- Kay MA, He CY, Chen ZY. A robust system for production of minicircle DNA vectors. Nat Biotechnol. 2010;28:1287–1289. doi: 10.1038/nbt.1708. [DOI] [PMC free article] [PubMed] [Google Scholar]
- Chabot S, Orio J, Schmeer M, Schleef M, Golzio M, Teissié J. Minicircle DNA electrotransfer for efficient tissue-targeted gene delivery. Gene Ther. 2013;20:62–68. doi: 10.1038/gt.2011.215. [DOI] [PubMed] [Google Scholar]
- Deng CX, Sieling F, Pan H, Cui J. Ultrasound-induced cell membrane porosity. Ultrasound Med Biol. 2004;30:519–526. doi: 10.1016/j.ultrasmedbio.2004.01.005. [DOI] [PubMed] [Google Scholar]
- Zhou Y, Kumon RE, Cui J, Deng CX. The size of sonoporation pores on the cell membrane. Ultrasound Med Biol. 2009;35:1756–1760. doi: 10.1016/j.ultrasmedbio.2009.05.012. [DOI] [PMC free article] [PubMed] [Google Scholar]
- Qiu Y, Luo Y, Zhang Y, Cui W, Zhang D, Wu J. The correlation between acoustic cavitation and sonoporation involved in ultrasound-mediated DNA transfection with polyethylenimine (PEI) in vitro. J Control Release. 2010;145:40–48. doi: 10.1016/j.jconrel.2010.04.010. [DOI] [PubMed] [Google Scholar]
- Zhou Y, Yang K, Cui J, Ye JY, Deng CX. Controlled permeation of cell membrane by single bubble acoustic cavitation. J Control Release. 2012;157:103–111. doi: 10.1016/j.jconrel.2011.09.068. [DOI] [PMC free article] [PubMed] [Google Scholar]
- Geguchadze RN, Machen L, Zourelias L, Gallo PH, Passineau MJ. An AAV2/5 vector enhances safety of gene transfer to the mouse salivary gland. J Dent Res. 2012;91:382–386. doi: 10.1177/0022034512437373. [DOI] [PMC free article] [PubMed] [Google Scholar]
- Zambon AC, Gaj S, Ho I, Hanspers K, Vranizan K, Evelo CT. GO-Elite: a flexible solution for pathway and ontology over-representation. Bioinformatics. 2012;28:2209–2210. doi: 10.1093/bioinformatics/bts366. [DOI] [PMC free article] [PubMed] [Google Scholar]
- Mann CJ, Anguela XM, Montané J, Obach M, Roca C, Ruzo A. Molecular signature of the immune and tissue response to non-coding plasmid DNA in skeletal muscle after electrotransfer. Gene Ther. 2012;19:1177–1186. doi: 10.1038/gt.2011.198. [DOI] [PubMed] [Google Scholar]
- Roberts PJ, Der CJ. Targeting the Raf-MEK-ERK mitogen-activated protein kinase cascade for the treatment of cancer. Oncogene. 2007;26:3291–3310. doi: 10.1038/sj.onc.1210422. [DOI] [PubMed] [Google Scholar]
- O’Neill LA, Bowie AG. The family of five: TIR-domain-containing adaptors in Toll-like receptor signalling. Nat Rev Immunol. 2007;7:353–364. doi: 10.1038/nri2079. [DOI] [PubMed] [Google Scholar]
- Baum BJ, Alevizos I, Zheng C, Cotrim AP, Liu S, McCullagh L. Early responses to adenoviral-mediated transfer of the aquaporin-1 cDNA for radiation-induced salivary hypofunction. Proc Natl Acad Sci USA. 2012;109:19403–19407. doi: 10.1073/pnas.1210662109. [DOI] [PMC free article] [PubMed] [Google Scholar]
- Baum BJ, Zheng C, Alevizos I, Cotrim AP, Liu S, McCullagh L. Development of a gene transfer-based treatment for radiation-induced salivary hypofunction. Oral Oncol. 2010;46:4–8. doi: 10.1016/j.oraloncology.2009.09.004. [DOI] [PMC free article] [PubMed] [Google Scholar]
- Penn MS, Mendelsohn FO, Schaer GL, Sherman W, Farr M, Pastore J. An open-label dose escalation study to evaluate the safety of administration of nonviral stromal cell-derived factor-1 plasmid to treat symptomatic ischemic heart failure. Circ Res. 2013;112:816–825. doi: 10.1161/CIRCRESAHA.111.300440. [DOI] [PubMed] [Google Scholar]
- Makino H, Aoki M, Hashiya N, Yamasaki K, Azuma J, Sawa Y. Long-term follow-up evaluation of results from clinical trial using hepatocyte growth factor gene to treat severe peripheral arterial disease. Arterioscler Thromb Vasc Biol. 2012;32:2503–2509. doi: 10.1161/ATVBAHA.111.244632. [DOI] [PubMed] [Google Scholar]
- Vardas E, Stanescu I, Leinonen M, Ellefsen K, Pantaleo G, Valtavaara M. Indicators of therapeutic effect in FIT-06, a Phase II trial of a DNA vaccine, GTU(®)-Multi-HIVB, in untreated HIV-1 infected subjects. Vaccine. 2012;30:4046–4054. doi: 10.1016/j.vaccine.2012.04.007. [DOI] [PubMed] [Google Scholar]
- Heller LC, Heller R. Electroporation gene therapy preclinical and clinical trials for melanoma. Curr Gene Ther. 2010;10:312–317. doi: 10.2174/156652310791823489. [DOI] [PubMed] [Google Scholar]
- Lu J, Zhang F, Kay MA. A mini-intronic plasmid (MIP): a novel robust transgene expression vector in vivo and in vitro. Mol Ther. 2013;21:954–963. doi: 10.1038/mt.2013.33. [DOI] [PMC free article] [PubMed] [Google Scholar]
- Pico AR, Kelder T, van Iersel MP, Hanspers K, Conklin BR, Evelo C. WikiPathways: pathway editing for the people. PLoS Biol. 2008;6:e184. doi: 10.1371/journal.pbio.0060184. [DOI] [PMC free article] [PubMed] [Google Scholar]
Associated Data
This section collects any data citations, data availability statements, or supplementary materials included in this article.