

Abstract
Emergence of SIV and HIV specific CD8 T cells has been shown to correlate with control of in vivo replication. Poor correlation between IFN-γ ELISPOT responses and in vivo control of the virus has triggered the development of more relevant assays to assess functional HIV-1 specific CD8 T-cell responses for the evaluation and prioritization of new HIV-1 vaccine candidates. We previously established a viral inhibition assay (VIA) that measures the ability of vaccine-induced CD8 T-cell responses to inhibit viral replication in autologous CD4 T cells. In this assay, viral replication is determined by measuring p24 in the culture supernatant. Here we describe the development of a novel VIA, referred to as IMC LucR VIA that exploits replication-competent HIV-1 infectious molecular clones (IMCs) in which the complete proviral genome is strain-specific and which express the Renilla luciferase (LucR) gene to determine viral growth and inhibition. The introduction of the luciferase readout does provide significant improvement of the read out time. In addition to switching to the LucR read out, changes made to the overall protocol resulted in the miniaturization of the assay from a 48 to a 96-well plate format, which preserved sample and allowed for the introduction of replicates. The overall assay time was reduced from 13 to 8 days. The assay has a high degree of specificity, and the previously observed non-specific background inhibition in cells from HIV-1 negative volunteers has been reduced dramatically. Importantly, we observed an increase in positive responses, indicating an improvement in sensitivity compared to the original VIA. Currently, only a limited number of “whole-genome” IMC-LucR viruses are available and our efforts will focus on expanding the panel to better evaluate anti-viral breadth. Overall, we believe the IMC LucR VIA provides a platform to assess functional CD8 T-cell responses in large-scale clinical trial testing, which will enhance the ability to select the most promising HIV-1 vaccine candidates capable of controlling HIV-1 replication in vivo.
Keywords: HIV, clinical trial, Vaccine, CD8 T cells, Viral Inhibition Assay, Renilla reniformis luciferase, Infectious molecular clones
1. Introduction
The emergence of specific CD8 T cells have been shown to correlate with in vivo control of HIV and SIV replication (Koup et al., 1994; Harrer et al., 1996; Goulder et al., 1997; Cohen et al., 2011). These observations suggest that a functional HIV-1 vaccine aimed at inducing a protective immune response should elicit an effective CD8 T-cell response. Therefore, standardizable assays that assess HIV-1 specific CD8 effector T-cell responses elicited by vaccine immunogens are important for evaluating HIV-1 vaccine candidates, especially in early phase clinical trials, as a means to help select the most promising candidates. The IFN-γ enzyme-linked immunospot (ELISPOT) assay is most commonly used to determine HIV-1 specific CD8 T-cell responses. However, the expression of cytokines such as IFN-γ, as measured in the ELISPOT assay, are an indirect measure of CD8 T-cell induced inhibition of HIV-1 replication. Moreover, the requirement of the ELISPOT assay for high levels of exogenous peptides limits evaluation of overall HIV-1 responses (Bennett et al., 2008; Valentine et al., 2008). Recent studies have revealed a poor correlation between IFN-γ ELISPOT responses and in vivo control of HIV-1 replication (Lieberman, 2004; Valentine et al., 2008; Gray et al., 2009). Together these observations illustrate the need for an in vitro assay that correlates better with HIV-1 specific effector CD8 T-cell responses in vivo.
We and others have previously developed a viral inhibition assay (VIA) that measured inhibition of HIV-1 in infected CD4 T cells in co-culture with autologous CD8 T cells, in vitro. (Gauduin et al., 1998; Loffredo et al., 2005; Fauce et al., 2007; Tsukamoto et al., 2007; Chen et al., 2009; Saez-Cirion et al., 2010; Spentzou et al., 2010; Akinsiku et al., 2011; Freel et al., 2012; Yamamoto et al., 2012). The observed inhibition of HIV-1 replication could be the result of HIV-1 specific major histocompatibility complex (MHC) dependent cytolytic CD8 T-cell activity (Toso et al., 1995; Yang et al., 1997; Migueles et al., 2008) as well as noncytolytic mechanisms (Walker et al., 1991; Cocchi et al., 1995; Tomaras et al., 2000; Freel et al., 2012) or a combination of both. The VIA has the potential to measure the overall viral suppression induced by a combination of both mechanisms, which results in a more relevant readout of HIV-1 specific CD8 T cell responses than the IFN-γ ELISPOT. In addition, using a panel of viruses in the VIA allows for the assessment of the breadth of suppression.
The VIA protocol varies between different laboratories although most commonly the amount of de novo produced HIV p24 or SIV p27 concentration in the culture supernatant of in vitro infected CD4 T-cells is determined by ELISA as a measurement of viral replication or inhibition in the presence of CD8 T-cells (Gauduin et al., 1998; Fauce et al., 2007; Tsukamoto et al., 2007; Chen et al., 2009; Spentzou et al., 2010; Yamamoto et al., 2012). Other methods to determine viral inhibition include p24 intracellular staining (ICS) (Loffredo et al., 2005; Saez-Cirion et al., 2010) or indirect measurements, such as luciferase expression after infection of TZM-bl cells with the VIA culture supernatants (Akinsiku et al., 2011; Freel et al., 2012).
Our initial efforts have focused on the development of a VIA that determines the p24 release in cell culture supernatant as a measure of HIV-1 replication, and this assay has proven valuable for testing samples from several HIV-1 vaccine trials (Spentzou et al., 2010; Hayes et al., 2013; N Borthwick et al. manuscript in preparation). However, we recognized certain limitations and thus pursued technological advances towards the development and optimization of a second generation VIA, referred to throughout the manuscript as the IMC LucR VIA. The goal was to reduce the number of cells needed, increase assay sensitivity and specificity, and decrease time and overall cost to perform the assay. The international AIDS Vaccine Initiative (IAVI) in collaboration with the Collaboration for AIDS Vaccine Discovery (CAVD) funded consortia, the Comprehensive T Cell Vaccine Immune Monitoring Consortium (CT-VIMC) and the Comprehensive Antibody Vaccine Immune Monitoring Consortium (CA-VIMC) achieved this goal through the combination of our VIA assay platform (developed within IAVI) with enabling Renilla reniformis luciferase (LucR) reporter HIV-1 technology (developed within CHAVI). We previously described and validated a LucR reporter HIV-1 approach utilizing an NL4-3 proviral backbone expressing LucR (NL-LucR.T2A), and encoding heterologous env gene sequences of choice (Edmonds et al., 2010; Montefiori et al., 2012). While utility of NL-LucR.T2A-based replicating reporter viruses (collectively referred to as Env-IMC-LucR) in the VIA has been demonstrated (Freel et al., 2010), this approach was limited by the isogenic nature of these viruses outside of env; thus, strain-specific differences in VIA responses mapped solely to the different heterologous envelope genes. In the work presented here, we thus utilized a novel LucR expressing, replication-competent infectious molecular clone (IMC) which encompasses the full-length strain-specific genome of the transmitted/founder (T/F) HIV-1, CH077.t, which we recently described (Ochsenbauer et al., 2012). Application of CH077.t-LucR, and similarly constructed relevant strains of reporter allow the comparison of VIA responses against all viral genes, therefore allowing a much broader comparison of CD8 T cell responses between different samples tested.
This manuscript describes the successful development of the IMC LucR VIA by implementing a fast, less labor intensive and more cost effective luciferase read out. Optimization of the assay allowed for miniaturization from a 48 well to a 96-well plate format, allowing for the introduction of replicates. The IMC LucR VIA exhibits high specificity and a significantly reduced non-specific background inhibition, enhancing the interpretation of the assay which is important for the implementation into HIV-1 vaccine trials.
2. Material and Methods
2.1. Cells
TZM-bl cells were obtained from the NIH AIDS Research and Reference Reagent program (NIH ARRRP) (ARP5011), as contributed by John Kappes and Xiaoyun Wu. 293T/17 cells were obtained from the American type culture collection (ATCC) (CRL11268). Both cell lines were maintained in Dulbecco's modified Eagle's medium (DMEM) with 10% heat inactivated fetal bovine serum (FBS) (Sigma, UK), penicillin (100U/ml) (Sigma, UK) and streptomycin (100U/ml) (Sigma, UK).
PBMCs were isolated by density centrifugation and frozen in 10% dimethylsulphoxide (DMSO) (Sigma, UK) / 90% FBS and stored in vapour phase liquid nitrogen. PBMCs were cultured in RPMI 1640 containing 30U/ml recombinant human IL-2 (Roche, Germany), penicillin (100U/ml) and streptomycin (100U/ml). All samples were collected under informed consent and studies were approved by the relevant local ethics committees. Samples in London were stored in a Human Tissue Act (HTA) registered Biorepository (License 12560). PBMCs from long term non progressors (LTNP) and elite controllers (EC) were kindly provided by Bruce Walker, Harvard, Boston, USA. HIV-1 positive PBMCs were provided by Dr. O. Anzala, Kenya AIDS Vaccine Initiative from patient with plasma viral load below 10,000 copies/ml and ART untreated for a minimum of six months. The HIV-1 sero-negative PBMCs were obtained from South African National Blood Transfusion Services, South Africa. The HIV-1 vaccine trial samples are of two clinical trials conducted by IAVI and/or collaborators with vectors expressing a variety of HIV-1 genes (Jaoko et al., 2010; N Borthwick et al. manuscript in preparation).
2.2. Proviral plasmid construction
We have previously described the construction of NL-LucR.T2A and NL-LucR.T2ACH077.ecto (Edmonds et al., 2010) in which the Renilla reniformis luciferase reporter gene (GenBank accession AF362549) was introduced into the HIV-1 lab strain NL4.3 genome in between the env and nef genes, followed by a T2A self-cleavage site.
We previously generated the clade B T/F IMC, CH077.t (Ochsenbauer et al., 2012), which represents the proviral genome sequence of the HIV-1 founder virus that established clinical infection in subject 700010077 from the CHAVI-001 Acute Infection Cohort (Salazar-Gonzalez et al., 2009). We introduced the LucR-T2A reporter gene cassette to generate CH077.t-LucR.T2A, essentially mirroring the molecular design for NL-LucR.T2A. Briefly, we identified suitable unique restriction sites upstream of the env gene (EcoRI, nt 5770) and downstream of nef (MluI, in the plasmid vector sequence adjacent to the end of the 3′ LTR) and designed forward and reverse primers, respectively, just 5′ and just 3′ of these sites (Fwd.Eco; Rev.Mlu). We furthermore designed a reverse primer overlapping the 3′ end of env, and extending the sequence to include an NheI and XbaI site (Rev. Nhe-Xba.env), essentially as described previously. A forward primer (Fwd.Nhe-Xba.nef) overlapping with nef and introducing the same sites 5′ of the nef ATG was also designed; these reverse and forward primers overlapped in the sequence containing the NheI and XbaI sites. We then amplified the fragments including env and nef, respectively, using pCH077.t as template DNA, and subjected the amplicons to a fusion PCR reaction utilizing primers Fwd.Eco and Rev. Mlu. The resulting amplicon spanning from EcoRI through env, the Nhe-Xba linker, nef, the 3′LTR, to MluI was then TA-cloned into pCR4-TOPO cloning vector (Invitrogen). We then excised the LucR.T2A coding sequence from NL-LucR.T2A using the engineered NheI and XbaI restriction sites, and inserted it between the NheI and XbaI sites of the TA-cloned subgenomic fusion PCR amplicon cloning intermediate. After sequence confirmation, the entire EcoRI through MluI fragment encompassing the env-NheI-Kozak-LucR.T2A-Xba-nef cassette was excised and ligated into EcoRI/MluI digested pCH077.t. The entire proviral sequence of maxi-prepped plasmid DNA of pCH077.t-LucR.T2A was confirmed by sequencing reaction and trace analysis with Sequencher software (Gene Codes Corporation, Ann Arbor, MI).
2.3. Generation of virus stocks and determination of infectivity
All IMC virus stocks were generated by transfection of 293T/17 cells as previously described (Ozaki et al., 2012). In short 3-5×10⁶ 293T/17 cells were seeded in a T75 culture flask the day before transfection. Twelve microgram of DNA in DMEM was transfected using FuGENE 6 (Promega, UK) according to manufacturer's instructions. After 4 to 6 hours the transfection medium was replaced with fresh medium. The supernatant was harvested and filtered after 48 hours and aliquots were stored at −80°C until use.
The TCID50 of the generated virus stocks were determined as previously described (Ozaki et al., 2012). In short, 1×10⁵ TZM-bl cells per well were infected with a serial dilution of the virus stock in quadruplicate, starting with a 1/10 dilution in the presence of 10μg DEAE Dextran (Sigma, UK) per ml. Forty-eight hours later the firefly luciferase expressed by the TZM-bl cells was determined with Britelight Plus reagent (PerkinElmer, UK). The relative light units (RLU) were measured on an Infinite M200Pro plate reader (Tecan, UK). Alternatively, the virus stocks used to determine the replication kinetics (Fig 1) were also titered on the TZM-bl reporter cell line to determine infectious units/ ml by enumeration of β-galactosidase (β-gal) stained colonies as described previously (Wei et al., 2002).
Fig. 1.

Virus characterization. (A) Infection of HIV negative CD4 T cells with NL4.3, NLLucR.T2A, CH077.t and CH077.t-LucR T2A. P24 concentrations were determined in the culture supernatant (ELISA). (B) Infection kinetics of HIV negative CD4 T cells with NLLucR.T2A and CH077.t-LucR T2A using Renilla Luciferase activity in the cells as read-out at different time points during replication. (C & D) Determination of stability of Renilla luciferase expression relative to viral infectivity for luciferase containing IMCs. HIV negative CD4 T cells were infected with the luciferase containing virus and supernatant was collected at different time points (depicted on the X-axis). The supernatants were used to infect TZMbl cells. The ratio between virus-encoded Renilla and cell-encoded firefly luciferase (expressed by the TZMbl cells upon infection) is depicted. (C) NL-LucR.T2A (D) CH077.t-LucR T2A
2.4. Replication kinetics determination
Defrosted PBMCs were cultured as previously described (Spentzou et al., 2010) for 7 days at a concentration of 1 to 1.5×10⁶ cells/ml in RPMI 1640 containing 30U/ml recombinant human IL-2, penicillin (100U/ml) and streptomycin (100U/ml). CD3/CD8 bi specific antibodies (0.5μg/ml) (Wong and Colvin, 1987) were added to the culture medium to expand the CD4 T cell population. For each virus, 1.5×10⁶ of pooled and expanded CD4 T cells from 5 different HIV-1 negative donors were infected with 0.1 MOI (as based on the TCID50 determination) in a 24 well plate format. The CD4 T cells were pooled at 1:1 ratios based on the cell counts on the day of infection. After 4 hours of incubation at 37°C the supernatant was replaced with fresh medium. Supernatant was collected every 3 to 4 days and stored at −80°C and an equal volume of fresh medium was added to replenish the cultures. The concentration of p24 was determined by enzyme-linked immunosorbent assay (ELISA) (PerkinElmer, UK). The luciferase activity was determined by Renilla Glo luciferase assay system (Promega, UK) in accordance with manufacturer's instructions.
2.5. Determination of Renilla Luciferase stability
The stability of the Renilla reniformis luciferase reporter gene was determined as previously described (Edmonds et al., 2010). Briefly, 1.5×10⁶ pooled (5 different donors) CD4 T cells expanded by CD3/CD8 bi-specific antibodies (Wong and Colvin, 1987) as described above were infected with 0.1 MOI for each virus for a period of 13 days. Supernatant was collected at different time points after infection, cleared from cells by centrifugation, and stored at −80°C. TZM-bl cells were plated at a concentration of 1×10⁴ cells/well in a 96 well format and infected with different volumes of supernatant collected from the PBMC cultures (0.2, 1, 5 or 10μl) in the presence of 10μg/ml DEAE Dextran (Sigma, UK). After 4 hours of the supernatants were replaced with fresh medium after an additional 18 hours 5μM reverse transcriptase inhibitor Nevirapine (Sigma, UK) was added to all cultures. After an additional 18 hour of incubation the Renilla and firefly luciferase activity was determined by the Dual-Luciferase Reporter Assay System (Promega, UK) in accordance with manufacturer's instructions. The ratio between Renilla Luciferase and Firefly luciferase was determined and compared to the ratio of the stock used to infect the CD4 T cells, to assess the stability of the Renilla Luciferase gene in the viral genome over time.
2.6. First generation VIA p24 and luciferase read out
Defrosted PBMCs were cultured as previously described (Spentzou et al., 2010) for 7 days at a concentration of 1-1.5×10⁶ cells/ml in RPMI 1640 containing 30U/ml recombinant human IL-2, penicillin (100U/ml) and streptomycin (100U/ml). CD3/CD4 or CD3/CD8 bi specific antibodies (0.5μg/ml) (Wong and Colvin, 1987) were added to the culture medium to expend the CD8 or CD4 T-cell population, respectively. Fresh medium was added every 3 to 4 days. Half a million per well expanded CD4 T cell population were infected with IIIB produced on PBMCs or CH077.t IMC produced by transfection, at an MOI of 0.01 in a 48 well plate. The CD4 T cells were cultured over a period of 13 days with or without autologous CD8 T cells at a 1:1 ratio. Half of the culture supernatant was replaced by fresh medium every 3 to 4 days. Viral replication was determined 13 days post-infection by p24 ELISA (PerkinElmer). The log inhibition was determined by subtracting the log10 p24 concentration of the CD4 CD8 T cell co-culture from the log10 p24 concentration determined for the culture of CD4 T cells alone. Alternatively, expanded CD4 T cells were infected with, NL-LucR.T2A and CH077.tLucR.T2A at an MOI of 0.01. The cells were plated in triplicate wells at a concentration of 0.1×10⁶ cells per well in a 96 well format. The CD4 T cells were cultured alone or in the presence of autologous CD8 T cells at a 1:1 ratio. After 13 days 100μl supernatant was used to determine the p24 concentrations by ELISA (PerkinElmer) and the luciferase activity in the same well was determined by Renilla-Glo Luciferase assay system (Promega).
2.6. IMC LucR VIA
The CD8 and CD4 T cell population were generated and expanded over 7 days by the addition of bi-specific antibodies identical to the first generation VIA. On day 7 the CD4 cells were counted and infected with NL-LucR.T2A or CH077.t-LucR.T2A at an MOI of 0.01 (based on TZM-bl TCID50) by spinoculation (1,800×g, 2h, RT) at a cell concentration of 10×106 cells/ml in RPMI 1640 containing 30U/ml recombinant human IL-2, penicillin (100U/ml) and streptomycin (100U/ml). After the spinoculation fresh medium was added to dilute the cells to a concentration of 1×10⁶ cells/ml. On the same day, fresh medium was added to the expanded CD8 T-cells. Both the infected CD4 and CD8 were incubated for an additional 3 days at 37°C. Cells were then counted and 0.1×10⁶ infected CD4 T cells per well were seeded in triplicate in a 96 well format with or without CD8 T cells at a 1:1 ratio, unless indicated otherwise. Cells were then incubated for an additional 5 days. Luciferase activity was determined with the Renilla-Glo Luciferase assay system (Promega) as a measure of viral infection. The log inhibition was determined by subtracting the log10 relative light units (RLU) of the CD4 CD8 T cell co-culture from the log10 RLU determined for the culture of CD4 T cells alone.
3. Results
3.1. Virus characterization
Currently used VIA platforms have limitations with regard to cost, required sample volumes, time, sensitivity and specificity. To overcome these obstacles and develop a more efficient, sensitive and cost-effective VIA we introduced replication-competent Renilla luciferase reporter HIV-1 infectious molecular clones (IMC) to the VIA. Our rational was that the introduction of the NL-LucR.T2A-based Env-IMC-LucR viruses has greatly advanced applications in the HIV-1 neutralizing antibody field which faces similar challenges (Edmonds et al., 2010; Brown et al., 2012; Montefiori et al., 2012; Pace et al., 2013; McLinden 2013 manuscript in preparation), Env-IMC-LucR viruses have been used for proof of principle in CD8 VIA (Freel et al., 2010), which illustrates that VIA appropriate adaptation of the molecular approach can be achieved. We chose the IMC of clade B T/F HIV-1,CH077.t (Ochsenbauer et al., 2012), as a relevant HIV-1 strain to introduce the LucR reporter gene, and generated CH077.t-LucR.T2A. To determine the implications for the introduction of the reporter gene into the T/F IMC, we compared the replication curves of both LucR containing viruses with their parental the wild type viruses. P24 production in both LucR reporter viruses infected cultures was reduced compared to wild-type viruses after day three (Fig. 1A), indicating less efficient replication after the first round of infection, essentially as described (Edmonds et al., 2010). The LucR reporter viruses showed similar replication kinetics based on the p24 read out, which is confirmed by the replication curves based on the measurement of the LucR activity (Fig. 1B). The VIA involves several rounds of replication in CD4 T cells, therefore it was important to establish the stability of LucR gene expression over time since reduction of the LucR reporter activity due to elimination of the LucR gene from the proviral genome over time could negatively affect the interpretation of the IMC LucR VIA. Stability of the reporter gene was determined by infecting expanded CD4 T cells with the reporter viruses over a period of 13 days while supernatant was collected on day 7, 10 and 13. The supernatants were frozen at −80°C until used to infect TZM-bl cells, which express cell-encoded firefly luciferase upon HIV-1 infection thereby providing a means to normalize LucR levels to relative infectivity. Therefore, the ratio between Renilla and Firefly luciferase at different time points can be compared to the original virus stock ratio, to determine stability and retention of the LucR in the proviral genomes after several cycles of replication. Both NL-LucR.T2A and CH077.t-LucR.T2A (Fig. 1C & D, respectively) showed relatively stable RLU ratios even though a slight reduction of Renilla luciferase expression is observed at day 13, essentially as previously reported for NL-LucR.T2A (Edmonds et al., 2010) and illustrating that the LucR expression from both the NL-derived as well as the T/F IMC reporter virus is stable over the course of the IMC LucR VIA experiment. Even when CH077.t-LucR.T2A infected PBMC cultures were followed for 31 days, reduction of the Renilla Luciferase RLU to Firefly luciferase RLU ratio at the end point was only about 4-fold, and about 20% by day 12 and 18 (data not shown).
3.2. Correlation between the p24 and LucR read out
Comparison of the replication kinetics in CD4 T cells in the presence or absence of CD8 T cells was performed for the two reporter viruses in a panel of PBMCs obtained from HIV-1 negative, HIV-1 positive long term non-progressor (LTNP) and elite controller (EC) volunteers in the first generation VIA with the LucR read-out. Representative replication curves obtained using both the p24 and Luciferase read out are shown in figure 2A-D for the infection of cells from one HIV-1 positive LTNP and one HIV-1 negative donor with CH077.t-LucR.T2A. The replication curves in CD4 T cells derived from a HIV-1 positive LTNP in the absence or presence of the autologous CD8 T cells are similar between the p24 and luciferase read out (Fig. 2A and B, respectively). Again, good concordance was observed when comparing the two read outs for the infection kinetics when using cells from a HIV-1 negative volunteer (Fig. 2C and D), where limited inhibition was observed in the presence of the autologous CD8 T cells. To further validate our observations we performed a correlation analysis between the log10 p24 and log10 LucR read out by combining results of four separate experiments performed in triplicate (Fig. 2E). Expanded CD4 T cells from LTNP, EC & HIV-1 negative donors were infected with NL-LucR.T2A or CH077.t-LucR.T2A and cultured in the presence or absence of autologous CD8 T cells. Both the p24 concentration in the culture supernatant and the LucR expression in the cultured cells were determined at multiple days within each experiment. A highly significant correlation was observed between the log10 p24 and the log10 LucR RLU. Altogether, our data support that changing the assay read-out from p24 to LucR yield similar results for the replicating kinetics of the viruses as well as the level of viral inhibition observed.
Fig. 2.
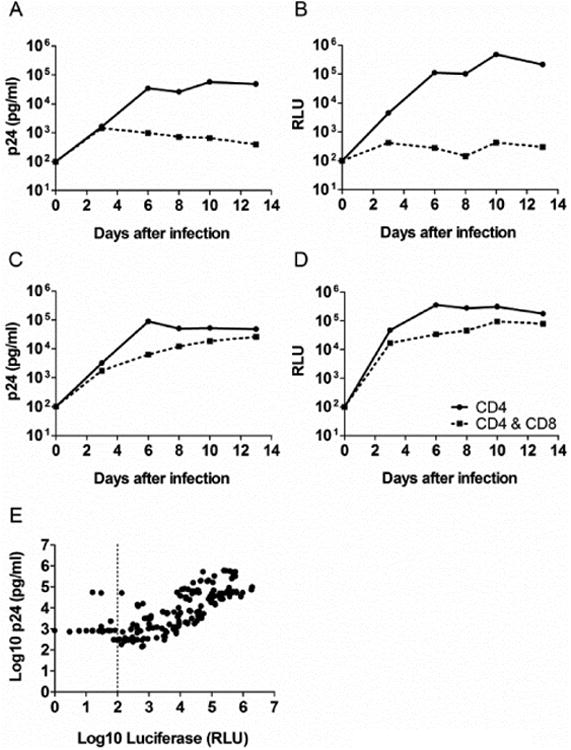
Correlation between p24 and Luciferase read out. (A-D) An example of the replication curves based on the p24 and luciferase read out in the VIA when infecting with CH077.t-LucR T2A. (A) Replication in HIV-1 negative CD4 T cells, in the presence or absence of autologous CD8 T cells, based on p24 concentrations in the culture supernatant. (B) Replication in HIV-1 negative CD4 T cells, in the presence or absence of autologous CD8 T cells, based on luciferase read out. (C) Replication in HIV-1 positive CD4 T cells, in the presence or absence of autologous CD8 T cells, based on p24 concentrations in the culture supernatant. (D) Replication in HIV-1 positive CD4 T cells, in the presence or absence of autologous CD8 T cells, based on Luciferase read out. E. Correlation between p24 and Luciferase read out for both NL-LucR T2A and CH077.t-LucR T2A. The data is combined from 4 independent experiments with a total N of 172. The Pearson correlation was determined.
3.3 Optimization of the IMC LucR VIA
We proceeded to further optimize the VIA to fully realize the potential of the IMC LucR VIA. To increase infection of the CD4 T cells we introduced a spinoculation step followed by an incubation of 3 days before addition of expanded autologous CD8 T cells, thereby allowing for a persistent infection of the CD4 T cells prior to addition of the CD8 T cells. The luciferase activity is determined 5 days after addition of the CD8 T cells, resulting in a decrease of 5 days in overall assay time. In addition the assay was miniaturized to a 96 well format instead of a 48 well plate (as in the 1st generation). This resulted in fewer cells per well being used and therefore allowing for the introduction of more replicates.
We then investigated the effect of CD8:CD4 ratio in the IMC LucR VIA. The log inhibition was determined for different CD8 and CD4 T-cell ratios for a HIV-1 negative volunteer for NL-LucR.T2A and CH077.t-LucR.T2A (Fig. 3A and B, respectively). Little to no inhibition was observed at the 1:1 or lower cell ratio for both viruses. However, non-specific inhibition increased proportionally with ratios over 1:1. In the HIV-1 positive PBMCs, the extent of the specific inhibition for NL-LucR.T2A (figure 3A) and CH077.t-LucR.T2A, (figure 3B) decreased slightly when the CD8:CD4 T-cell ratio decreased, but the effect is much less pronounced than that observed for non-specific inhibition in the HIV-1 negative PBMCs.
Fig. 3.

The influence of CD8-CD4 T cell ratio on the level of non-specific inhibition in the IMC LucR VIA. (A & B) The experiment was performed in triplicate and the log inhibition was determined by subtracting the average RLU for infected CD4 cells + CD8 T cells from infected CD4 T cells. The black bars represent the PBMCs from a HIV-1 negative donor and the hashed bars represent the results when using PBMCs from a HIV-1 positive donor. (A) NL-LucR.T2A (B) CH077.t-LucR.T2A. The data is from a representative experiment, repeated 3 times. (C) The effect of CD8 & CD4 T cell ratio in the IMC LucR VIA on the non-specific background inhibition is shown. The data is determined on PBMCs from 9 different HIV-1 negative volunteers and the results for NL-LucR T2A and CH077.t-LucR T2A were combined. (D) The log inhibition was determined on PBMCs from 8 HIV-1 positive volunteers for different CD8 & CD4 T cell ratios. The results for both NL-LucR T2A and CH077.t-LucR T2A were combined. Both box and whiskers graphs represent the 95 percentile, the median is depicted by the line in the box and the maximum and minimum values are depicted as the whiskers. A paired T-test was performed using GraphPad Prism version 5 to determine significance.
To determine if the increase of non-specific inhibition associated with an increase of CD8 T cells is a reoccurring phenomenon, we tested another eight HIV-1 negative and eight HIV-1 positive donors (Fig. 3C and D respectively) and combined the results from both viruses. The results showed that the non-specific background inhibition was consistently and significantly higher (P<0.0001, paired T test; increased by 0.8 log) when the CD8:CD4 ratio was increased (Fig. 3C). The same was observed for the specific inhibition using HIV-1 positive samples, although this effect was less pronounced (P=0.0005, paired T test; increased by 0.4 log) (Fig 3D). Determination of the coefficient of variation (CV) across the HIV-1 positive samples revealed a large difference in variability between the 1:1 and 10:1 cell ratio. The 1:1 cell ratio had a CV of 52.84% whereas the 10:1 cell ratio had a CV of 23.86%, illustrating a decrease in variability within this group indicating an undesirable decreased range and ability to distinguish the log inhibition differences between different volunteer PBMCs. In addition, the reduction of non-specific background inhibition in the VIA could have positive implication for the sensitivity of the assay. In summary, the optimization process allowed us to decrease assay time by 5 days, decrease number of cells used by miniaturization and select the optimal CD8:CD4 ratio of 1:1. All these changes were incorporated in the IMC LucR VIA.
3.4 Correlation between first generation VIA and IMC LucR VIA using samples from HIV-1 vaccine trials
The results obtained with the first generation VIA utilizing the p24 read out system (Spentzou et al., 2010) were compared to those from the newly developed IMC LucR VIA using PBMCs from several HIV-1 vaccine trials. The log inhibitions for the first generation VIA and the IMC LucR VIA were determined and compared. We compared IIIB to NL-LucR.T2A and CH077 to CH077.t-LucR.T2A for the first generation VIA and the IMC LucR VIA, respectively. NL 4.3 is derived from IIIB and therefore the viruses share a high degree of sequence homology (98% homology when comparing sequenced IIIB to NL 4.3 (AF324493), data not shown). The results of the assay comparison for both viruses using pre-immunization PBMCs from twenty eight vaccine trial volunteers revealed a significant reduction (P<0.0001, Wilcoxon matched pairs test) of the non-specific background inhibition in the IMC LucR VIA when compared to the first generation (Fig. 4A). These results allowed us to determine the assay cut off for the IMC LucR VIA at 0.6 log inhibition, as calculated by the mean log inhibition plus 3 standard deviations, (represented as a dashed line in figure 4A). In contrast, a higher cut-off of 1.4 log inhibition was calculated for the first generation in line with the previously observed value of 1.5 log inhibition (represented as a dashed line in figure 4A) (Jaoko et al., 2010; Spentzou et al., 2010; unpublished data). A comprehensive comparison of the first generation VIA and the IMC LucR VIA was performed using sixty-seven pre- and post vaccination PBMCs from forty volunteers participating in two different HIV-1 vaccine trials (Fig. 4B) (Jaoko et al., 2010; N Borthwick et al. manuscript in preparation). Results obtained for both virus combined showed a significant correlation (P<0.0001, Pearson correlation) between the two assays. Two PBMC samples showed inhibition in the first generation VIA but not in the IMC LucR VIA. On the contrary, seventeen samples did not inhibit in the first generation VIA but did in the IMC LucR VIA, which could indicate an increased sensitivity of the IMC LucR VIA, but additional screening need to be performed to confirm this.
Fig. 4.

Comparison of the non-specific background inhibition between the first generation VIA and the IMC LucR VIA. IIIB was compared to NL-LucR T2A and CH077 was compared to CH077.t-LucR T2A for the first generation VIA and the IMC LucR VIA, respectively. (A) The PBMCs used were all from pre-immunization time points and the results from NL-LucR T2A and CH077.t-LucR T2A were combined, resulting in an N of 56 (N = 28 for each virus). A paired T test was performed using GraphPad Prism version 5 to determine significance. The box and whiskers graph represent the 95 percentile, the median is depicted by the line in the box and the maximum and minimum values are depicted as the whiskers. The cut off for each assay are depicted as an dotted line. (B) The correlation was determined between the first generation VIA and the IMC LucR VIA for both virus comparisons combined. The data is comprised of data from 40 patients and 68 different time points, varying from before or after immunization. The vertical and horizontal dotted lines represent the cut off of the first generation VIA and the IMC LucRVIA, respectively. A Pearson correlation was performed using GraphPad Prism version 5. Depicted in the graph by the dashed line is the standard error of the linear regression.
Importantly, the responses of placebo treated volunteers as well as all pre-immunization samples were below the specific cut off for both VIAs indicating a high specificity of both VIAs. In both the first generation VIA and the IMC LucR VIA there were more responses to IIIB and NL-LucR.T2A than to CH077 and CH077.t-LucR.T2A. Positive responses to CH077 and CH077.t-LucR.T2A in general correspond to positive VIA responses to IIIB and NLLucR.T2A, respectively.
3.5 Specificity and inter assay variability of the IMC LucR VIA
Inter assay variability was determined on eight different HIV-1 positive PBMCs and nine HIV-1 negative PBMCs infected with NL-LucR.T2A or CH077.t-LucR.T2A in four to six independent experiments (depending on the sample) performed in triplicate by two different operators (Fig. 5). Comparison of the maximum infection of HIV-1 positive CD4 T cells for NL-LucR.T2A and CH077.t-LucR.T2A (Fig. 5A & B, respectively) revealed a high consistency of results between experiments and operators The same was observed when determining the maximum of infection in HIV-1 negative CD4 T cells for NL-LucR.T2A and CH077.t-LucR.T2A (Fig. 5C & D, respectively). The maximum infection was donor dependent since it was consistent across individual experiments and operators. The intra donor coefficient of variations of the log10 RLU varied from 2.33% to 14.75% with a mean of 7.90% for the HIV-1 positive cells for both viruses combined. The same range was observed for the HIV-1 negative cells for both viruses combined, which varied from 2.21% to 12.94% with a mean of 7.17%. Overall these results demonstrate a low variability of infection between separate experiments and operators, which is of note since this is a complex primary cell culture based assay with multiple steps which could potentially introduce variability. In addition, results indicated that there is no difference in infection rates between HIV-1 positive and negative samples. The HIV-1 positive samples used in these experiments are from patients with plasma viral loads below 10,000 copies/ml, indicating that the CD4 T cell population in these patients is not compromised, thereby having limited effect on the infection efficiencies of these cells. It is also important to keep in mind that the VIA is primarily developed to determine HIV-1 specific T cell responses in HIV-1 vaccinated individuals not in HIV-1 infected individuals, even though the assay could also be used to determine correlates of protection by comparing HIV-1 infected and uninfected individuals Subsequently we determined the CD8 T-cell induced log inhibition within the same experiments described above. CD8 T cells from HIV-1 positive PBMCs for NL-LucR.T2A and CH077.t-LucR.T2A (Fig. 6A & B, respectively) show a range in inhibition. The intra donor coefficient of variation for these samples varied from 21.45% to 62.14% with a mean of 40.80% for both viruses combined. In addition, the CVs for each individual IMC were not statistically different. The log inhibition was also determined for PBMCs from nine HIV-1 negative volunteers for NL-LucR.T2A and CH077.t-LucR.T2A (Fig. 6C & D, respectively). The log inhibitions fell below the previously established cut-off of 0.6 log inhibition for all except one experiment with PBMCs from donor 17 for NL-LucR.T2A and in another experiment for CH077.t-LucR.T2A, illustrating that the observed false positives were not the results of an error in one specific experiment. The intra donor coefficient of variability was not determined because most means were around zero, which would result in high CVs that do not represent relevant variability. No correlation was observed between the rate of infections (RLU) and log inhibition when comparing HIV-1 positive donor cells for both viruses combined as well as when combining both viruses and both HIV-1 positive and HIV-1 negative donor cells (data not shown), indicating that the variability observed in the log inhibition is not caused by the variability in infection. Together these data show that the IMC LucR VIA has a high specificity that allows for the reliable and reproducible identification of negative versus positive responses in the IMC LucR VIA.
Fig. 5.
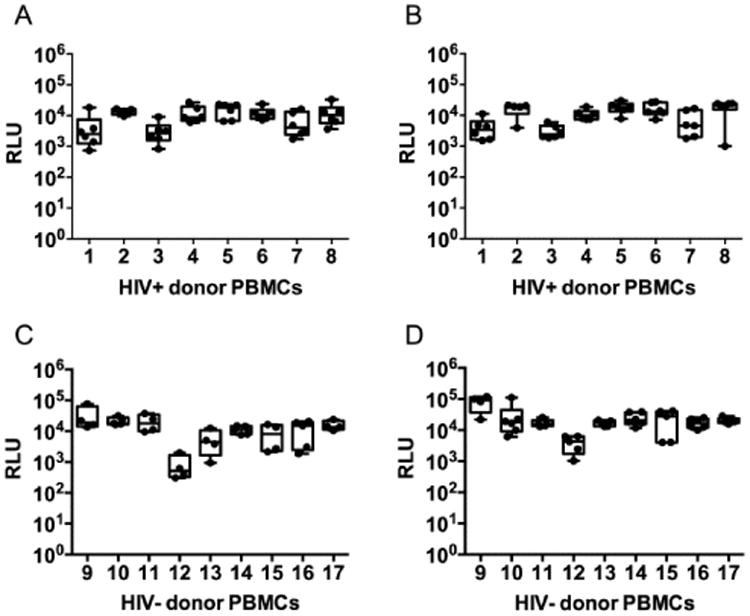
Assay variability for the infection of CD4 T cells of the IMC LucR VIA. The rate of infection of CD4 T cells in 4 to 6 independent experiments performed by two different operators is depicted for each donor. Eight HIV-1 positive and nine HIV-1 negative donor PBMCs were tested (A) Cells derived from HIV-1 positive individuals infected with NL-LucR T2A. (B) Cells derived from HIV-1 positive individuals infected with CH077.t-LucR T2A. (C) Cells derived from HIV-1 negative individuals infected with NL-LucR T2A. (D) Cells derived from HIV-1 negative individuals infected with CH077.t-LucR T2A. The box and whiskers graphs represent the 95 percentile, the median is depicted by the line in the box and the maximum and minimum values are depicted as the whiskers.
In addition to the box and whiskers all individual data points are shown as dots.
Fig. 6.

Assay specificity and inter assay variability for the log inhibition of the IMC LucR VIA. The log inhibition of 4 to 6 independent experiments performed by two different operators is depicted for each donor. The log inhibition was determined by subtracting the average RLU of the triplicates in each experiment for infected CD4 cells + CD8 T cells from infected CD4 T cells alone. Eight HIV-1 positive and nine HIV-1 negative donor PBMCs were tested (A) Cells derived from HIV-1 positive individuals infected with NL-LucR T2A. (B) Cells derived from HIV-1 positive individuals infected with CH077.t-LucR T2A. (C) Cells derived from HIV-1 negative individuals infected with NL-LucR T2A. (D) Cells derived from HIV-1 negative individuals infected with CH077.t-LucR.T2A. The assay cut off is depicted as a dotted line in each graph.
The box and whiskers graphs represent the 95 percentile, the median is depicted by the line in the box and the maximum and minimum values are depicted as the whiskers. In addition to the box and whiskers all individual data points are shown as dots.
Discussion
Poor correlation between IFN-γ ELISPOT responses and in vivo control of HIV-1 has triggered the development of the VIA by several laboratories. The currently used VIA platforms have limitations with regard to cost, required sample volumes and assay time. To overcome these obstacles we have developed a more efficient, sensitive and cost-effective VIA by the introduction of replication-competent Renilla luciferase reporter HIV-1 IMC to the VIA. Most importantly, we can reproducibly identify negative versus positive responses in the IMC LucR VIA, which is of great importance for the assessment of functional CD8 T-cell responses in large-scale clinical trial testing, which will enhance the ability to select the most promising HIV-1 vaccine candidates capable of controlling HIV-1 replication in vivo.
We significantly reduced the non-specific background inhibition in the IMC LucR VIA, however we were unable to abolish it completely, which is most likely due to assay variability and previously described non-cytolytic activity of CD8 T cells, such as the production of β chemokines MIP-1α, MIP-1β and RANTES (Cocchi et al., 1995; Berger, 1997) as well as IL16 (Baier et al., 1995) and SDF-1 (Bleul et al., 1996; Oberlin et al., 1996). We use expanded CD4 and CD8 T cells which allows us to test a large number of viruses and time points with a limited amount of PBMCs. We achieved a high purity of target and effector cells (88-97%) (Spentzou et al., 2010), but none the less a low percentage of alternative cells was still present and could be responsible for the observed non-specific inhibition. The inhibition observed in the first generation VIA was shown to be predominately MHC class I dependent (Spentzou et al., 2010), thereby indicating that an HIV-1 specific cytolytic mechanism is likely responsible. The highly significant correlation between the first generation VIA and IMC LucR VIA implies that the same mechanism of inhibition is measured in the IMC LucR VIA. We observed donor dependent variability of susceptibility to infection in figure 5, but found it to be independent of HIV-1 infection status of the donor. Variation of HIV-1 susceptibility of different PBMC donors has been previously observed (Kaslow et al., 2005) and is most likely due to differences in donor genetic background. The maximum infection achieved could influence the final read out of the VIA by reducing the overall range of the assay and thereby reducing the log inhibition. However, we do not observe correlation between the maximum infection and the log inhibition in the IMC LucR VIA. Nevertheless, additional research is needed to determine the minimum infection required within this assay. Of note, in the context of antibody neutralization assays, no correlation was observed between the susceptibility of 75 donor PBMC to infection, and neutralization sensitivity (Edmonds et al., 2010).
The presence of the luciferase gene in the T/F CH077.t genome, resulted in decreased virus replication compared to wild type virus, the extent of which was similar to that observed for NL-LucR.T2A, as shown here and previously (Edmonds et al., 2010). The expression of the Nef protein is not compromised as shown by Western blot analysis for NL-LucR.T2A (Edmonds et al., 2010), therefore we are able to determine Nef epitope dependent CD8 T-cell responses. However, the lucR.T2A.nef configuration generates a Nef protein with a modified N-terminus. Thus, Nef is likely not myristylated. However since it retains the basic residues for membrane association in the N-terminal domain, its overall function is likely only modestly impaired (Welker et al., 1998; Bentham et al., 2006), and thus, we would argue that the modified N-terminus does not preclude meaningful analyses using the VIA approaches described above. Further research is ongoing to determine the extent of nef function, or loss thereof, of these LucR IMCs. In addition, since we envision application of LucR-IMC to approaches which will depend on fully functional Nef, we are investigating alternative molecular approaches which offer wild-type nef expression while retaining the advantages already realized for antibody neutralization and CD8 T cell virus inhibition assays.
When comparing the first generation VIA and the IMC LucR VIA we used IIIB and NLLucR.T2A, respectively. NL4.3 is derived from IIIB and sequence analysis revealed a 97% sequence homology when comparing the sequence of the IIIB stock to NL4.3 (AF324493) (data not shown). The major difference is that IIIB does not express the nef gene due to a frame shift, where NL4.3 has an open nef reading frame, and thus, NL-LucR.T2 does express Nef, with the modification discussed above. Overall we believe the genetic differences to be sufficiently small to allows us to compare results obtained from these two viruses in the first generation VIA and IMC LucR VIA, and the significant correlation between the data supports this conclusion.
We demonstrated relevance of the IMC LucR VIA for clinical trial sample analysis by testing cells obtained pre and post HIV-1 vaccination. The pre immunization samples showed inhibition levels below the cut-off value, while among the post immunization samples some showed viral inhibition. In addition we tested an array of HIV-1 positive, LTNP and HIV-1 negative samples. As expected, none of the HIV-1 negative samples inhibited viral replication above the cut-off.
We describe the optimization of the IMC LucR VIA based on the use of two “full length” LucR IMCs. Both NL-LucR.T2A and CH077.t-LucR.T2A are clade B viral isolates. An expansion and diversification of the viral panel to include more HIV-1 clades is necessary to assess the breath of the HIV-1 vaccine induced CD8 T cell responses. An emphasis on recent T/F viruses, which are more susceptible to CD8 T cell antiviral responses than viruses isolated later in infection (Freel et al., 2012), is recommended as it would be a better representation of the vaccine targets. When testing samples from clinical trials, we observed that NLLucR.T2A was inhibited more frequently than CH077.t-LucR.T2A, although the magnitude of the responses did not seem to vary (data not shown). The samples used were from trials of vaccine candidates based on clade B HIV-1 lab strains HIV-1, which may explain the higher response rate for the lab strain NL-LucR.T2A than to the T/F virus CH077.t-LucR.T2A.
However, when we looked at samples from HIV-1 positive individuals very similar maximum infections and log inhibitions were observed for both viruses. It is possible that in the context of a chronic infection the CD8 T-cell response is broader. In addition, these individuals are most likely infected with a non-clade B HIV-1, so the response to clade B viruses also indicates a broad CD8 T cell response, explaining the very similar inhibition pattern between the two viruses for these specific donors.
In summary, we have successfully developed and optimized the IMC LucR VIA using Renilla luciferase-expressing IMCs containing the full length viral genome. This novel VIA allows for the determination of HIV-1 specific CD8 T-cell responses from HIV-1 vaccine trial volunteers by a rapid and cost effective luciferase read out. Most importantly we have shown that the IMC LucR VIA has a high degree of specificity, a reduction of non-specific background inhibition, and an increase in positive responses, indicating an increase in sensitivity compared to the first generation VIA. Overall, the IMC LucR VIA is a novel VIA that can be implemented in large-scale clinical trial testing to assess functional HIV-1 specific CD8 T cell responses, which will enhance the ability to select the most promising HIV-1 vaccine candidates capable of controlling HIV-1 replication in vivo.
Acknowledgments
We would like to thank Prof B Walker (Ragon Institute, Boston, USA) for supplying the PBMCs from HIV-1 positive LTNP, and Dr. G Marrow and Dr. R. Lindsay (Development and Design Laboratory, IAVI, NY, USA) for critically reviewing this manuscript. This study was supported by CAVD funding for the CTVIMC, grant number OPP1032325.
CO, JCK, TGE and MI were supported by the NIH Center for HIV/AIDS Vaccine Immunology (CHAVI, U01-AI067854), a subcontract of CAVD funding for the CA-VIMC (grant numbers OPP1032144 and 38619), and through services by the UAB Center for AIDS Research Virology and Sequencing Cores (NIH P30 AI 27767). JCK also received support from the VA through a Career Scientist Award and Merit Review funding.
The International AIDS Vaccine Initiative (IAVI) is a global not-for-profit organization whose mission is to ensure the development of safe, effective, accessible, preventive HIV vaccines for use throughout the world. Founded in 1996, IAVI works with partners in 25 countries to research, design and develop AIDS vaccine candidates. In addition, IAVI conducts policy analyses and serves as an advocate for the AIDS vaccine field. IAVI supports a comprehensive approach to addressing HIV and AIDS that balances the expansion and strengthening of existing HIV-prevention and treatment programs with targeted investments in the design and development of new tools to prevent HIV. IAVI is dedicated to ensuring that a future AIDS vaccine will be available and accessible to all who need it. IAVI relies on the generous donations from governments, private individuals, corporations and foundations to carry out its mission. For more information, see www.iavi.org.
Footnotes
Publisher's Disclaimer: This is a PDF file of an unedited manuscript that has been accepted for publication. As a service to our customers we are providing this early version of the manuscript. The manuscript will undergo copyediting, typesetting, and review of the resulting proof before it is published in its final citable form. Please note that during the production process errors may be discovered which could affect the content, and all legal disclaimers that apply to the journal pertain.
References
- Akinsiku OT, Bansal A, Sabbaj S, Heath SL, Goepfert PA. Interleukin-2 production by polyfunctional HIV-1-specific CD8 T cells is associated with enhanced viral suppression. J Acquir Immune Defic Syndr. 2011;58:132–40. doi: 10.1097/QAI.0b013e318224d2e9. [DOI] [PMC free article] [PubMed] [Google Scholar]
- Baier M, Werner A, Bannert N, Metzner K, Kurth R. HIV suppression by interleukin-16. Nature. 1995;378:563. doi: 10.1038/378563a0. [DOI] [PubMed] [Google Scholar]
- Bennett MS, Ng HL, Ali A, Yang OO. Cross-clade detection of HIV-1-specific cytotoxic T lymphocytes does not reflect cross-clade antiviral activity. The Journal of infectious diseases. 2008;197:390–7. doi: 10.1086/525281. [DOI] [PubMed] [Google Scholar]
- Bentham M, Mazaleyrat S, Harris M. Role of myristoylation and N-terminal basic residues in membrane association of the human immunodeficiency virus type 1 Nef protein. The Journal of general virology. 2006;87:563–71. doi: 10.1099/vir.0.81200-0. [DOI] [PubMed] [Google Scholar]
- Berger EA. HIV entry and tropism: the chemokine receptor connection. AIDS. 1997;11(A):S3–16. [PubMed] [Google Scholar]
- Bleul CC, Farzan M, Choe H, Parolin C, Clark-Lewis I, Sodroski J, Springer TA. The lymphocyte chemoattractant SDF-1 is a ligand for LESTR/fusin and blocks HIV-1 entry. Nature. 1996;382:829–33. doi: 10.1038/382829a0. [DOI] [PubMed] [Google Scholar]
- Brown BK, Wieczorek L, Kijak G, Lombardi K, Currier J, Wesberry M, Kappes JC, Ngauy V, Marovich M, Michael N, Ochsenbauer C, Montefiori DC, Polonis VR. The role of natural killer (NK) cells and NK cell receptor polymorphisms in the assessment of HIV-1 neutralization. PloS one. 2012;7:e29454. doi: 10.1371/journal.pone.0029454. [DOI] [PMC free article] [PubMed] [Google Scholar]
- Chen H, Piechocka-Trocha A, Miura T, Brockman MA, Julg BD, Baker BM, Rothchild AC, Block BL, Schneidewind A, Koibuchi T, Pereyra F, Allen TM, Walker BD. Differential neutralization of human immunodeficiency virus (HIV) replication in autologous CD4 T cells by HIV-specific cytotoxic T lymphocytes. Journal of virology. 2009;83:3138–49. doi: 10.1128/JVI.02073-08. [DOI] [PMC free article] [PubMed] [Google Scholar]
- Cocchi F, DeVico AL, Garzino-Demo A, Arya SK, Gallo RC, Lusso P. Identification of RANTES, MIP-1 alpha, and MIP-1 beta as the major HIVsuppressive factors produced by CD8+ T cells. Science. 1995;270:1811–5. doi: 10.1126/science.270.5243.1811. [DOI] [PubMed] [Google Scholar]
- Cohen MS, Shaw GM, McMichael AJ, Haynes BF. Acute HIV-1 Infection. The New England journal of medicine. 2011;364:1943–54. doi: 10.1056/NEJMra1011874. [DOI] [PMC free article] [PubMed] [Google Scholar]
- Edmonds TG, Ding H, Yuan X, Wei Q, Smith KS, Conway JA, Wieczorek L, Brown B, Polonis V, West JT, Montefiori DC, Kappes JC, Ochsenbauer C. Replication competent molecular clones of HIV-1 expressing Renilla luciferase facilitate the analysis of antibody inhibition in PBMC. Virology. 2010;408:1–13. doi: 10.1016/j.virol.2010.08.028. [DOI] [PMC free article] [PubMed] [Google Scholar]
- Fauce SR, Yang OO, Effros RB. Autologous CD4/CD8 co-culture assay: a physiologically-relevant composite measure of CD8+ T lymphocyte function in HIV-infected persons. Journal of immunological methods. 2007;327:75–81. doi: 10.1016/j.jim.2007.07.017. [DOI] [PMC free article] [PubMed] [Google Scholar]
- Freel SA, Lamoreaux L, Chattopadhyay PK, Saunders K, Zarkowsky D, Overman RG, Ochsenbauer C, Edmonds TG, Kappes JC, Cunningham CK, Denny TN, Weinhold KJ, Ferrari G, Haynes BF, Koup RA, Graham BS, Roederer M, Tomaras GD. Phenotypic and functional profile of HIV-inhibitory CD8 T cells elicited by natural infection and heterologous prime/boost vaccination. Journal of virology. 2010;84:4998–5006. doi: 10.1128/JVI.00138-10. [DOI] [PMC free article] [PubMed] [Google Scholar]
- Freel SA, Picking RA, Ferrari G, Ding H, Ochsenbauer C, Kappes JC, Kirchherr JL, Soderberg KA, Weinhold KJ, Cunningham CK, Denny TN, Crump JA, Cohen MS, McMichael AJ, Haynes BF, Tomaras GD. Initial HIV-1 antigen-specific CD8+ T cells in acute HIV-1 infection inhibit transmitted/founder virus replication. Journal of virology. 2012;86:6835–46. doi: 10.1128/JVI.00437-12. [DOI] [PMC free article] [PubMed] [Google Scholar]
- Gauduin MC, Glickman RL, Means R, Johnson RP. Inhibition of simian immunodeficiency virus (SIV) replication by CD8(+) T lymphocytes from macaques immunized with live attenuated SIV. Journal of virology. 1998;72:6315–24. doi: 10.1128/jvi.72.8.6315-6324.1998. [DOI] [PMC free article] [PubMed] [Google Scholar]
- Goulder PJ, Phillips RE, Colbert RA, McAdam S, Ogg G, Nowak MA, Giangrande P, Luzzi G, Morgan B, Edwards A, McMichael AJ, Rowland-Jones S. Late escape from an immunodominant cytotoxic T-lymphocyte response associated with progression to AIDS. Nature medicine. 1997;3:212–7. doi: 10.1038/nm0297-212. [DOI] [PubMed] [Google Scholar]
- Gray CM, Mlotshwa M, Riou C, Mathebula T, de Assis Rosa D, Mashishi T, Seoighe C, Ngandu N, van Loggerenberg F, Morris L, Mlisana K, Williamson C, Karim SA. Human immunodeficiency virus-specific gamma interferon enzyme-linked immunospot assay responses targeting specific regions of the proteome during primary subtype C infection are poor predictors of the course of viremia and set point. Journal of virology. 2009;83:470–8. doi: 10.1128/JVI.01678-08. [DOI] [PMC free article] [PubMed] [Google Scholar]
- Harrer T, Harrer E, Kalams SA, Barbosa P, Trocha A, Johnson RP, Elbeik T, Feinberg MB, Buchbinder SP, Walker BD. Cytotoxic T lymphocytes in asymptomatic long-term nonprogressing HIV-1 infection. Breadth and specificity of the response and relation to in vivo viral quasispecies in a person with prolonged infection and low viral load. J Immunol. 1996;156:2616–23. [PubMed] [Google Scholar]
- Hayes P, Gilmour J, von Lieven A, Gill D, Clark L, Kopycinski J, Cheeseman H, Chung A, Alter G, Dally L, Zachariah D, Lombardo A, Ackland J, Sayeed E, Jackson A, Boffito M, Gazzard B, Fast PE, Cox JH, Laufer D. Safety and immunogenicity of DNA prime and modified vaccinia ankara virus-HIV subtype C vaccine boost in healthy adults. Clinical and vaccine immunology : CVI. 2013;20:397–408. doi: 10.1128/CVI.00637-12. [DOI] [PMC free article] [PubMed] [Google Scholar]
- Jaoko W, Karita E, Kayitenkore K, Omosa-Manyonyi G, Allen S, Than S, Adams EM, Graham BS, Koup RA, Bailer RT, Smith C, Dally L, Farah B, Anzala O, Muvunyi CM, Bizimana J, Tarragona-Fiol T, Bergin PJ, Hayes P, Ho M, Loughran K, Komaroff W, Stevens G, Thomson H, Boaz MJ, Cox JH, Schmidt C, Gilmour J, Nabel GJ, Fast P, Bwayo J. Safety and immunogenicity study of Multiclade HIV-1 adenoviral vector vaccine alone or as boost following a multiclade HIV-1 DNA vaccine in Africa. PloS one. 2010;5:e12873. doi: 10.1371/journal.pone.0012873. [DOI] [PMC free article] [PubMed] [Google Scholar]
- Kaslow RA, Dorak T, Tang JJ, Andrews CA. Influence of host genetic variation on susceptibility to HIV type 1 infection. The Journal of infectious diseases. 2005;191(1):S68–77. doi: 10.1086/425269. [DOI] [PubMed] [Google Scholar]
- Koup RA, Safrit JT, Cao Y, Andrews CA, McLeod G, Borkowsky W, Farthing C, Ho DD. Temporal association of cellular immune responses with the initial control of viremia in primary human immunodeficiency virus type 1 syndrome. Journal of virology. 1994;68:4650–5. doi: 10.1128/jvi.68.7.4650-4655.1994. [DOI] [PMC free article] [PubMed] [Google Scholar]
- Lieberman J. Tracking the killers: how should we measure CD8 T cells in HIV infection? AIDS. 2004;18:1489–93. doi: 10.1097/01.aids.0000131320.75396.4d. [DOI] [PubMed] [Google Scholar]
- Loffredo JT, Rakasz EG, Giraldo JP, Spencer SP, Grafton KK, Martin SR, Napoe G, Yant LJ, Wilson NA, Watkins DI. Tat(28-35)SL8-specific CD8+ T lymphocytes are more effective than Gag(181-189)CM9-specific CD8+ T lymphocytes at suppressing simian immunodeficiency virus replication in a functional in vitro assay. Journal of virology. 2005;79:14986–91. doi: 10.1128/JVI.79.23.14986-14991.2005. [DOI] [PMC free article] [PubMed] [Google Scholar]
- Migueles SA, Osborne CM, Royce C, Compton AA, Joshi RP, Weeks KA, Rood JE, Berkley AM, Sacha JB, Cogliano-Shutta NA, Lloyd M, Roby G, Kwan R, McLaughlin M, Stallings S, Rehm C, O'Shea MA, Mican J, Packard BZ, Komoriya A, Palmer S, Wiegand AP, Maldarelli F, Coffin JM, Mellors JW, Hallahan CW, Follman DA, Connors M. Lytic granule loading of CD8+ T cells is required for HIV-infected cell elimination associated with immune control. Immunity. 2008;29:1009–21. doi: 10.1016/j.immuni.2008.10.010. [DOI] [PMC free article] [PubMed] [Google Scholar]
- Montefiori DC, Karnasuta C, Huang Y, Ahmed H, Gilbert P, de Souza MS, McLinden R, Tovanabutra S, Laurence-Chenine A, Sanders-Buell E, Moody MA, Bonsignori M, Ochsenbauer C, Kappes J, Tang H, Greene K, Gao H, LaBranche CC, Andrews C, Polonis VR, Rerks-Ngarm S, Pitisuttithum P, Nitayaphan S, Kaewkungwal J, Self SG, Berman PW, Francis D, Sinangil F, Lee C, Tartaglia J, Robb ML, Haynes BF, Michael NL, Kim JH. Magnitude and breadth of the neutralizing antibody response in the RV144 and Vax003 HIV-1 vaccine efficacy trials. The Journal of infectious diseases. 2012;206:431–41. doi: 10.1093/infdis/jis367. [DOI] [PMC free article] [PubMed] [Google Scholar]
- Oberlin E, Amara A, Bachelerie F, Bessia C, Virelizier JL, Arenzana-Seisdedos F, Schwartz O, Heard JM, Clark-Lewis I, Legler DF, Loetscher M, Baggiolini M, Moser B. The CXC chemokine SDF-1 is the ligand for LESTR/fusin and prevents infection by T-cell-line-adapted HIV-1. Nature. 1996;382:833–5. doi: 10.1038/382833a0. [DOI] [PubMed] [Google Scholar]
- Ochsenbauer C, Edmonds TG, Ding H, Keele BF, Decker J, Salazar MG, Salazar-Gonzalez JF, Shattock R, Haynes BF, Shaw GM, Hahn BH, Kappes JC. Generation of transmitted/founder HIV-1 infectious molecular clones and characterization of their replication capacity in CD4 T lymphocytes and monocyte-derived macrophages. Journal of virology. 2012;86:2715–28. doi: 10.1128/JVI.06157-11. [DOI] [PMC free article] [PubMed] [Google Scholar]
- Ozaki DA, Gao H, Todd CA, Greene KM, Montefiori DC, Sarzotti-Kelsoe M. International technology transfer of a GCLP-compliant HIV-1 neutralizing antibody assay for human clinical trials. PloS one. 2012;7:e30963. doi: 10.1371/journal.pone.0030963. [DOI] [PMC free article] [PubMed] [Google Scholar]
- Pace CS, Song R, Ochsenbauer C, Andrews CD, Franco D, Yu J, Oren DA, Seaman MS, Ho DD. Bispecific antibodies directed to CD4 domain 2 and HIV envelope exhibit exceptional breadth and picomolar potency against HIV-1. Proceedings of the National Academy of Sciences of the United States of America. 2013 doi: 10.1073/pnas.1304985110. [DOI] [PMC free article] [PubMed] [Google Scholar]
- Saez-Cirion A, Shin SY, Versmisse P, Barre-Sinoussi F, Pancino G. Ex vivo T cell-based HIV suppression assay to evaluate HIV-specific CD8+ T-cell responses. Nature protocols. 2010;5:1033–41. doi: 10.1038/nprot.2010.73. [DOI] [PubMed] [Google Scholar]
- Salazar-Gonzalez JF, Salazar MG, Keele BF, Learn GH, Giorgi EE, Li H, Decker JM, Wang S, Baalwa J, Kraus MH, Parrish NF, Shaw KS, Guffey MB, Bar KJ, Davis KL, Ochsenbauer-Jambor C, Kappes JC, Saag MS, Cohen MS, Mulenga J, Derdeyn CA, Allen S, Hunter E, Markowitz M, Hraber P, Perelson AS, Bhattacharya T, Haynes BF, Korber BT, Hahn BH, Shaw GM. Genetic identity, biological phenotype, and evolutionary pathways of transmitted/founder viruses in acute and early HIV-1 infection. The Journal of experimental medicine. 2009;206:1273–89. doi: 10.1084/jem.20090378. [DOI] [PMC free article] [PubMed] [Google Scholar]
- Spentzou A, Bergin P, Gill D, Cheeseman H, Ashraf A, Kaltsidis H, Cashin-Cox M, Anjarwalla I, Steel A, Higgs C, Pozniak A, Piechocka-Trocha A, Wong J, Anzala O, Karita E, Dally L, Gotch F, Walker B, Gilmour J, Hayes P. Viral inhibition assay: a CD8 T cell neutralization assay for use in clinical trials of HIV-1 vaccine candidates. The Journal of infectious diseases. 2010;201:720–9. doi: 10.1086/650492. [DOI] [PubMed] [Google Scholar]
- Tomaras GD, Lacey SF, McDanal CB, Ferrari G, Weinhold KJ, Greenberg ML. CD8+ T cell-mediated suppressive activity inhibits HIV-1 after virus entry with kinetics indicating effects on virus gene expression. Proceedings of the National Academy of Sciences of the United States of America. 2000;97:3503–8. doi: 10.1073/pnas.070521097. [DOI] [PMC free article] [PubMed] [Google Scholar]
- Toso JF, Chen CH, Mohr JR, Piglia L, Oei C, Ferrari G, Greenberg ML, Weinhold KJ. Oligoclonal CD8 lymphocytes from persons with asymptomatic human immunodeficiency virus (HIV) type 1 infection inhibit HIV-1 replication. The Journal of infectious diseases. 1995;172:964–73. doi: 10.1093/infdis/172.4.964. [DOI] [PubMed] [Google Scholar]
- Tsukamoto T, Yuasa M, Yamamoto H, Kawada M, Takeda A, Igarashi H, Matano T. Induction of CD8+ cells able to suppress CCR5-tropic simian immunodeficiency virus SIVmac239 replication by controlled infection of CXCR4-tropic simian-human immunodeficiency virus in vaccinated rhesus macaques. Journal of virology. 2007;81:11640–9. doi: 10.1128/JVI.01475-07. [DOI] [PMC free article] [PubMed] [Google Scholar]
- Valentine LE, Piaskowski SM, Rakasz EG, Henry NL, Wilson NA, Watkins DI. Recognition of escape variants in ELISPOT does not always predict CD8+ T-cell recognition of simian immunodeficiency virus-infected cells expressing the same variant sequences. Journal of virology. 2008;82:575–81. doi: 10.1128/JVI.00275-07. [DOI] [PMC free article] [PubMed] [Google Scholar]
- Walker CM, Erickson AL, Hsueh FC, Levy JA. Inhibition of human immunodeficiency virus replication in acutely infected CD4+ cells by CD8+ cells involves a noncytotoxic mechanism. Journal of virology. 1991;65:5921–7. doi: 10.1128/jvi.65.11.5921-5927.1991. [DOI] [PMC free article] [PubMed] [Google Scholar]
- Wei X, Decker JM, Liu H, Zhang Z, Arani RB, Kilby JM, Saag MS, Wu X, Shaw GM, Kappes JC. Emergence of resistant human immunodeficiency virus type 1 in patients receiving fusion inhibitor (T-20) monotherapy. Antimicrobial agents and chemotherapy. 2002;46:1896–905. doi: 10.1128/AAC.46.6.1896-1905.2002. [DOI] [PMC free article] [PubMed] [Google Scholar]
- Welker R, Harris M, Cardel B, Krausslich HG. Virion incorporation of human immunodeficiency virus type 1 Nef is mediated by a bipartite membrane-targeting signal: analysis of its role in enhancement of viral infectivity. Journal of virology. 1998;72:8833–40. doi: 10.1128/jvi.72.11.8833-8840.1998. [DOI] [PMC free article] [PubMed] [Google Scholar]
- Wong JT, Colvin RB. Bi-specific monoclonal antibodies: selective binding and complement fixation to cells that express two different surface antigens. J Immunol. 1987;139:1369–74. [PubMed] [Google Scholar]
- Yamamoto T, Johnson MJ, Price DA, Wolinsky DI, Almeida JR, Petrovas C, Nason M, Yeh WW, Shen L, Roederer M, Rao SS, McDermott AB, Lefebvre F, Nabel GJ, Haddad EK, Letvin NL, Douek DC, Koup RA. Virus inhibition activity of effector memory CD8(+) T cells determines simian immunodeficiency virus load in vaccinated monkeys after vaccine breakthrough infection. Journal of virology. 2012;86:5877–84. doi: 10.1128/JVI.00315-12. [DOI] [PMC free article] [PubMed] [Google Scholar]
- Yang OO, Kalams SA, Trocha A, Cao H, Luster A, Johnson RP, Walker BD. Suppression of human immunodeficiency virus type 1 replication by CD8+ cells: evidence for HLA class I-restricted triggering of cytolytic and noncytolytic mechanisms. Journal of virology. 1997;71:3120–8. doi: 10.1128/jvi.71.4.3120-3128.1997. [DOI] [PMC free article] [PubMed] [Google Scholar]