

Abstract
Background
Individuals with type 1 diabetes may have low IGF-1, related to insulinopenia and insulin resistance. There are few longitudinal studies of IGF-1 levels to establish its pattern in type 1 diabetes with duration and age, and to examine whether IGF-1 tracks within individuals over time. We examine age and duration trends, and the relationship of IGF-1 to gender, glycemic control, insulin level and other factors.
Methods
Participants in the Wisconsin Diabetes Registry Study, an incident cohort study of type 1 diabetes diagnosed May 1987-April 1992, were followed for up to 18 years with IGF-1 samples up to age 45 for women and age 37 for men..
Results
IGF-1 is lower with type 1 diabetes than in normative samples. Although, the pattern across age resembles that in normative samples with a peak in adolescence and slow decline after age 20, the adolescent peak is delayed for women with type 1 diabetes. There was low to moderate tracking of IGF-1 within individual. Higher insulin dose was associated with higher IGF-1 as was puberty, and female gender. Adjusted for these factors, IGF-1 declined rapidly across early diabetes duration. Lower HbA1c was most strongly related to higher IGF-1 at Tanner stages 1 and 2.
Conclusions
IGF-1 is low in type 1 diabetes, with a delayed adolescent peak in women and is especially influenced by glycemic control in early and pre- adolescence. High variability within individual is likely a challenge in investigating associations between IGF-1 and long term outcomes, and may explain contradictory findings.
Keywords: IGF-1, type 1 diabetes, trajectory, variance, predictors, tracking
Introduction
Insulin like growth factor (IGF-1) is a hormone, similar in structure to insulin, that plays an important role in childhood growth and continues to have anabolic effects in adults, as it is involved in the regulation of growth and cellular proliferation [1,2]. In glucose metabolism, lower than normal IGF-1 has been shown to be related to insulinopenia, as IGF-1 is part of a complex feedback loop where low values lead to higher insulin resistance through growth hormone hypersecretion [3–7].
Studies aiming to establish reference values for IGF-1 demonstrate that IGF-1 serum level increases in children with age, reaching its peak during puberty, followed by a subsequent decline in adulthood [8–14]. A similar pattern with age has been found in individuals with diabetes [15,16]. However, most studies show that IGF-1 levels are lower than in the general population with both type 1 (T1D) [15, 17–19] and type 2 diabetes, at least below age 65 [19].
The relationship of IGF- 1 to diabetes complications has received considerable attention with contradictory results. Low levels have been found to be related to low bone formation and osteoblast function [15,18], microalbuminuria [20], and limited joint mobility [20,21]. Both high and low IGF-1 have been found associated with higher risk of diabetic retinopathy. The evidence was critically reviewed by Janssen and Lamberts [22], leading them to conclude that low IGF-1 more likely increases the risk of complications including retinopathy. They hypothesize that the early and continued decline in IGF-1 during aging may result in insufficient protective effects in target tissues (kidneys, eyes, neurons). In general, studies of the relationship between IGF-1 and complications have been very small and the relationships remain controversial [23].
There are few or no longitudinal studies of IGF-1 levels in individuals with T1D to paint a picture of the pattern with duration and age, and to examine whether IGF-1 tracks in an individual over time. Cross-sectional studies including at least 50 individuals, addressed adults age 20–60 [17], adolescents and adults [15] and individuals age 17 and younger shortly after diagnosis [16]. Even adults in excellent glycemic control had low IGF-1 [24].
A few studies investigated what individual characteristics and diabetes care features are associated with IGF-1, and came to contradictory conclusions. One study followed 11 children with T1D for a month after diagnosis and found that IGF-1 increased with insulin therapy and better glycemic control [4]. The authors concluded that an insulinopenic state has effects on IGF-1 regulation similar to those of nutritional deprivation. Others have similarly found IGF-1 levels to be higher with better glycemic control [16], but one study of adults [25] found relationships of IGF-1 with HbA1c and insulin only among men.
The Wisconsin Diabetes Registry study has now followed a cohort from diagnosis up to 20 years duration. IGF-1 was measured close to diagnosis [16], from stored samples up to 9 years duration and in a study of bone density in women at 13–18 years duration. This allows us to examine age and duration trends between 1 and 36 years of age, and the relationship of IGF-1 to gender, glycemic control, insulin level and a number of other factors. In addition, we compare the age trend in our cohort with that in one of the normative studies of IGF-1 that covered a wide age range [13].
Materials and Methods
Description of participants
The Wisconsin Diabetes Registry Study (WDRS) is a prospective study of long-term complications and their risk factors in children, adolescents, and young adults with T1D. Details of case recruitment and ascertainment have been described previously [26]. In brief, from May of 1987 through April of 1992, all persons newly diagnosed with T1D who were ≤ 30 years of age and lived within a defined area (28 counties) in central and southern Wisconsin were eligible. Individuals were referred by physician, nurse, diabetes educator, family or self. Hospitals and clinics in the study area were called every three months to ascertain any missed cases. A total of 733 individuals were identified (overall case ascertainment rate of 82 percent), of whom 597 enrolled, with fewer adult and non-white persons participating. The Institutional Review Board for the protection of human subjects at the University of Wisconsin-Madison approved the informed consent process and methods of this study.
Data and specimen collection relevant to present analysis
Birth date, diagnosis date and sex were obtained at a baseline telephone interview and age and duration calculated.
Clinical examinations were offered to cohort members residing in the southern part of the study area at baseline. Follow-up examinations were offered at four, seven, nine, fourteen and twenty years post-onset, but IGF-1 was not measured at the last two exams. Details on participation and procedures at the baseline through fourteen year exams have been provided previously [26]. In addition, a subgroup of 89 women participated in an ancillary study of bone density at 13–18 years duration [27]. Data from plasma samples, height and weight, and pubertal status obtained at these examinations are used for the present analysis. Height was measured by standard stadiometer height rod fixed to the Healthometer physician beam scale used for weight. BMI was computed as weight in kg divided by height in meters squared. Subjects aged 10–17 assessed their Tanner stage [1–5] based on illustrations of genitalia [16, 28].
Diabetes self-management data, including insulin dose in units (by injection or insulin pump) were collected during the initial baseline interview and every six to 12 months throughout follow-up by mailed questionnaire [29]. Subject height and weight were obtained by self-report via these questionnaires in addition to the clinic measurements. Insulin dose per kg of body weight was obtained from the clinic weight if within 6 months prior to the questionnaire, and from self reported weight otherwise. Insulin dose per kg was averaged across the year of age at IGF-1 measurement.
Glycosylated hemoglobin testing
Participants were mailed kits every four months up to year 2000 and yearly in 2001–2002 to take to their clinic for sample collection. Anti- coagulated whole blood samples were hand delivered or mailed to a central laboratory and analyzed within 7 days for total glycosylated hemoglobin. Details of the assay and rationale for its use in this study were published previously [30,31]. A DCCT equivalent Hemoglobin A1c (HbA1c) was calculated from GHb values, following split sample testing (n=154) for GHb in the central laboratory and for HbA1c at the core DCCT laboratory at the University of Minnesota (Minneapolis, MN), by the regression equation: HbA1c= 0.786 + 0.797(GHb) - 0.006(GHb2). Samples from the bone density study were analyzed for HbA1c at the DCCT core laboratory. HbA1c values were averaged across the year of age at IGF-1 measurement.
Measurement of IGF-1
IGF-1 measurements on plasma were obtained at three study stages by three different methods and transformed to Diagnostic Systems Laboratories (DSL) (Sinsheim, Germany) equivalent values by equations provided by Krebs et al. [32] and by Ranke et al. [33]. Equivalence of the transformed IGF-1 values across methods was assessed by testing indicator variables for method in the final regression model and extensive inspection of residuals by age.
IGF-1 was determined during 1987–1992 once on subjects with available plasma samples obtained at baseline examinations, by radioimmunoassay RIA as reported earlier [16]. We refer to this study stage as “baseline”. These 180 measures cover a T1D duration range of 2 months to 2 years and an age range of 1 to 29 years. Based on Ranke et al. [33], values were transformed to DSL equivalents via
RIA based values at or below 29 (n=10) were left untransformed to avoid negative IGF-1, although results of analyses did not differ either way.
During 2006–2011, plasma samples from examinations, selected as those containing sufficient volume, stored at −80°C since collection, were thawed and analyzed for IGF-1 by the method of Siemens solid-phase enzyme-labeled chemiluminescent immunometric assay performed on the Immulite 2000 at Fairview Laboratories, Minneapolis, Minnesota. We refer to this study stage as “longitudinal”. It resulted in 136 measurements on 96 individuals with durations ranging from 3 to 9 years and ages between 3 and 37 years. As evaluated by Krebs et al. [32], this method has the smallest within and between day coefficient of variation among five assays investigated. Values from this assay were converted to DSL equivalents via the equation [32]:
Finally, as part of the study on bone density [27] plasma samples were collected and tested for IGF-1 by the chemiluminescent immunoassay from Nichols in 2005–2006 at the ARUP Laboratories, University of Utah. We refer to this study stage as “bone study”. It resulted in 89 samples from 89 women covering durations of 13–18 years and an age range of 18 to 45 years. Following Krebs et al. [32] values were converted to DSL equivalent via:
In total, 258 individuals had at least one measure of IGF-1, and of these 90 had 2–5 measures and 43 at least 3 measures. The total number of IGF1 measurements was 404 with duration of 2 months to 18 years, and with at least one measurement at every year of age from 1 to 35, and 10 measurements above age 35. Three observations had to be excluded from the final predictive model as Tanner stage was not available.
Statistical analysis
Analyses were performed in SAS 9.2 (Cary, NC). Means (standard deviations) and percentages for all included variables, are presented across individuals, as well as across all observations.
Mixed models were fit with random individual intercepts and robust standard errors to accommodate repeated measures. Cubic spline functions of IGF-1 on age with 1 knot at age 20, resulted in good fit. This structure was used for: (1) A model on age only for graphing the relationship between age and mean IGF-1, overall. (2) A model on age and gender. (3) A final model, built by adding all variables to the age, gender model, and retaining those that remained significant (at p<0.05). All interactions between variables were investigated and retained if significant (p<0.05). The three study samples had considerable overlap in age, but not duration, and duration was therefore fit separately within the longitudinal and bone study samples. Duration varied little among the baseline samples and was set to 0 for these samples. For model (2) we also report the within individual correlation as a measure of tracking. Model fit was checked by residual plots. A sensitivity analysis limited models to the longitudinal study. Histograms of residuals indicated that IGF-1 was fairly normally distributed conditionally on age and other covariates, and that no transformation was necessary.
Comparison with normative values
We compared the relationship of mean IGF-1 to age for men and women separately to those from the study by Brabant et al. of individuals without diabetes [13]. For the comparison, we graphed mean IGF-1 across two year intervals from our study, and used the equations provided by Brabant et al. We selected this comparison as having a large sample size of individuals of European heritage similar to our sample and a wide age range. Brabant et al. analyzed sera by the Nichols method, considered equivalent to DSL for adults by Ranke et al. [33], but needing an addition of 35.5 for DSL equivalents according to Krebs et al. [32]. Based on our regression analysis comparing residuals at each age, we found the latter transformation leading to better consistency in our data, and added 35.5 to the IGF-1 means of Brabant et al. prior to graphing. Brabant’s means were obtained by transforming IGF-1 to the power 0.4 and then back-transforming the means. Doing so in our data resulted in means undistinguishable from those using untransformed analyses. However, we applied the transformation for comparing the standard deviations provided by Brabant et al. to those estimated from our data.
Results
Table 1 shows sample descriptive statistics. Differences in characteristics across persons versus measures reflect that individuals with a larger number of follow-up points are followed into older age and longer durations. The age averaged across IGF-1 sampling is late adolescent, but the majority of IGF-1 measurements were in Tanner stages 1 or 5. Approximately half the IGF-1 measures were obtained at baseline and half at one of the follow-up exams. As a result of including data from the bone density study, women had more IGF-1 measures than did men.
Table 1.
Description of individuals and total observations
| Variable | Mean(SD)or % across persons N=258 |
Mean or % across observations ‡ N=404 |
|---|---|---|
| N per person | 1.6 (0.89) | |
| IGF-1 (ng/ml) DSL equivalent | 185 (104) | 191 |
| Baseline exam | 54% | 44% |
| Longitudinal | 24% | 34% |
| Bone study | 23% | 22% |
| Women | 55% | 61% |
| Age (years) | 16 (9.1) | 17 |
| Duration (years) | 5.2 (5.2) | 5.9 |
| Height (cm) | 149 (25.7) | 151 |
| Weight (kg) | 53 (24) | 55 |
| BMI (kg/m2) | 21.9 (5.4) | 22.2 |
| HbA1c (%) | 8.3 (1.7) | 8.5 |
| Insulin dose/kg | 0.75 (0.28) | 0.77 |
| Tanner stage 1† | 36% | 32% |
| Tanner stage 2† | 3.4% | 3.5% |
| Tanner stage 3† | 6.4% | 5.5% |
| Tanner stage 4† | 8.5% | 10% |
| Tanner stage 5† | 45% | 49% |
Tanner stage was available for n=255 individuals n= 401 observations.
SD not provided due to correlation between observations on same individual.
Figure 1 shows a scatter plot of the IGF-1 data across age and the result of fitting a curve to the relationship. The graph indicates similarity of (transformed to DSL) results from the three study stages and good fit of the curve. IGF-1 rises rapidly during childhood and early adolescence, reaches a peak in mid adolescence and declines at a slow rate after age 20. Values far from the mean occur in both directions, especially during adolescence. Adding sex to the equation (model 2) indicated that women had on average 28 ng/ml higher IGF-1 (p=0.005) but declined more rapidly after age 20 (p=0.002). The relationship of IGF-1 to age was almost identical in the full and longitudinal samples. There was statistically significant, but substantively small tracking of IGF-1 within individual in the full sample, with an intraclass correlation between residuals of r=0.20 (p=0.009). Tracking was higher within the longitudinal group at r=0.49 (p=0.001). Comparing standard deviations of (IGF-1)0.4 around the age and sex trend with those of Brabant et al. showed a higher standard deviation across all data and methods in our study (1.37 versus 1.18), but a lower standard deviation within our longitudinal sample (1.04).
Figure 1.

Relationship of IGF-1 from the Wisconsin Diabetes Registry Study of Type 1 diabetes to age. Values from three study stages are transformed to DSL equivalents.
Figures 2 and 3 show mean IGF-1 by age separately for women and men compared to the age trends in the sample without diabetes of Brabant et al. [13]. IGF-1 in our sample is substantively lower, except for at the older ages, where the sample size in our study is small. For women, there also appears to be a delay in the adolescent peak in IGF-1 with T1D.
Figure 2.
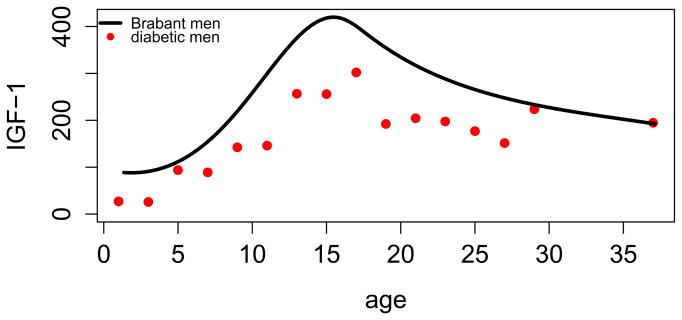
Comparison of normative mean IGF-1 of men in Brabant et al. [13] to mean IGF-1 from the Wisconsin Diabetes Registry Study of Type 1 diabetes. All values are transformed to DSL equivalents.
Figure 3.
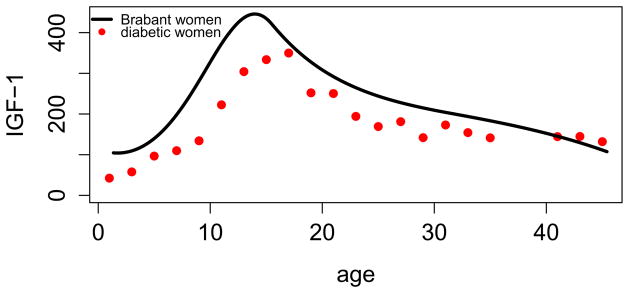
Comparison of normative mean IGF-1 of women in Brabant et al. [13] to mean IGF-1 from the Wisconsin Diabetes Registry Study of Type 1 diabetes. All values are transformed to DSL equivalents.
Table 2 shows the relationships of general and diabetes related characteristics to IGF-1, after adjusting for age and sex. In this model, differences between methods of IGF-1 measurement were small and not statistically significant. There was a strong negative duration trend on IGF-1 between 4 and 9 years duration, but no association at longer durations. IGF-1 for women remained higher than for men in the full model, and declined faster after age 20. Higher insulin dose is moderately associated with higher IGF-1, as is lower HbA1c at puberty and post puberty. HbA1c was much more strongly related to IGF-1 at Tanner stages 1 and 2. Conversely, the lower IGF-1 at Tanner stages 1 and 2 was amplified by higher HbA1c. Tanner stage was strongly associated with IGF-1 even taking age into account. Weight was significant for women with a low coefficient. Regression coefficients for all variables were very similar when restricting the analyses to the longitudinal subsample, although statistical significance was not present for all variables, due to the smaller sample size.
Table 2.
Relationship of covariates to mean IGF-1 (DSL units) in full model, adjusted for age relationship to mean IGF-1.
| Variable | Difference in mean IGF-1 | Standard error Of difference | p-value |
|---|---|---|---|
| Duration per year during 4–9 years (Longitudinal)† | −10.1 | 2.3 | <0.0001 |
| Women vs. men (at age 20 and 50 Kg)# | 31 | 10.1 | 0.002 |
| Weight for women(/Kg) | 0.66 | 0.21 | 0.002 |
| Insulin dose (0.10 unit/kg) | 2.9 | 1.3 | 0.03 |
| HbA1c (%) for Tanner stage 1–2‡ | −16.1 | 3.6 | <0.0001 |
| HbA1c (%) for Tanner stage 3–5‡ | −6.1 | 2.7 | 0.02 |
| Tanner stage 3–5 vs 1–2 (at mean HbA1c=8.5%)‡: | 121 | 24 | <0.0001 |
p=0.05 for sex by weight interaction
p=0.006 for duration by study stage interaction
p=0.03 for Tanner stage 1–2 versus 3–5 by HbA1c interaction
Associations of IGF-1 with other available variables including height and BMI were not statistically significant, nor were other interactions.
Discussion
The results of our relatively large study following an incident cohort with T1D support previous findings that IGF-1 is lower with T1D than in normative populations of the same age and gender. We found that although IGF-1 rises during adolescence in a pattern similar to that in non-diabetic individuals, the peak is lower on average for both girls and boys, and may in addition be delayed for girls. This latter finding is consistent with our report of delayed menarche in girls with T1D in poor glycemic control [34]. Indeed, we found that the association of higher HbA1c with lower IGF-1 is particularly strong during pre- and early puberty. We also found that IGF-1 declined most rapidly during the first decade with diabetes, and that higher insulin dose was associated with higher IGF-1. These associations with diabetes characteristics yield further credence to T1D causing lower IGF-1 levels, and the potential relationship of IGF-I to glycemic control in early puberty.
Our results supply detail to previous findings that concentrated on hyperglycemia and low insulin availability as risk factors for low IGF-1 with T1D [4,24–25]. Finding these associations can be elusive for several reasons. First of all, IGF-1 is part of a feedback loop, where individuals with lower IGF-1 also have higher insulin resistance, possibly concealing the effect of higher insulin dose. The lag time of the effect of exogenous insulin is not known, but may be short, making it difficult to track associations. Similar difficulties may accompany studying the effect of hyperglycemia on IGF-1. Nonetheless, diabetes management behaviors may be consistent over short time periods, and hence associations were discernible, although most likely underestimated.
Second, information on management behavior, including insulin dose, must by definition rely on self report. Hence, associations may be weakened by recollection errors. These are magnified when dose must be converted to per kilogram, and the individual may not have been weighed recently. In our data, almost all individuals were weighed close to IGF-1 measurement, but wide fluctuations in weight were not uncommon. We averaged insulin dose over a year close to the sampling of IGF-1, as other ways of choosing time points for dose and weight would have been no less arbitrary.
The measurement of IGF-1 has proven challenging, and methods have changed with time, compromising comparability in long term follow-up. Investigations of Ranke et al. [33] and Krebs et al. [32] illuminated the differences, and derived formulas for translation between methods. There is no certainty that their equations apply at all levels of IGF-1 and for individuals with different characteristics. The equations reconciled differences between some normative studies [8–14], but increased differences between others. In addition, it has been found that different methods of preparing samples have poorer agreement in individuals with diabetes than in those with normal glucose metabolism [35]. Nonetheless, use of the equations appears to have largely reconciled results from samples analyzed in our study by three different methods.
It is difficult to assess exactly how much lower IGF-1 is with T1D. The study we chose for comparison [13] had lower IGF-1 than other normative studies, so from this angle our comparison is conservative. However, our IGF-1 measures arose from plasma samples, while most or all normative studies used sera. One study showed plasma levels to be lower than serum levels [36].
Research into factors affecting IGF-1 including age have used different statistical models. IGF-1 was often transformed by log, square root or other power functions, and then mean values were back-transformed [8–13]. As these approaches do not estimate the actual mean IGF-1 by e.g. age, results are difficult to compare. We found, that since our data were fairly symmetrically distributed at each age, a transformation had little effect. However, this would not be the case in studies with more skewed distributions of IGF-1.
We found a very moderate level of tracking in IGF-1 across time in the same individual. Several factors may contribute to this. For example, there may be unmeasured, and not concurrently enough measured aspects of diabetes management and life style affecting IGF-1. It has been shown that IGF-1 fluctuates with diet [37] and possibly exercise, although the evidence for the latter is weak and has been considered mostly in much older individuals [38].
It is quite likely that sample preparation and measurement accuracy plays a role. A wide range of same-day coefficients of variation have been reported for the various assays, and most have been below 10%. In comparison, our within person variability is high. However, the variation in our sample was quite comparable to that found by Brabant et al. [13] in their normative sample. Our longitudinal data allow us to split this variability into between and within person components. Disturbingly we find that much of it occurs within person. One may assume that the use of different assay techniques increased this variation. Notably, the variation was smaller when limiting analysis to the longitudinal subgroup. In addition to the consistency of method in this subgroup, the Siemens technique used in this study stage has been reported to be more accurate than other methods by Krebs et al. [32]. Another possibility that measures closer in time may be more highly correlated, was not supported by fitting different correlation structures to the data.
Low and high IGF-1 have been linked to a number of T1D complications, but this also has remained somewhat elusive, and almost all studies of the associations to date have been too small. Our results illuminate that it is challenging to identify associations between IGF-1 and long term complications, even when they exist. If within individual values do not track well, it may be exceedingly error prone to classify individuals as low or high in the long term, and a very large sample size will be required. The pattern we found with age, duration and diabetes care, also means that these variables need to be adjusted for when comparing individuals with and without diabetes complications. This presents difficulties in population based and clinical research, and even more so in the applications to clinical practice. At a minimum, better understanding of the sources of variation is essential. There is hope that newer assays may produce more accurate results [39].
Nonetheless, physiologic studies and the association of low IGF-1 with suboptimal diabetes management present an opportunity for better understanding glycemic control. Our findings also point to the potential special importance of IGF-1 in the prepubertal child with T1D, i.e. at the earliest duration of T1D.
Acknowledgments
Grant support: The work was supported by grant DK036904 Recovery Act Administrative Supplement from the National Institute of Diabetes, Digestive and Kidney Diseases and by American Diabetes Association grant 1-05-CR-35.
Footnotes
Conflict of interest: There are no conflicts to report.
References
- 1.Froesch ER, Schmid C, Schwander J, Zapf J. Actions of insulin-like growth factors. Ann Rev Physiol. 1985;47:443–467. doi: 10.1146/annurev.ph.47.030185.002303. [DOI] [PubMed] [Google Scholar]
- 2.Le Roith D. Seminars in medicine of the Beth Israel Deaconess Medical Center. Insulin-like growth factors. N Engl J Med. 1997;336 (9):633–640. doi: 10.1056/NEJM199702273360907. [DOI] [PubMed] [Google Scholar]
- 3.Dunger DB, Acerini CL. IGF-1 and diabetes in adolescence. Diabetes & Metabolism. 1998;24 (2):101–107. [PubMed] [Google Scholar]
- 4.Bereket A, Lang CH, Blethen SL, Gelato MC, Fan J, Frost RA, Wilson TA. Effect of insulin on the insulin-like growth factor system in children with new-onset insulin-dependent diabetes mellitus. J Clin Endocrinol Metab. 1995;80 (4):1312–1317. doi: 10.1210/jcem.80.4.7536205. [DOI] [PubMed] [Google Scholar]
- 5.Yakar S, Setser J, Zhao H, Stannard B, Haluzik M, Glatt V, Bouxsein ML, Kopchick JJ, LeRoith D. Inhibition of growth hormone action improves insulin sensitivity in liver IGF-1-deficient mice. J Clin Invest. 2001;113(1):96–105. doi: 10.1172/JCI200417763. [DOI] [PMC free article] [PubMed] [Google Scholar]
- 6.Clemmons DR. The relative roles of growth hormone and IGF-1 in controlling insulin sensitivity. J Clin Invest. 2004;113 (1):25–27. doi: 10.1172/JCI200420660. [DOI] [PMC free article] [PubMed] [Google Scholar]
- 7.Clemmons DR. Role of Insulin-like growth factor in maintaining normal glucose homeostasis. Horm Res. 2004;62 (suppl 1):77–82. doi: 10.1159/000080763. [DOI] [PubMed] [Google Scholar]
- 8.Juul A, Holm K, Kastrup KW, Pedersen SA, Michaelsen KF, Scheike T, Rasmussen S, Müller J, Skakkebaek NE. Free insulin-like growth factor I serum levels in 1430 healthy children and adults, and its diagnostic value in patients suspected of growth hormone deficiency. J Clin Endocrinol Metab. 1997;829(8):2497–2502. doi: 10.1210/jcem.82.8.4137. [DOI] [PubMed] [Google Scholar]
- 9.Xu S, Gu X, Pan H, Zhu H, Gong F, Li Y, Xing Y. Reference ranges for serum IGF-1 and IGFBP-3 levels in Chinese children during childhood and adolescence. Endocr J. 2010;57(3):221–228. doi: 10.1507/endocrj.k09e-200. [DOI] [PubMed] [Google Scholar]
- 10.Bereket A, Turan S, Omar A, Berber M, Ozen A, Akbenlioglu C, Haklar G. Serum IGF-I and IGFBP-3 levels of Turkish children during childhood and adolescence: establishment of reference ranges with emphasis on puberty. Horm Res. 2006;65(2):96–105. doi: 10.1159/000091301. [DOI] [PubMed] [Google Scholar]
- 11.Juul A, Dalgaard P, Blum WF, Bang P, Hall K, Michaelsen KF, Muller J, Skakkebaek NE. Serum levels of insulin-like growth factor (IGF)-binding protein-3 (IGFBP-3) in healthy infants, children, and adolescents: the relation to IGF-I, IGF-II, IGFBP-1, IGFBP-2, age, sex, body mass index, and pubertal maturation. J Clin Endocrinol Metab. 1995;80 (8):2534–2542. doi: 10.1210/jcem.80.8.7543116. [DOI] [PubMed] [Google Scholar]
- 12.Kawai N, Kanzaki S, Takano-Watou S, Tada C, Yamanaka Y, Miyata T, Oka M, Seino Y. Serum-free insulin-like growth factor I (IGF-I), total IGF-I and IGF-binding protein-3 concentrations in normal children and children with growth hormone deficiency. J Clin Endocrinol Metab. 1999;84 (1):82–89. doi: 10.1210/jcem.84.1.5407. [DOI] [PubMed] [Google Scholar]
- 13.Brabant G, von zur Mühlen A, Wuster C, Ranke MB, Kratszsch J, Kiess W, Ketelslegers JM, Wilhelmsen L, Hulthen L, Saller B, Mattsson A, Wilde J, Schemer R, Kann P German KIMS Board. Serum insulin-like growth factor I reference values for an automated chemiluminescence immunoassay system: result from a multicenter study. Horm Res. 2003;60(2):53–60. doi: 10.1159/000071871. [DOI] [PubMed] [Google Scholar]
- 14.Elmlinger MW, Kühnel W, Weber MM, Ranke MB. Reference ranges for two automated chemiluminescent assays for serum insulin-like growth factor I (IGF-I) and IGF-binding protein 3 (IGFBP-3) Clin Chem Lab Med. 2004;42(6):654–664. doi: 10.1515/CCLM.2004.112. [DOI] [PubMed] [Google Scholar]
- 15.Bouillon R, Bex M, van Herck E, Laureys J, Dooms L, Lesaffre E, Ravussin E. Influence of age, sex, and insulin on osteoblast function: osteoblast dysfunction in diabetes mellitus. J Clin Endocrinol Metab. 1995;80(4):1194–1202. doi: 10.1210/jcem.80.4.7714089. [DOI] [PubMed] [Google Scholar]
- 16.Dills DG, Allen C, Palta M, Zaccaro DJ, Klein R, D’Alessio D. Insulin-like growth factor –I is related to glycemic control in children and adolescents with newly diagnosed insulin –dependent diabetes. J Clin Endocrin Metab. 1995;80 (7):2139–2143. doi: 10.1210/jcem.80.7.7608267. [DOI] [PubMed] [Google Scholar]
- 17.Ekman B, Nyström F, Arnqvist HJ. Circulating IGF-I concentrations are low and not correlated to glycaemic control in adults with T1D. Eur J Endocrinol. 2000;143(4):505–510. doi: 10.1530/eje.0.1430505. [DOI] [PubMed] [Google Scholar]
- 18.Jehle PM, Jehle DR, Mohan S, Bohm BO. Serum level of insulin-like growth factor system components and relationship to bone metabolism in Type 1 and Type 2 diabetes mellitus patients. J Endocrinol. 1998;159 (2):297–306. doi: 10.1677/joe.0.1590297. [DOI] [PubMed] [Google Scholar]
- 19.Teppala S, Shankar A. Association between serum IGF-1 and diabetes among U.S. adults. Diabetes Care. 2010;33 (10):2257–2259. doi: 10.2337/dc10-0770. [DOI] [PMC free article] [PubMed] [Google Scholar]
- 20.Amin R, Bahu TK, Widmer B, Dalton RN, Dunger DB. Longitudinal relation between limited joint mobility, height, insulin-like growth factor 1 levels, and risk of developing microalbuminuria: the Oxford Regional Prospective Study. Arch Dis Child. 2005;90 (10):1039–1044. doi: 10.1136/adc.2004.067272. [DOI] [PMC free article] [PubMed] [Google Scholar]
- 21.Amin R, Schultz C, Ong K, Frystyk J, Dalton RN, Perry L, Orskov H, Dunger DB. Low IGF-1 and elevated testosterone during puberty in subjects with T1D developing microalbuminuria in comparison to normoalbuminuric control subjects. The Oxford Regional Prospective Study. Diabetes Care. 2003;26 (5):1456–1461. doi: 10.2337/diacare.26.5.1456. [DOI] [PubMed] [Google Scholar]
- 22.Janssen JA, Lamberts SW. Circulating IGF-I and its protective role in the pathogenesis of diabetic angiopathy. Clinical Endocrinology. 2000;52 (1):1–9. doi: 10.1046/j.1365-2265.2000.00922.x. [DOI] [PubMed] [Google Scholar]
- 23.Payne JF, Tangpricha V, Cleveland J, Lynn MJ, Ray R, Srivastava SK. 2011 Serum insulin-like growth factor-I in diabetic retinopathy. Mol Vis. 17:2318–24. [PMC free article] [PubMed] [Google Scholar]
- 24.Hedman CA, Frystyk J, Lindström T, Chen JW, Flyvbjerg A, Orskov H, Arnqvist HJ. Residual beta-cell function more than glycemic control determines abnormalities of the insulin-like growth factor system in T1D. J Clin Endocrinol Metab. 2004;89 (12):6305–6309. doi: 10.1210/jc.2004-0572. [DOI] [PubMed] [Google Scholar]
- 25.Hedman CA, Orre-Pettersson A-C, Lindström T, Arnqvist HJ. Treatment with insulin lispro changes the insulin profile but does not affect the plasma concentrations of IGF-1 and IGFBP-1 in T1D. Clin Endocrinol. 2001;55(1):107–112. doi: 10.1046/j.1365-2265.2001.01327.x. [DOI] [PubMed] [Google Scholar]
- 26.LeCaire TJ, Palta M, Zhang H, Allen C, Klein R, D’Alessio D. Lower than expected prevalence and severity of retinopathy in an incident cohort followed during the first 4–14 years of Type 1 diabetes: The Wisconsin Diabetes Registry Study. American J Epidemiology. 2006;164 (2):143–150. doi: 10.1093/aje/kwj166. [DOI] [PubMed] [Google Scholar]
- 27.Danielson KK, Elliott ME, LeCaire T, Binkley N, Palta M. Poor Glycemic Control is Associated with Low Bone Density Detected in Premenopausal Women with T1D. Osteoporosis International. 2009;20(6):923–933. doi: 10.1007/s00198-008-0763-3. [DOI] [PMC free article] [PubMed] [Google Scholar]
- 28.Duke PM, Litt IF, Gross RT. Adolescents’ self-assessment of sexual maturation. Pediatrics. 1980;66(6):918–920. [PubMed] [Google Scholar]
- 29.Palta M, LeCaire T, Daniels K, Shen G, Allen C, D’Alessio D. Risk factors for rehospitalization in a cohort with Type I diabetes. American J Epidemiology. 1997;146(8):627–636. doi: 10.1093/oxfordjournals.aje.a009328. [DOI] [PubMed] [Google Scholar]
- 30.Allen C, Zaccaro D, Palta M, Klein R, Duck SC, D’Alessio DJ. Glycemic control in the first two years of insulin-dependent diabetes mellitus. Diabetes Care. 1992;15(8):980–987. doi: 10.2337/diacare.15.8.980. [DOI] [PubMed] [Google Scholar]
- 31.Palta M, Shen G, Allen C, Klein R, D’Alessio D. Longitudinal glycosylated hemoglobin patterns from diagnosis in a population based cohort with IDDM. American J Epidemiology. 1996;144(10):954–961. doi: 10.1093/oxfordjournals.aje.a008865. [DOI] [PubMed] [Google Scholar]
- 32.Krebs A, Wallaschofski H, Spilcke-Liss E, Kohlmann T, Brabant G, Völzke H, Nauck M. Five commercially available insulin-like growth factor I (IGF-I) assays in comparison to the former Nichols Advantage IGF-I in a growth hormone treated population. Clin Chem Lab Med. 2008;46 (12):1776–1783. doi: 10.1515/CCLM.2008.349. [DOI] [PubMed] [Google Scholar]
- 33.Ranke MB, Osterziel KJ, Scheizer R, Schuett B, Weber K, Röbbel P, Vornwald A, Blumenstock G, Elmlinger W. Reference levels of insulin-like growth factor I in the serum of healthy adults: Comparison of four immunoassays. Clin Chem Lab Med. 2003;41(10):1329–1334. doi: 10.1515/CCLM.2003.203. [DOI] [PubMed] [Google Scholar]
- 34.Danielson KK, Palta M, Allen C, D’Alessio DJ. The association of increased total glycosylated hemoglobin levels with delayed age at menarche in young women with T1D. J Clin Endocrinol Metab. 2005;90(12):6466–6471. doi: 10.1210/jc.2005-0349. [DOI] [PMC free article] [PubMed] [Google Scholar]
- 35.Chestnut RE, Quarmby V. Evaluation of total IGF-I assay methods using samples from Type I and Type II diabetic patients. J of Immunol Meth. 2002;259 (1–2):11–24. doi: 10.1016/s0022-1759(01)00478-1. [DOI] [PubMed] [Google Scholar]
- 36.Koker I, Ennis M, Sills T, Goodwin P. Effects of sample handling and storage variables on the measurement of disease-relevant analytes in plasma and serum. [accessed 2/24/2014];Poster 35 at Biospecimen Symposium. 2009 http://biospecimens.cancer.gov/meeting/brnsymposium/2009/poster.asp.
- 37.Fontana L, Weiss EP, Villareal DT, Klein S, Hollozy JO. Long-term effects of calories and protein restriction on serum IGF-1 and IGFBP-3 concentrations in human. Aging Cell. 2008;7 (5):681–687. doi: 10.1111/j.1474-9726.2008.00417.x. [DOI] [PMC free article] [PubMed] [Google Scholar]
- 38.McTiernan A, Sorensen B, Yasui Y, Twroger SS, Ulrich CM, Irwin ML, Rudolph RE, Stanczyk FZ, Schwartz RS, Potter JD. No effect of exercise on insulin –like growth factor 1 and insulin-like growth factor binding protein 3 in postmenopausal women: a 12-month randomized clinical trial. Cancer Epidemiol Biomarkers Prev. 2005;14 (4):1020–1021. doi: 10.1158/1055-9965.EPI-04-0834. [DOI] [PubMed] [Google Scholar]
- 39.Janssen JA. Insulin-like growth factor I: pros and cons of a bioassay. Horm Res Paedr. 2011;76 (suppl 1):106–110. doi: 10.1159/000329191. [DOI] [PubMed] [Google Scholar]