

Abstract
Objective
To identify metabolite patterns associated with childhood obesity, to examine relations of these patterns with measures of adiposity and cardiometabolic risk, and to evaluate associations with maternal peripartum characteristics.
Design and Methods
We employed untargeted metabolomic profiling to quantify metabolites in plasma of 262 children (6–10 years). We used principal components analysis to consolidate 345 metabolites into 18 factors and identified two that differed between obese (BMI ≥95%ile; n=84) and lean children (BMI<85%ile; n=150). We then investigated relations of these factors with adiposity (fat mass, BMI, skinfold thicknesses) and cardiometabolic biomarkers (HOMA-IR, triglycerides, leptin, adiponectin, hsCRP, IL-6) using multivariable linear regression. Finally, we examined associations of maternal pre-pregnancy obesity, gestational weight gain, and gestational glucose tolerance with the offspring metabolite patterns.
Results
A branched-chain amino acid (BCAA)-related pattern and an androgen hormone pattern were higher in obese vs. lean children. Both patterns were associated with adiposity and worse cardiometabolic profiles. For example, each increment in the BCAA and androgen pattern scores corresponded with 6% (95% CI: 1%, 13%) higher HOMA-IR. Children of obese mothers had 0.61 (0.13, 1.08) higher BCAA score than their counterparts.
Conclusions
BCAA and androgen metabolites were associated with adiposity and cardiometabolic risk during mid-childhood. Maternal obesity may contribute to altered offspring BCAA metabolism.
Keywords: branched-chain amino acids, androgen, steroid hormones, DHEA-S, metabolomics, obesity, insulin resistance, untargeted
INTRODUCTION
Metabolomics, the quantitative analysis of metabolites and low-molecular-weight intermediates, has emerged as a tool to understand how metabolites reflect physiological states. Studies comparing obese and lean adults found substantial differences in circulating markers of amino acid (1–4) and lipid (2, 4) metabolism. Furthermore, perturbations in some of these metabolic pathways not only correlated with established cardiometabolic risk biomarkers, such as insulin resistance, independently of weight status (5, 6), but were also predictive of future disease (7, 8).
In attempt to replicate the adult findings in children, a handful of pediatric investigations examined the relation of weight status and/or glycemia with amino acid (8–11) and fatty acid metabolite profiles (9, 11). However, animal models (12) and two studies in adolescents (9, 10) indicate that physiological responses to metabolic disturbances may be fundamentally different in early life. Therefore, approaches aimed at validating findings from adults may fail to identify relevant metabolic pathways in youth. Metabolomic studies employing unbiased, data-driven approaches are needed to identify metabolic alterations unique to early life.
In this study, our objectives were threefold. First, using untargeted metabolic profiling we sought to identify metabolite patterns associated with childhood obesity. Next, we evaluated whether these patterns were also associated with continuous measures of adiposity and cardiometabolic risk biomarkers. Finally, we examined whether the extent to which maternal peripartum characteristics related to excess offspring weight, specifically pre-pregnancy obesity, excessive gestational weight gain (GWG), and gestational diabetes mellitus (GDM) - were associated with offspring metabolite profiles in mid-childhood.
METHODS
Study population
Participants were enrolled in Project Viva, an ongoing pre-birth cohort study recruited from a multi-specialty group practice in eastern Massachusetts (Harvard Vanguard Medical Associates). Details on study design and recruitment are reported elsewhere (13). The Institutional Review Board of Harvard Pilgrim Health Care approved all study protocols. All mothers provided written informed consent and children provided verbal assent.
Of 2128 live singleton births in Project Viva, 1116 mother-child pairs attended an in-person mid-childhood visit at 6–10 years, during which anthropometry was measured in all children and fasting blood samples were obtained from 648 assenting children. We excluded 21 participants with missing data on maternal prenatal characteristics. Among the remaining 627 mother-child pairs, funding was available for 300 metabolomic assays. We included all 113 cases of GDM and/or child obesity (n=87 child obesity, n= 22 GDM, n=4 both) to ensure sufficient numbers for each, and randomly selected 187 of the remaining plasma samples for analysis. After further exclusion of 38 children with inadequate plasma volume for the metabolomic assays, the final analytic sample included 262 mother-child pairs. As expected given the sampling strategy, children in this analysis had greater adiposity and a worse cardiometabolic profile than those not included (n=365). The sample also included a higher proportion of black (24.1% vs. 17.9%) and Hispanic (6.9% vs. 3.6%), nulliparous (48.9% vs. 40.1%), and single mothers (13.8% vs. 8.8%).
Maternal peripartum characteristics
Maternal obesity
At enrollment, mothers reported their pre-pregnancy weight and height, from which we calculated pre-pregnancy BMI. We used standard adult criteria (14) to define obesity (BMI ≥30 kg/m2).
Excessive gestational weight gain
We determined GWG as the difference between the last clinically-measured weight within 4 weeks prior to delivery and self-reported pre-pregnancy weight. We categorized GWG using current Institute of Medicine (IOM) guidelines (15).
Gestational diabetes mellitus
Obstetric clinicians screened all women for gestational diabetes at 26–28 weeks of gestation with a non-fasting oral glucose challenge to categorize women as having GDM, impaired glucose tolerance, isolated hyperglycemia or normoglycemia (16).
Child adiposity and cardiometabolic biomarkers
Anthropometry and DXA scan
Trained research assistants (RAs) measured children’s weight to the nearest 0.1 kg using an electronic scale (Tanita Inc., Arlington Heights, IL) and height to the nearest 0.1 cm with a calibrated stadiometer (Shorr Productions, Olney, MD). We defined obesity as body mass index (BMI; kg/m2) ≥95th percentile for age and sex according to the Centers for Disease Control growth reference (17). RAs also measured subscapular (SS) and triceps (TR) skinfold thickness to the nearest 0.1 mm using calipers (Holtain, Cross-well, UK). We used these values to calculate the sum (SS+TR) and ratio (SS/TR) of skinfold thicknesses. Waist circumference was measured to the nearest 0.1 cm with a non-stretchable measuring tape (Hoechstmass Balzer GmbH, Sulzbach, Germany). RAs administered whole-body DXA scans (Hologic, Bedford, MA). A single RA checked scans for positioning, movement, and artifacts, and defined the body regions. Intra-rater reliability for body compartments was high (r=0.99). We used DXA to obtain measures of total and trunk fat mass (kg).
We measured plasma fasting glucose enzymatically, and fasting insulin using an electrochemiluminescence immunoassay (Roche Diagnostics, Indianapolis, IN). We estimated insulin resistance using the homeostasis model assessment for insulin resistance (HOMA-IR). Triglycerides were measured enzymatically with correction for endogenous glycerol. We measured plasma leptin and adiponectin concentrations with a radioimmunoassay (Linco Research, St Charles, MO). We used an immunoturbidimetric high-sensitivity assay to determine C-reactive protein (hsCRP) concentrations (Roche Diagnostics, Indianapolis, IN). Plasma interleukin-6 (IL-6) was measured by ultrasensitive ELISA. Inter-assay CVs are reported in Supporting Information Appendix A.
Metabolic profiling
We carried out untargeted metabolomic profiling in plasma samples using a mass spectrometry-based approach. All analyses were conducted by Metabolon Inc® according to published methods (18). All samples were maintained at −80°C until processed. Details are reported in Supporting Information Appendix B.
Covariates
Using interviews and questionnaires, we collected information on maternal race/ethnicity, age, education, and parity; household income; child race/ethnicity; and paternal weight and height. We obtained birth characteristics including sex, birthweight, and delivery date from medical records. We determined birthweight-for-gestational-age z-scores (‘fetal growth’) using U.S. reference data (19). Small-for-gestational-age (SGA) and large-for-gestational-age (LGA) were defined as <10th percentile and ≥90th percentile for age and sex, respectively. Mothers reported on breastfeeding duration in postpartum questionnaires. At the mid-childhood visit, mothers provided information on their child’s dietary and lifestyle characteristics, and reported on pubarchal/pubertal phenotype based on appearance of body hair, breast development for girls, and deepening of voice for boys.
Data analysis
Prior to the main analysis, we examined bivariate associations by comparing background characteristics of obese vs. lean children to identify potential confounders.
We then carried out the analysis 3 steps, conforming to the study aims. First, we divided the children in to obese and lean, and compared their metabolite profiles. Second, we examined whether the metabolite profiles associated with obesity were also related to continuous indicators of adiposity and cardiometabolic risk using multivariable linear regression. Third, we evaluated the extent to which maternal peripartum characteristics influenced the metabolite patterns.
Step 1
The metabolomic analysis identified 345 compounds. For metabolites with concentrations below the lower limit of detection, we estimated them as half the minimum detected value. We used principal components analysis (PCA) to consolidate the raw metabolite variables into 18 groups of linearly independent components known as ‘factors,’ which accounted for 48.4% of total variance in the original metabolites (see Supporting Information Appendix C for details on PCA). The factors can be interpreted as the strength with which an individual’s metabolite profile followed the pattern captured by that particular cluster of metabolites.
To identify metabolite patterns of interest, we compared factor scores between obese (BMI ≥95th percentile; n=84) and lean (BMI<85th percentile; n=150) children and assessed the statistical significance of differences with the Wald test. Of the 18 factors, two were higher in obese children, even after accounting for multiple comparisons (α=0.05/18). We also compared concentrations of key constituent metabolites (those with factor loadings >0.5) within the two factors by obesity status. For these comparisons, metabolite concentrations were evaluated as z-scores centered at the median ([metabolite quant ion count − median value]/1 SD) after natural log-(ln)-transformation of non-normal distributions.
Step 2
Among all 262 children, we investigated whether the two factors associated with obesity were also related to continuous measures of overall (DXA total fat, BMI z-score, SS+TR) and central adiposity (DXA trunk fat, waist circumference, SS/TR) using linear regression models in which we assessed each adiposity indicator as an independent variable and the factor scores as outcomes. We selected covariates for multivariable analyses based on bivariate associations and known predictors of childhood obesity. We included maternal education and child age, sex, race/ethnicity, and fast-food intake in Model 1, followed by parent-reported pubarchal/pubertal phenotype in Model 2. Further adjustment for additional characteristics that differed by obesity status in Table 1 did not change results and were not included in the final models.
Table 1.
Characteristics of the study sample, overall and according to obese (BMI ≥95th percentile) and lean (BMI<85th percentile) status among 262 Project Viva mother-child pairsa
| All n = 262 |
Obese n = 84 |
Lean n = 150 |
Pb | |
|---|---|---|---|---|
|
|
||||
| Family & background characteristics | ||||
| Sociodemographic characteristics | ||||
| Child’s age (years) | 8.0 ± 0.9 | 8.2 ± 1.0 | 7.9 ± 0.8 | 0.006 |
| Female, % (N) | 50 (131) | 61.9 (52) | 44.0 (66) | 0.009 |
| Child’s race/ethnicity, % (N) | 0.0009 | |||
| White | 56.3 (147) | 38.1 (32) | 63.1 (94) | |
| African American | 24.1 (63) | 40.5 (34) | 17.5 (26) | |
| Hispanic | 6.9 (18) | 8.3 (7) | 7.4 (11) | |
| Asian | 0.8 (2) | 0.0 (0) | 1.3 (2) | |
| Other | 11.9 (31) | 13.1 (11) | 10.7 (16) | |
| Mother’s age at enrollment (years) | 32.0 ± 5.8 | 30.4 ± 5.7 | 32.4 ± 5.8 | 0.009 |
| Mother completed university education, % (N) | 22.2 (58) | 16.7 (14) | 28.9 (43) | 0.04 |
| Annual household income < 20 K, % (N) | 4.2 (10) | 7.0 (5) | 3.6 (5) | 0.27 |
| Father’s BMI (kg/m2) | 26.8 ± 4.0 | 27.9 ± 4.4 | 25.9 ± 3.5 | 0.001 |
| Perinatal & early life characteristics | ||||
| Mother’s pre-pregnancy BMI (kg/m2) | 26.0 ± 6.0 | 28.7 ± 7.1 | 24.4 ± 4.8 | <0.0001 |
| Excessive gestational weight gain, %(N) | 58.8 (154) | 64.3 (54) | 54.0 (81) | 0.13 |
| Gestational diabetes, % (N) | 8.4 (22) | 4.8 (4) | 10.7 (16) | 0.12 |
| C-section delivery, % (N) | 19.5 (51) | 19.1 (16) | 15.4 (23) | 0.48 |
| Mother smoked during pregnancy, % (N) | 13.7 (36) | 21.4 (18) | 11.3 (17) | 0.04 |
| Birthweight for gestational age z-score | 0.25 ± 0.97 | 0.19 ± 1.00 | 0.21 ± 0.93 | 0.83 |
| Duration of breastfeeding (months) | 5.9 ± 4.5 | 4.8 ± 4.4 | 6.5 ± 4.6 | 0.01 |
| Characteristics in mid-childhood | ||||
| Overall adiposity | ||||
| DXA total fat mass (kg) | 9.4 ± 5.5 | 15.5 ± 5.1 | 5.7 ± 1.6 | <0.0001 |
| BMI z-score | 0.8 ± 1.1 | 2.07 ± 0.29 | −0.04 ± 0.72 | <0.0001 |
| SS + TR (mm) | 24.5 ± 13.3 | 39.6 ± 11.2 | 15.7 ± 4.4 | <0.0001 |
| Central adiposity | ||||
| DXA trunk fat mass (kg) | 3.4 ± 2.5 | 6.1 ± 2.4 | 1.8 ± 0.6 | <0.0001 |
| Waist circumference (cm) | 63.8 ± 11.3 | 76.6 ± 9.5 | 56.5 ± 4.3 | <0.0001 |
| SS/TR | 0.75 ± 0.23 | 0.91 ± 0.27 | 0.67 ± 0.15 | <0.0001 |
| Height z-score | 0.41 ± 1.04 | 0.92 ± 0.83 | 0.08 ± 1.01 | <0.0001 |
| Conventional cardiometabolic biomarkers | ||||
| Fasting insulin (μIU/mL) | 9.7 ± 7.5 | 14.5 ± 9.7 | 6.9 ± 3.6 | <0.0001 |
| Fasting glucose (mg/dL) | 96.9 ± 16.5 | 97.5 ± 16.9 | 97.1 ± 16.9 | 0.87 |
| Triglycerides (mg/dL) | 62.4 ± 50.8 | 70.6 ± 35.6 | 54.9 ± 20.4 | <0.0001 |
| hsCRP (mg/dL) | 1.2 ± 3.7 | 2.7 ± 6.0 | 0.4 ± 1.1 | <0.0001 |
| IL-6 (pg/mL) | 1.1 ± 1.3 | 1.3 ± 1.3 | 0.9 ± 1.3 | 0.04 |
| Leptin (ng/mL) | 8.2 ± 9.7 | 15.1 ± 12.2 | 4.7 ± 5.7 | <0.0001 |
| Highest quartile of physical activity, % (N) | 26.5 (66) | 16.7 (13) | 31.5 (46) | 0.02 |
| Sugar-sweetened beverage intake (servings/day) | 0.4 ± 0.7 | 0.5 ± 0.8 | 0.3 ± 0.5 | 0.06 |
| Dietary intake >4 times/week, % (N) | ||||
| Fast-food | 0.8 (2) | 2.6 (2) | 0.0 (0) | 0.05 |
| Eggs | 8.1 (20) | 6.5 (5) | 9.0 (13) | 0.52 |
| Whole dairy | 43.7 (108) | 42.9 (33) | 43.5 (63) | 0.93 |
| Margarine | 3.2 (8) | 2.6 (2) | 3.5 (5) | 0.73 |
| Meat | 8.1 (20) | 5.2 (4) | 9.0 (13) | 0.31 |
| Pubertal status | ||||
| Body hair, % (N) | 19.3 (48) | 30.8 (24) | 14.4 (21) | 0.004 |
| Breast development, girls only % (N) | 32.5 (41) | 55.1 (27) | 13.6 (9) | <0.0001 |
| Deepening of voice, boys only % (N) | 6.5 (8) | 6.9 (2) | 6.3 (5) | 0.90 |
Values represent mean ± SD unless otherwise indicated.
Pearson’s chi-squared test for categorical variables; Wald test for continuous variables.
Next, we examined whether the metabolite patterns were related to established cardiometabolic biomarkers, including HOMA-IR, fasting insulin and glucose, triglycerides, leptin, adiponectin, hsCRP and IL-6. Using linear regression models where the biomarkers were the outcomes and the two factors were evaluated separately as independent variables, we obtained adjusted estimates using the same set of covariates described above. We ln-transformed all biomarkers because of non-normality; estimates for ln-transformed outcomes may be exponentiated and interpreted as a % change. We also examined associations of the key metabolites within the two factors with select biomarkers (HOMA-IR, leptin, hsCRP) using Model 1.
Step 3
We explored the extent to which maternal pre-pregnancy obesity, excessive GWG, and GDM were each associated offspring metabolite patterns. Using a separate linear regression model for each maternal characteristic, we assessed its relation with the factor scores as outcomes. In the multivariable models, we accounted for maternal education, father’s BMI, and child age, sex, and race/ethnicity; models for GWG and gestational glucose tolerance also included continuous pre-pregnancy BMI. To evaluate the extent to which the associations were mediated by child adiposity, we further adjusted for child BMI z-score. After we observed an association of maternal pre-pregnancy obesity with one of the factors, we also examined its relation with the key constituent metabolites.
We conducted tests for a statistical interaction with sex for all associations and found evidence that the relation between the adiposity indicators and one of the factors was stronger in boys than girls, so we examined these associations separately by sex. We also noted that this factor included several sex steroid hormone precursors, so we conducted a post hoc analysis comparing factor scores of the 74 children whose mothers reported signs of pubarche (body hair) or puberty (breast development for girls, voice deepening for boys) vs. the 175 with no pubarchal/pubertal signs. Excluding the pubarchal/pubertal participants yielded no substantial difference in the results, so we included all children in the analysis.
All analyses were performed using SAS 9.3 (SAS Institute Inc., Cary, NC).
RESULTS
Our sample included 84 obese (35.9%), 28 overweight (20.7%), and 150 normal weight (57.3%) children. Median age was 7.7 years; 50% were boys. Additional details on the study population are in Table 1.
Metabolite factors associated with obesity
Of the 18 metabolite patterns characterized via PCA, Factor 4 (mean±SD: 0.00±1.52), characterized by the branched-chain amino acids (BCAA) valine, leucine, and isoleucine and related intermediate metabolites, and Factor 9 (mean±SD: 0.00±1.62), composed of several androgen hormones, including dihydroepiandrostrone sulfate (DHEA-S), and their metabolites, were significantly higher in obese than lean children (Figure 1). Concentrations of key constituent metabolites (factor loadings>0.5) within the two patterns also differed by obesity status (Table 2 for metabolite z-scores, Table S1 for metabolite quant ion counts).
Figure 1.
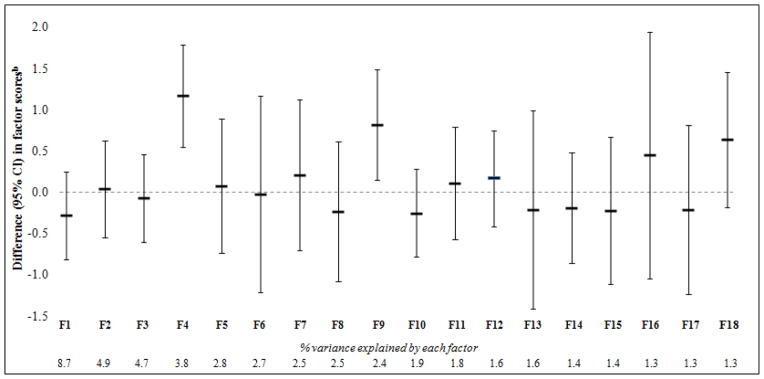
Comparison of 18 metabolite factor scores between obese (BMI ≥95th %ile) and lean (BMI<85th %ile) childrena
a Estimates are adjusted for child sex, age, and race/ethnicity.
b 95% CIs reflect Bonferroni’s correction for multiple comparisons (α = 0.05/18).
Table 2.
Plasma metabolite concentrations of obese versus lean children
| Metabolite concentration z-score | ||||
|---|---|---|---|---|
| Factor loading | Obese | Lean | Pb | |
| BMI ≥95th %ile n = 84 |
BMI <85th %ile n = 150 |
|||
|
|
||||
| Factor 4: mean ± SD = 0.00 ± 1.52 | ||||
| Valine | 0.83 | 1.17 ± 2.75 | −0.54 ± 2.47 | <0.0001 |
| Leucine | 0.76 | 1.38 ± 2.93 | −0.37 ± 2.66 | <0.0001 |
| Phenylalanine | 0.72 | 1.23 ± 3.02 | −0.27 ± 2.66 | <0.0001 |
| Isoleucine | 0.71 | 1.18 ± 2.84 | −0.37 ± 2.47 | <0.0001 |
| Propionylcarnitine (C3) | 0.66 | 0.95 ± 2.66 | −0.44 ± 2.29 | <0.0001 |
| 2-methylbutyrylcarnitine (C5) | 0.63 | 0.80 ± 2.66 | −0.03 ± 2.38 | 0.0002 |
| Isovalerylcarnitine | 0.60 | 1.34 ± 2.75 | −0.33 ± 2.38 | <0.0001 |
| Isobutyrylcarnitine | 0.56 | 1.19 ± 3.21 | 0.33 ± 2.84 | 0.001 |
| Tryptophan | 0.54 | 1.07 ± 3.02 | 0.21 ± 2.66 | 0.0007 |
| 3-methyl-2-oxovalerate (KMV) | 0.52 | 0.92 ± 2.75 | −0.11 ± 2.38 | <0.0001 |
| Kynurenine | 0.52 | 0.56 ± 2.93 | −0.19 ± 2.57 | 0.002 |
| Tyrosine | 0.51 | 1.54 ± 2.57 | 0.04 ± 2.29 | <0.0001 |
| Gamma-glutamylleucine | 0.51 | 0.53 ± 2.93 | −0.23 ± 2.57 | 0.002 |
| 4-methyl-2-oxopentanoate (KIC) | 0.51 | 0.73 ± 2.75 | −0.23 ± 2.38 | <0.0001 |
| Factor 9: mean ± SD: 0.00 ± 1.62 | ||||
| 4-androsten-3beta,17beta-diol disulfate 1* | 0.86 | 0.61 ± 2.84 | −0.49 ± 2.47 | <0.0001 |
| Dehydroepiandrosterone sulfate (DHEA-S) | 0.84 | 0.45 ± 2.47 | −0.41 ± 2.11 | <0.0001 |
| Epiandrosterone sulfate | 0.79 | 0.14 ± 2.93 | −0.70 ± 2.66 | 0.0007 |
| Androsterone sulfate | 0.79 | 0.30 ± 2.66 | −0.38 ± 2.38 | 0.002 |
| 4-androsten-3beta,17beta-diol disulfate 2* | 0.78 | 0.48 ± 3.21 | −0.74 ± 2.84 | <0.0001 |
| Pregn steroid monosulfate* | 0.76 | 0.70 ± 2.75 | −0.22 ± 2.38 | <0.0001 |
| Pregnen-diol disulfate* | 0.70 | 0.30 ± 2.75 | −0.14 ± 2.38 | 0.05 |
| Pregnenolone sulfate | 0.65 | 0.71 ± 3.02 | −0.09 ± 2.66 | 0.002 |
| Andro steroid monosulfate 2* | 0.61 | 0.41 ± 2.66 | −0.46 ± 2.38 | <0.0001 |
Estimates represent mean ± SD and are adjusted for child’s sex, age, and race/ethnicity.
From the Wald test.
Indicates tier 2 identification in which no commercially available authentic standards could be found, however annotated based on accurate mass, spectral and chromatographic similarity to tier 1 identified compounds.
Continuous adiposity measures and metabolite factors
After accounting for mother’s education, child sex, age, race/ethnicity, and fast-food intake, all adiposity measures were directly related to Factor 4 (Table 3). For example, each standard deviation (SD) of DXA total fat mass corresponded with 0.47 (95% CI: 0.27, 0.67) higher Factor 4 score. Further adjustment for pubarchal/pubertal phenotype did not attenuate the association (0.48 [0.28, 0.68]). The association with Factor 9 was stronger in boys (i.e. 1 SD of DXA total fat mass corresponded with 0.80 [0.48, 1.11] vs. 0.17 [−0.13, 0.47] higher Factor 9 score for boys vs. girls, respectively). Accounting for pubarchal/pubertal status slightly strengthened the association in boys (0.88 [0.56, 1.20]), but attenuated the magnitude by about half in girls (0.08 [−0.25, 0.40]) (Table 3).
Table 3.
Associations between adiposity indicators and factor scores
| Difference (95% CI) in factor scores | ||||||
|---|---|---|---|---|---|---|
| N | Unadjusted | N | Model 1 | N | Model 2 | |
|
|
|
|
||||
| Factor 4 | ||||||
| per 1 SD DXA total fat mass (kg) | 237 | 0.40 (0.22, 0.58) | 222 | 0.47 (0.27, 0.67) | 222 | 0.48 (0.28, 0.68) |
| per 1 SD BMI z | 262 | 0.49 (0.31, 0.66) | 246 | 0.49 (0.31, 0.68) | 246 | 0.52 (0.33, 0.71) |
| per 1 SD SS + TR (mm) | 262 | 0.50 (0.32, 0.67) | 245 | 0.56 (0.36, 0.76) | 245 | 0.58 (0.38, 0.78) |
| per 1 SD DXA trunk fat mass (kg) | 237 | 0.42 (0.24, 0.60) | 222 | 0.50 (0.30, 0.69) | 222 | 0.50 (0.30, 0.71) |
| per 1 SD waist circumference (cm) | 261 | 0.51 (0.33, 0.68) | 245 | 0.59 (0.39, 0.78) | 245 | 0.60 (0.41, 0.80) |
| per 1 SD SS/TR | 261 | 0.25 (0.07, 0.43) | 245 | 0.29 (0.09, 0.48) | 245 | 0.29 (0.10, 0.48) |
| Factor 9 | ||||||
| Boys | ||||||
| per 1 SD DXA total fat mass (kg) | 112 | 0.77 (0.49, 1.05) | 103 | 0.80 (0.48, 1.11) | 103 | 0.88 (0.56, 1.20) |
| per 1 SD BMI z | 131 | 0.50 (0.22, 0.78) | 121 | 0.48 (0.17, 0.79) | 121 | 0.51 (0.20, 0.82) |
| per 1 SD SS + TR (mm) | 130 | 0.78 (0.49, 1.06) | 120 | 0.75 (0.44, 1.07) | 120 | 0.82 (0.50, 1.13) |
| per 1 SD DXA trunk fat mass (kg) | 112 | 0.78 (0.50, 1.06) | 103 | 0.79 (0.48, 1.10) | 103 | 0.86 (0.55, 1.18) |
| per 1 SD waist circumference (cm) | 131 | 0.68 (0.41, 0.95) | 121 | 0.67 (0.37, 0.97) | 121 | 0.72 (0.41, 1.03) |
| per 1 SD SS/TR | 130 | 0.58 (0.30, 0.85) | 120 | 0.55 (0.27, 0.84) | 120 | 0.59 (0.30, 0.88) |
| Girls | ||||||
| per 1 SD DXA total fat mass (kg) | 125 | 0.23 (−0.04, 0.51) | 119 | 0.17 (−0.13, 0.47) | 119 | 0.08 (−0.25, 0.40) |
| per 1 SD BMI z | 131 | 0.23 (−0.03, 0.49) | 125 | 0.26 (−0.02, 0.53) | 125 | 0.20 (−0.10, 0.51) |
| per 1 SD SS + TR (mm) | 131 | 0.36 (0.10, 0.62) | 125 | 0.32 (0.03, 0.60) | 125 | 0.31 (−0.01, 0.63) |
| per 1 SD DXA trunk fat mass (kg) | 125 | 0.27 (−0.01, 0.54) | 119 | 0.18 (−0.12, 0.49) | 119 | 0.10 (−0.23, 0.43) |
| per 1 SD waist circumference (cm) | 130 | 0.32 (0.05, 0.58) | 124 | 0.23 (−0.07, 0.53) | 124 | 0.17 (−0.16, 0.51) |
| per 1 SD SS/TR | 131 | 0.31 (0.06, 0.56) | 125 | 0.20 (−0.08, 0.49) | 125 | 0.15 (−0.14, 0.44) |
Model 1: Adjusted for maternal education and child age, sex, race/ethnicity, and fast-food intake.
Model 2: Model 1 + parent-reported pubarchal/pubertal phenotype.
Metabolite factors and cardiometabolic biomarkers
Both metabolite factors were associated with biomarkers of cardiometabolic risk, including higher HOMA-IR, fasting insulin, leptin, triglycerides, and greater inflammation (Figure 2). For example, after accounting for confounders, each increment of Factor 4 and Factor 9 corresponded with 0.06 (0.01, 0.12) ln-transformed HOMA-IR, which translates to 6% (95% CI: 1%, 13%) higher HOMA-IR after back-transforming via exponentiation. Additionally, Factor 9 was inversely associated with adiponectin (−0.05 [−0.10, 0.00]). These associations persisted after accounting for pubarchal/pubertal status (Table S2). Many constituent metabolites of Factors 4 and 9 were also associated with the cardiometabolic biomarkers (select biomarkers presented in Table S3).
Figure 2.
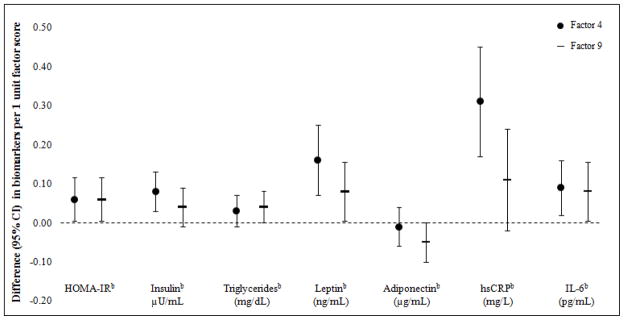
Associations between Factor 4 and 9 scores and cardiometabolic risk biomarkersa
a Estimates are adjusted for maternal education and child age, sex, race/ethnicity, and fast-food intake.
b Natural log transformed due to non-normal distributions.
Maternal peripartum characteristics and offspring metabolite factors
Children born to obese women (41.2%) had a higher Factor 4 score than their counterparts in unadjusted analysis (0.66 [0.23, 1.10]), and after accounting for maternal education, father’s BMI, and child age, sex, and race/ethnicity (0.61 [0.13, 1.08]; Table 4). The association was somewhat attenuated after accounting for child BMI z-score (0.38 [−0.08, 0.85]). Associations between pre-pregnancy obesity and key Factor 4 metabolites are presented in Table S4.
Table 4.
Associations of maternal peripartum factors with offspring metabolite factor scores in mid-childhood among 262 mother-child pairs in Project Viva
| Difference (95% CI) in factor score | |||
|---|---|---|---|
| Unadjusted n = 262 |
Model 1 n = 247 |
Model 2 n = 247 |
|
|
| |||
| Factor 4 | |||
| Maternal obesitya | 0.66 (0.23, 1.10) | 0.61 (0.13, 1.08) | 0.38 (−0.08, 0.85) |
| Excessive GWGb | 0.25 (−0.12, 0.62) | 0.29 (−0.09, 0.67) | 0.01 (−0.38, 0.41) |
| Gestational diabetesc | −0.35 (−1.01, 0.31) | −0.57 (−1.22, 0.09) | −0.38 (−1.02, 0.26) |
| Factor 9 | |||
| Maternal obesitya | 0.22 (−0.25, 0.69) | 0.09 (−0.41, 0.59) | −0.08 (−0.58, 0.43) |
| Excessive GWGb | 0.07 (−0.33, 0.47) | 0.13 (−0.27, 0.53) | 0.13 (−0.27, 0.53) |
| Gestational diabetesc | 0.29 (−0.42, 1.00) | 0.27 (−0.42, 0.96) | 0.44 (−0.24, 1.13) |
Model 1 Adjusted for mother’s education; father’s BMI; and child’s age, sex, and race/ethnicity. Models for GWG and GDM were additionally adjusted for pre-pregnancy BMI.
Model 2 Adjusted for Model 1 + child’s BMI z-score.
Defined as BMI ≥30 kg/m2 (n = 59) vs. BMI <30 kg/m2 (n = 203)
GWG: gestational weight gain; Excessive GWG (n = 54) vs. normal/inadequate GWG (n = 108).
GDM: n = 22 vs. no GDM: n = 240.
After covariate adjustment, excessive GWG, which occurred in 8.3% of mothers, was modestly associated with Factor 4 (0.29 [−0.09, 0.67]). The association became null after adjusting for child BMI z-score (0.01 [−0.38, 0.41]). GDM was inversely related to Factor 4, though the 95% CI was wide (−0.57 [−1.22, 0.09]); accounting for child BMI z-score attenuated the estimate (−0.38 [−1.02, 0.26]). None of the peripartum characteristics was associated with Factor 9.
Post-hoc analysis
In light of the androgen hormone composition of Factor 9, we conducted an exploratory analysis comparing factor scores for children with parent-reported pubarchal (body hair; n=48) or pubertal characteristics (breast development for girls, n=27; voice deepening for boys; n=8) vs. those with none (n=175 overall, n=101 boys, n=74 girls). Children with body hair and girls with breast development had a higher Factor 9 score than their counterparts (body hair: 0.70 [0.19, 1.21]; breast development: 0.64 [0.06, 1.21]); the associations were somewhat attenuated after adjustment for BMI z-score (body hair: 0.55 [0.04, 1.05]; breast development: 0.52 [−0.13, 1.17]). A similar trend was observed for voice deepening in boys, although there were only 8 participants in this group.
DISCUSSION
In this study of school-age children, we identified two metabolite patterns that differed between obese and lean youth: Factor 4, which was driven by branched-chain amino acids (BCAA) and related metabolites; and Factor 9, characterized by androgen hormones. Higher factor scores for these patterns corresponded with continuous measures of overall and central adiposity, and were also associated with established cardiometabolic biomakers. Additionally, maternal obesity was related to a higher score for the BCAA-related pattern in offspring.
Factor 4: BCAA-related pattern
Obese children had a higher factor score for the BCAA-related pattern than their lean counterparts. Accordingly, obese particiapnts also had higher concentrations of key constituent metabolites, including the BCAA valine, leucine, and isoleucine, and downstream intermediates of BCAA metabolism including C3- and C5-acylcarnitines, isovalerylcarnitine, isobutyrylcarnitine, 3-methyl-2-oxovalerate (keto-3-methylvalerate [KMV]), and 4-methyl-2-oxopentanoate (2-ketoisocaproate [KIC]). Additionally, obese children had higher levels of the large neutral amino acids (LNAA), phenylalanine, tyrosine, and tryptophan, which compete with BCAA for cellular transport via the LAT1 protein (20). It is possible that LAT1 expression is decreased in obese persons, thereby contributing to higher circulating levels of both LNAA and BCAA. This pattern also included kynurenine, a tryptophan metabolite; and gamma-glutamylleucine, which is generated during protein catabolism.
All adiposity indicators were directly related to the BCAA-related pattern. We noted that the relations were slightly stronger for measures of central adiposity (DXA trunk fat and waist circumference). In children, central adiposity measured by DXA is a proxy for metabolically active visceral adipose tissue (21), which may play a role in dysregulated BCAA metabolism through its association with insulin resistance (1)..
Several mechanisms may explain the positive association between adiposity and the BCAA-related pattern. First, impairment in distal metabolic pathways could lead to incomplete BCAA oxidation (22). Second, the gut microbiome, which contains bacteria capable of de novo BCAA synthesis, may differ in obese vs. lean individuals and thereby contribute to circulating BCAA (23). Finally, obese persons may experience greater skeletal muscle degradation due to insulin resistance (24), resulting in greater release of BCAA into circulation.
In agreement with evidence in adults (1, 5–7), we found that higher circulating BCAA and metabolites related to BCAA metabolism were associated with insulin resistance. The relation between BCAA and insulin resistance is complex, and it is not clear whether the observed elevations in circulating BCAA among obese persons are adequate to elicit insulin resistance. While a growing literature demonstrates that plasma BCAA are higher in insulin resistant humans and animals (5, 7, 25–27), possibly due to increased mitochondrial free fatty acid oxidation with insulin resistance (28), it is possible that elevated BCAA is an effect rather than a cause of insulin resistance. Longitudinal and experimental studies are warranted to disentangle temporality and causality of the relations between excess adiposity, insulin resistance, and circulating BCAA levels.
Current literature regarding BCAA and insulin resistance in youth is sparse, and findings have not been consistent. Two cross-sectional investigations in adolescents with and without dysglycemia found that higher plasma BCAA were related to higher insulin sensitivity (9) and better β-cell function (10). The investigators postulated that the opposing trend for adolescents vs. adults could be explained by adaptive metabolic plasticity in early life that becomes dysfunctional with age and continued obesity (9, 10). However, a recent study of 69 healthy children and adolescents observed no association between BCAA and HOMA-IR at the time of recruitment, but higher BCAA at baseline predicted worsening of insulin resistance during eighteen months of follow-up among the 17 participants with complete data (8). The discrepancies in study findings are difficult to reconcile because of inter- and intra-study variation in age, pubertal status, and glycemia.
In our study, the BCAA-related pattern was also directly associated with triglycerides, leptin, hsCRP, and IL-6. Because adipocytes secrete leptin and pro-inflammatory cytokines (29), and are involved in regulation of serum lipids (29, 30), these relations could reflect endocrine properties of adipose tissue. Alternatively, some of these associations could occur independently of fat mass. For example, since leucine influences leptin secretion via the mammalian target of rapamycin (mTOR) signaling pathway (31), higher BCAA could elicit increases in leptin independently of fat mass.
Factor 9: androgen hormone pattern
Androgen levels were higher in obese than lean children, including DHEA-S and its derivatives epiandrosterone and androsterone sulfate. Obese children also had higher levels of several intermediates androgen steroidogenesis from cholesterol, including pregnenolone sulfates and the testosterone precursors 4-androsten-3beta, 17beta-diol disulfate 1 and 17beta-diol disulfate 2.
The metabolites in Factor 9 likely represent increased androgen synthesis. Accordingly, children with parent-reported pubarchal/pubertal characteristics had a higher score for this pattern than their counterparts, even after accounting for BMI z-score, which itself is related to pubarche/puberty onset. Children with greater adiposity had a higher score for the androgen hormone pattern. This pattern was also related to higher HOMA-IR, fasting insulin, triglycerides, leptin, hsCRP, and IL-6, and lower adiponectin. These findings are consistent with the physiological shifts related to early sexual maturation (32) driven by sex steroid stimulation of the insulin-like growth factor/growth hormone (IGF/GH) axis (33). In addition to exacerbating insulin resistance, the changes in IGF/GH axis may also increase leptin synthesis (34), inflammation (35), and lipid profiles (33, 36). Considering that early adrenarche may increase risk of cardiometabolic disorders in later life, such as metabolic syndrome and polycystic ovary syndrome (37), future studies exploring the relation of specific metabolites within this pattern with prospective changes in metabolic risk may help to identify preventive strategies.
Associations with maternal peripartum characteristics
Maternal pre-pregnancy obesity predicted higher BCAA and related metabolites in offspring. Although this relation was somewhat mediated by child adiposity, our finding suggests that maternal obesity may have an independent influence on offspring metabolism. While we are not aware of other human studies investigating the influence of peripartum characteristics on offspring metabolite patterns, a study of maternal-fetal macaque pairs identified differences in global metabolomic profiles of offspring born to obese vs. lean dams independently of maternal diet during breeding and pregnancy (38).
Our study has some limitations. The sample size for obese children was relatively small, so the study may be underpowered to detect smaller effects. Also, the cross-sectional assessment of metabolic profiles with mid-childhood adiposity and cardiometabolic risk precludes temporal inference. Strengths of this study include the systematic metabolomic profiling analysis, an unbiased data-driven approach to indentifying metabolite patterns associated with childhood obesity, research-quality measures of body composition and cardiometabolic biomarkers, and rich data on important covariates.
In conclusion, higher circulating levels of BCAA and androgen hormones were associated with adiposity and established cardiometabolic biomarkers in school-age children. Longitudinal studies are necessary to determine causality.
Supplementary Material
What is already known
Disturbances in certain metabolic pathways, such as fatty acid and amino acid metabolism, are associated with obesity, subclinical cardiovascular markers, and future disease risk in adults.
Because aberrations in metabolite pathways precede clinical disease, identifying metabolic profiles associated with obesity and metabolic derangements early in life could provide insight on pathophysiology and enhance preventive efforts.
What this study adds
Obesity during mid-childhood (6–10 years) is associated with higher serum levels of branched chain amino acids (BCAA) and related metabolites of BCAA metabolism, and androgen sex steroid hormones.
Both metabolite patterns were also directly related to continuous measures of adiposity and cardiometabolic biomarkers, including insulin resistance, adipocytokines, and inflammation.
Maternal obesity prior to pregnancy may play a role in dysregulation of BCAA metabolism in offspring.
Acknowledgments
Funding/support: This study was funded by the US National Institutes of Health (K24 HD069408, R37 HD 034568, P30 DK092924). Dr. Perng is supported by the Thomas O’ Pyle Fellowship.
Abbreviations
- BCAA
branched-chain amino acid
- BMI
body mass index
- CI
confidence interval
- DHEA-S
dehydroepiandrosterone - sulfate
- DXA
dual x-ray absorptiometry
- HDL-C
high density lipoprotein cholesterol
- HOMA-IR
homeostatic model assessment insulin resistance
- hsCRP
high sensitivity C-reactive protein
- IL-6
interleukin-6
- IRS-1
insulin receptor substrate 1
- LNAA
large neutral amino acids
- mTOR
mammalian target of rapamycin
- PCA
principal components analysis
Footnotes
Conflicts of interest: Steven Watkins and Ryan Michalek are employees of Metabolon Inc.
WP conducted analyses, wrote the paper, and has primary responsibility for the content. EO, MEP, and MWG conceived the study idea. RDM and SW carried out experiments. AF and EI contributed to interpretation of findings. All authors were involved in writing the paper and approved the submitted version.
Disclaimer: The funder was not involved in the design and conduct of the study; collection, management, analysis, or interpretation of the data; and preparation, review, or approval of the manuscript
References
- 1.Newgard CB, An J, Bain JR, Muehlbauer MJ, Stevens RD, Lien LF, et al. A branched-chain amino acid-related metabolic signature that differentiates obese and lean humans and contributes to insulin resistance. Cell Metab. 2009;9(4):311–326. doi: 10.1016/j.cmet.2009.02.002. [DOI] [PMC free article] [PubMed] [Google Scholar]
- 2.Kochhar S, Jacobs DM, Ramadan Z, Berruex F, Fuerholz A, Fay LB. Probing gender-specific metabolism differences in humans by nuclear magnetic resonance-based metabonomics. Anal Biochem. 2006;352(2):274–281. doi: 10.1016/j.ab.2006.02.033. [DOI] [PubMed] [Google Scholar]
- 3.Mihalik SJ, Goodpaster BH, Kelley DE, Chace DH, Vockley J, Toledo FG, et al. Increased levels of plasma acylcarnitines in obesity and type 2 diabetes and identification of a marker of glucolipotoxicity. Obesity. 2010;18(9):1695–1700. doi: 10.1038/oby.2009.510. [DOI] [PMC free article] [PubMed] [Google Scholar]
- 4.Oberbach A, Bluher M, Wirth H, Till H, Kovacs P, Kullnick Y, et al. Combined proteomic and metabolomic profiling of serum reveals association of the complement system with obesity and identifies novel markers of body fat mass changes. J Proteome Res. 2011;10(10):4769–4788. doi: 10.1021/pr2005555. [DOI] [PubMed] [Google Scholar]
- 5.Tai ES, Tan ML, Stevens RD, Low YL, Muehlbauer MJ, Goh DL, et al. Insulin resistance is associated with a metabolic profile of altered protein metabolism in Chinese and Asian-Indian men. Diabetologia. 2010;53(4):757–767. doi: 10.1007/s00125-009-1637-8. [DOI] [PMC free article] [PubMed] [Google Scholar]
- 6.Huffman KM, Shah SH, Stevens RD, Bain JR, Muehlbauer M, Slentz CA, et al. Relationships between circulating metabolic intermediates and insulin action in overweight to obese, inactive men and women. Diabetes Care. 2009;32(9):1678–1683. doi: 10.2337/dc08-2075. [DOI] [PMC free article] [PubMed] [Google Scholar]
- 7.Wang TJ, Larson MG, Vasan RS, Cheng S, Rhee EP, McCabe E, et al. Metabolite profiles and the risk of developing diabetes. Nat Med. 2011;17(4):448–453. doi: 10.1038/nm.2307. [DOI] [PMC free article] [PubMed] [Google Scholar]
- 8.McCormack SE, Shaham O, McCarthy MA, Deik AA, Wang TJ, Gerszten RE, et al. Circulating branched-chain amino acid concentrations are associated with obesity and future insulin resistance in children and adolescents. Pediatr Obes. 2013;8(1):52–61. doi: 10.1111/j.2047-6310.2012.00087.x. [DOI] [PMC free article] [PubMed] [Google Scholar]
- 9.Mihalik SJ, Michaliszyn SF, de las Heras J, Bacha F, Lee S, Chace DH, et al. Metabolomic profiling of fatty acid and amino acid metabolism in youth with obesity and type 2 diabetes: evidence for enhanced mitochondrial oxidation. Diabetes Care. 2012;35(3):605–611. doi: 10.2337/DC11-1577. [DOI] [PMC free article] [PubMed] [Google Scholar]
- 10.Michaliszyn SF, Sjaarda LA, Mihalik SJ, Lee S, Bacha F, Chace DH, et al. Metabolomic profiling of amino acids and beta-cell function relative to insulin sensitivity in youth. J Clin Endocrinol Metab. 2012;97(11):E2119–2124. doi: 10.1210/jc.2012-2170. [DOI] [PMC free article] [PubMed] [Google Scholar]
- 11.Wahl S, Yu Z, Kleber M, Singmann P, Holzapfel C, He Y, et al. Childhood obesity is associated with changes in the serum metabolite profile. Obes Facts. 2012;5(5):660–670. doi: 10.1159/000343204. [DOI] [PubMed] [Google Scholar]
- 12.Lenaers E, De Feyter HM, Hoeks J, Schrauwen P, Schaart G, Nabben M, et al. Adaptations in mitochondrial function parallel, but fail to rescue, the transition to severe hyperglycemia and hyperinsulinemia: a study in Zucker diabetic fatty rats. Obesity. 2010;18(6):1100–1107. doi: 10.1038/oby.2009.372. [DOI] [PubMed] [Google Scholar]
- 13.Oken E, Baccarelli AA, Gold DR, Kleinman KP, Litonjua AA, De Meo E, Rich-Edwards JW, Rifas-Shiman SL, Sagiv S, Taveras EM, Weiss ST, Gillman MW. Cohort profile: Project Viva. Int J Epidemiol. 2014 Mar 18; doi: 10.1093/ije/dyu008. (Epub ahead of print) [DOI] [PMC free article] [PubMed] [Google Scholar]
- 14.World Health Organization. BMI Classification. [Accessed 5/21, 2012];Global Database on Body Mass Index. http://apps.who.int/bmi/index.jsp?introPage=intro_3.html.
- 15.Institute of Medicine National Research Council Committee to Reexamine I. O. M. Pregnancy Weight Guidelines. The National Academies Collection: Reports funded by National Institutes of Health. In: Rasmussen KM, Yaktine AL, editors. Weight Gain During Pregnancy: Reexamining the Guidelines. Washington (DC): National Academies Press (US) National Academy of Sciences; 2009. [Google Scholar]
- 16.Regnault N, Gillman MW, Rifas-Shiman SL, Eggleston E, Oken E. Sex-Specific Associations of Gestational Glucose Tolerance With Childhood Body Composition. Diabetes Care. 2013 doi: 10.2337/dc13-0333. [DOI] [PMC free article] [PubMed] [Google Scholar]
- 17.Kuczmarski RJ, Ogden CL, Guo SS, Grummer-Strawn LM, Flegal KM, Mei Z, et al. 2000 CDC Growth Charts for the United States: methods and development. Vital and health statistics. Series 11, Data from the national health survey. 2002;(246):1–190. [PubMed] [Google Scholar]
- 18.Ryals J, Lawton K, Stevens D, Milburn M Metabolon, Inc. Pharmacogenomics. 2007;8(7):863–866. doi: 10.2217/14622416.8.7.863. [DOI] [PubMed] [Google Scholar]
- 19.Oken E, Kleinman KP, Rich-Edwards J, Gillman MW. A nearly continuous measure of birth weight for gestational age using a United States national reference. BMC pediatrics. 2003;3:6. doi: 10.1186/1471-2431-3-6. [DOI] [PMC free article] [PubMed] [Google Scholar]
- 20.Christensen HN. Role of amino acid transport and counter transport in nutrition and metabolism. Physiol Rev. 1990;70(1):43–77. doi: 10.1152/physrev.1990.70.1.43. [DOI] [PubMed] [Google Scholar]
- 21.Bosch TA, Dengel DR, Kelly AS, Sinaiko AR, Moran A, Steinberger J. Visceral adipose tissue measured by DXA correlates with measurement by CT and is associated with cardiometabolic risk factors in children. Pediatr Obes. 2014 doi: 10.1111/ijpo.249. [DOI] [PMC free article] [PubMed] [Google Scholar]
- 22.Lackey DE, Lynch CJ, Olson KC, Mostaedi R, Ali M, Smith WH, et al. Regulation of adipose branched-chain amino acid catabolism enzyme expression and cross-adipose amino acid flux in human obesity. Am J Physiol. 2013;304(11):E1175–1187. doi: 10.1152/ajpendo.00630.2012. [DOI] [PMC free article] [PubMed] [Google Scholar]
- 23.Ridaura VK, Faith JJ, Rey FE, Cheng J, Duncan AE, Kau AL, et al. Gut microbiota from twins discordant for obesity modulate metabolism in mice. Science. 2013;341(6150):1241214. doi: 10.1126/science.1241214. [DOI] [PMC free article] [PubMed] [Google Scholar]
- 24.Sishi B, Loos B, Ellis B, Smith W, du Toit EF, Engelbrecht AM. Diet-induced obesity alters signalling pathways and induces atrophy and apoptosis in skeletal muscle in a prediabetic rat model. Exp Physiol. 2011;96(2):179–193. doi: 10.1113/expphysiol.2010.054189. [DOI] [PubMed] [Google Scholar]
- 25.Newgard CB. Interplay between lipids and branched-chain amino acids in development of insulin resistance. Cell Metab. 2012;15(5):606–614. doi: 10.1016/j.cmet.2012.01.024. [DOI] [PMC free article] [PubMed] [Google Scholar]
- 26.Shaham O, Wei R, Wang TJ, Ricciardi C, Lewis GD, Vasan R, et al. Metabolic profiling of the human response to a glucose challenge reveals distinct axes of insulin sensitivity. Mol Syst Biol. 2008;4:214. doi: 10.1038/msb.2008.50. [DOI] [PMC free article] [PubMed] [Google Scholar]
- 27.Fiehn O, Garvey WT, Newman JW, Lok KH, Hoppel CL, Adams SH. Plasma metabolomic profiles reflective of glucose homeostasis in non-diabetic and type 2 diabetic obese African-American women. PloS One. 2010;5(12):e15234. doi: 10.1371/journal.pone.0015234. [DOI] [PMC free article] [PubMed] [Google Scholar]
- 28.Adams SH. Emerging perspectives on essential amino acid metabolism in obesity and the insulin-resistant state. Adv Nutr. 2011;2(6):445–456. doi: 10.3945/an.111.000737. [DOI] [PMC free article] [PubMed] [Google Scholar]
- 29.Calabro P, Yeh ET. Obesity, inflammation, and vascular disease: the role of the adipose tissue as an endocrine organ. Subcell Biochem. 2007;42:63–91. [PubMed] [Google Scholar]
- 30.Kershaw EE, Flier JS. Adipose tissue as an endocrine organ. J Clin Endocrinol Metab. 2004;89(6):2548–2556. doi: 10.1210/jc.2004-0395. [DOI] [PubMed] [Google Scholar]
- 31.Roh C, Han J, Tzatsos A, Kandror KV. Nutrient-sensing mTOR-mediated pathway regulates leptin production in isolated rat adipocytes. Am J Physiol. 2003;284(2):E322–330. doi: 10.1152/ajpendo.00230.2002. [DOI] [PubMed] [Google Scholar]
- 32.Idkowiak J, Lavery GG, Dhir V, Barrett TG, Stewart PM, Krone N, et al. Premature adrenarche: novel lessons from early onset androgen excess. Eur J Endocrinol. 2011;165(2):189–207. doi: 10.1530/EJE-11-0223. [DOI] [PubMed] [Google Scholar]
- 33.Denburg MR, Silfen ME, Manibo AM, Chin D, Levine LS, Ferin M, et al. Insulin sensitivity and the insulin-like growth factor system in prepubertal boys with premature adrenarche. J Clin Endocrinol Metab. 2002;87(12):5604–5609. doi: 10.1210/jc.2002-020896. [DOI] [PubMed] [Google Scholar]
- 34.Gomez JM, Molina A, Fernandez-Castaner M, Casamitjana R, Martinez-Matos JA, Soler J. Insulin regulation of leptin synthesis and secretion in humans: the model of myotonic dystrophy. Clin Endocrinol. 1999;50(5):569–575. doi: 10.1046/j.1365-2265.1999.00675.x. [DOI] [PubMed] [Google Scholar]
- 35.Andreassen M, Frystyk J, Faber J, Kristensen LO. GH activity and markers of inflammation: a crossover study in healthy volunteers treated with GH and a GH receptor antagonist. Eur J Endocrinol. 2012;166(5):811–819. doi: 10.1530/EJE-11-1009. [DOI] [PubMed] [Google Scholar]
- 36.Ibanez L, Potau N, Chacon P, Pascual C, Carrascosa A. Hyperinsulinaemia, dyslipaemia and cardiovascular risk in girls with a history of premature pubarche. Diabetologia. 1998;41(9):1057–1063. doi: 10.1007/s001250051030. [DOI] [PubMed] [Google Scholar]
- 37.Ibanez L, Dimartino-Nardi J, Potau N, Saenger P. Premature adrenarche--normal variant or forerunner of adult disease? Endocrine Rev. 2000;21(6):671–696. doi: 10.1210/edrv.21.6.0416. [DOI] [PubMed] [Google Scholar]
- 38.Cox J, Williams S, Grove K, Lane RH, Aagaard-Tillery KM. A maternal high-fat diet is accompanied by alterations in the fetal primate metabolome. Am J Obstet Gynecol. 2009;201(3):281, e281–289. doi: 10.1016/j.ajog.2009.06.041. [DOI] [PMC free article] [PubMed] [Google Scholar]
Associated Data
This section collects any data citations, data availability statements, or supplementary materials included in this article.