Abstract
Many critical issues remain concerning how best to deploy adoptive regulatory T cell (Treg) immunotherapy to the clinic. These include a determination of their pharmacokinetic characteristics, their optimal dose, their phenotypic stability, and the best therapies with which to pair Tregs. By performing a CFSE-labeled autologous Treg pulse experiment, we determined that the accessible peripheral blood Treg pool in rhesus macaques is quite large (75±11 ×106 Tregs/kg). Pharmacokinetic analysis revealed that Tregs have two phases of elimination: an α phase, with a T1/2 in the peripheral blood of 32.4 +/− 11.3 hours and a β phase with a T1/2 of 120.4 +/− 19.7 hours. In addition to their short initial half-life, Tregs underwent rapid phenotypic shifts after infusion, with significant loss of both CD25 and FoxP3 by Day +6. While tacrolimus stabilized CD25 expression, it did not improve T1/2, nor mitigate the loss of FoxP3. In contrast, rapamycin significantly stabilized both CD25 and FoxP3, and supported an increased half-life, with an α phase of 67.7+/− 6.9 hours and a β phase of 252.1 +/− 54.9 hours. These results suggest that rapamycin may be a necessary addition to Treg immunotherapy, and that tacrolimus may be deleterious to Treg integrity post-transfer.
Introduction
While pharmacologic immune suppression is currently the most common strategy utilized to prolong allograft acceptance and prevent graft-versus-host disease (GvHD) after transplantation, cellular therapies are increasingly being studied, and are now beginning to be utilized in the clinic (1-6). One of the most prominent of these strategies is Treg adoptive immunotherapy (7-11).
Treg-directed therapies have now been used in clinical trials in hematopoietic cell transplantation (HCT) and diabetes (5, 6, 12), and low-dose IL-2 therapy of chronic GvHD patients has recently been shown to increase the endogenous Treg pool and to lead to improvement of disease severity (13). In solid organ transplantation, there are large trials planned for the addition of Tregs to standard immunosuppressive regimens in the hopes of improving both short- and long-term outcomes (http://www.onestudy.org/index.html). However, despite the efficacy of Tregs that has been demonstrated in mice (4, 14-17) and the significant interest in the rapid translation of this cellular therapy to the clinic, several critical issues remain unanswered about the optimal strategy for employing Tregs post-transplant. These include questions of the optimal Treg dose, the optimal frequency of Treg delivery, their phenotypic and functional stability after infusion, and their in vivo compatibility with other immunosuppressants. These studies are exceedingly difficult to perform in patients, and there are concerns that conclusions drawn from murine models won't adequately predict what will be observed in the clinic. To overcome these barriers, we have established a non-human primate (NHP) model of Treg adoptive therapy, and have previously shown that we can massively expand Tregs from rhesus macaques, and that these expanded cells maintain their phenotypic integrity and suppressive function after expansion. (18, 19) Here we report on the fate of autologous Tregs infused into rhesus macaques, and the impact that both calcineurin and mTOR inhibition make on their survival and phenotypic integrity.
Materials and Methods
Ethics Statement
This study used juvenile rhesus macaques that were housed at the Yerkes National Primate Research Center and complied with all USDA and IACUC regulations.
Isolation and ex-vivo expansion of Tregs
CD4+CD25++CD127−/low putative Tregs, aseptically flow-sorted from peripheral blood lymphocytes (PBL), were expanded using a modification of our previously described protocol (Figure 1) (18). Briefly, these cells were stimulated with anti-CD3/CD28-coated microbeads (Miltenyi Biotec, Auburn CA, bead: cell ratio of 1:2) on day 0 and cultured in X-Vivo-15 media supplemented as previously described (18), including 2000 IU/ml of rhIL-2. At days 12 and 24, (20) cultures were re-stimulated as on day 0. Treg cultures were pulsed with 100 nM of rapamycin for 48 hours from day 34-36, given our previous results showing that this optimized Treg suppressive activity. (18). Tregs were then harvested, washed free of rapamycin, magnetic beads removed, and cryopreserved as previously described. (18) The Treg phenotype was assessed by staining for CD3 (clone SP34-2, BD, San Jose, CA), CD4 (clone SK3, BD), CD25 (clone 4E3, Miltenyi Biotec), CD127 (clone eBioRDR5, eBioscience, San Diego, CA) and FoxP3 (clone PCH101, eBioscience) using the FoxP3 Fix/Perm Buffer Set (BioLegend, San Diego, CA). In some experiments, Tregs were also labeled with an anti-Ki-67 antibody (Clone B56, BD). Data were acquired on an LSR II flow cytometer and analyzed using FlowJo software (Treestar, Ashland, OR). Positively stained cells were identified using appropriate isotype-control antibodies.
Figure 1. Ex-vivo expansion of flow-sorted putative Tregs and the estimation of the accessible peripheral blood Treg pool in rhesus macaques.
A. Left panel: Treg expansion strategy: Flow-sorted putative Tregs were expanded with three rounds of stimulation with anti-CD3 and anti-CD28-antibody coated magnetic beads on day 0, 12 and 24 and cultured as previously described (18) before harvesting on day 36.
Middle panel: Expansion kinetics of ex-vivo cultured Tregs. Shown are the mean cell numbers (+/− SEM) for five Treg expansions (from 3 separate animals) that each occurred over a 36-day culture period.
Right panel: Phenotype of ex-vivo expanded Tregs: The phenotype of the expanded Tregs was analyzed by flow cytometry using an antibody panel consisting of anti-CD3, CD4, CD25, CD127 and FoxP3. Gated CD3+CD4+ cells were then analyzed for the expression of CD25, CD127 and FoxP3. A representative example from nine independent expansions derived from three animals is shown.
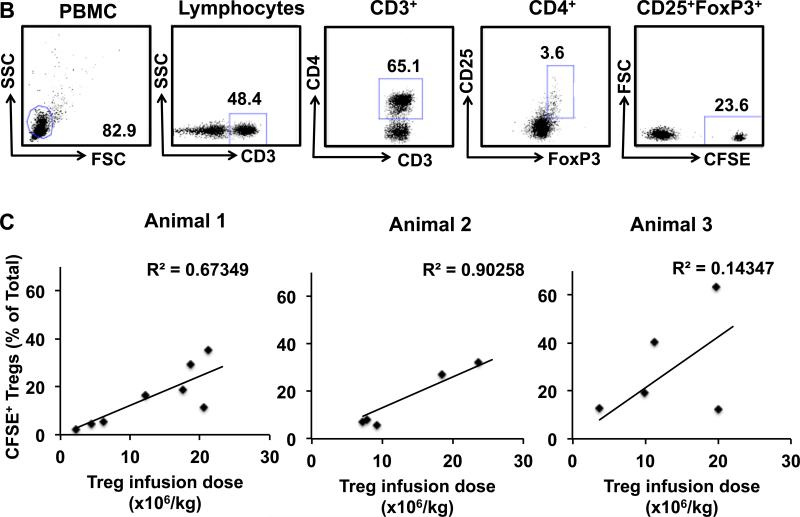
B-D Estimation of the accessible Treg pool in rhesus macaques.
B. Gating strategy for the detection of CFSE-labeled infused Tregs. Tregs were identified by gating on the CD3+CD4+CD25+FoxP3+ cells in the PBMC fraction. Infused Tregs were then separated from the endogenous Tregs based on their CFSE label.
C. Linear regression analysis showing progressively increasing Treg infusion doses and the resulting increasing percentage that infused CFSE+ Tregs made up of the total peripheral blood Tregs. Data from three individual animals is shown.
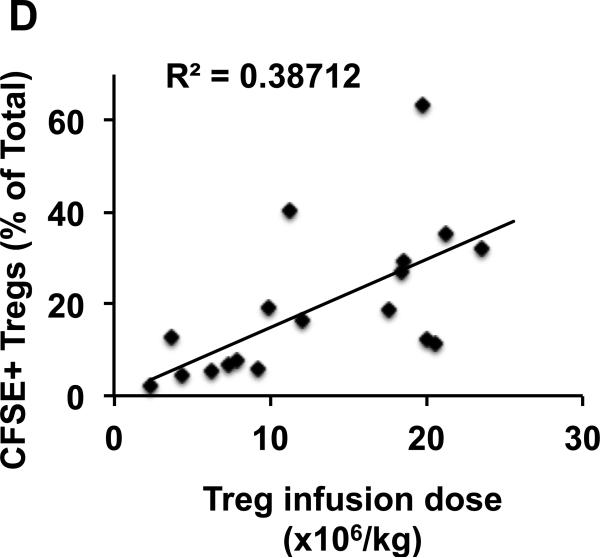
D. Combined data from three individual animals is shown with linear regression analysis of the entire data set.
Infusion of CFSE labeled Tregs and estimation of the endogenous accessible Treg pool
Cryopreserved Tregs were thawed and then labeled with 10μM of CFSE (Invitrogen, Grand Island, NY), washed free of excess CFSE and subsequently cultured at 37°C in a CO2 incubator in X-Vivo-15 media supplemented as previously described (18) for 24h prior to infusion into recipients. This 24 hour culture period allowed CFSE toxicity to be minimized, as previously described (21-23) and based on in vitro studies which demonstrated that CFSE-labeled cells harvested after 24 hours of culture were uniformly stable and viable (Supplementary Figure S1). Just prior to infusion, the CFSE-labeled cells were washed three times with normal saline (Baxter, Deerfield, IL) supplemented with 2% autologous serum, and passed through a 70 μm filter to prevent cell clustering. Their viability and cell number were determined by trypan-blue staining, and the cells were resuspended at 20×106 live cells/ml and immediately infused into autologous recipients at Treg doses ranging from 2.0×10⁶-24×106/kg.
To create the dose-response curve used to calculate the endogneous peripheral blood Treg pool, autologous CFSE+ Tregs were infused into 3 separate recipients (n = 5-8 doses of Tregs per animal with 18 total doses given) at a dose of 2×10⁶-24×106/kg. A “time 0 (T0)” flow cytometric measurement of the dilution of the CFSE+ Tregs into the total Treg pool was made within 60 minutes of this infusion. To enable testing of a wide-range of T0 doses, the total CFSE+ Treg infusion was split into two aliquots, such that a T0 measurement of 10% of the total infusion was first measured (within 30 minutes of that infusion) followed by infusion of the remaining 90% of the dose, with the T0 concentration of the entire infusion measured within 60 minutes.
The endogenous accessible peripheral blood Treg pool of the recipient was calculated from the dilution of CFSE+ Tregs into the total peripheral blood Treg pool using the following formula:
where x is the percentage of all CD3+CD4+CD25+FoxP3+ cells that were CFSE-labeled and n is the absolute number of CFSE+ Tregs infused. Thus, for the purpose of calculating the total Treg pool, the initial cell dose was normalized to the % CD25+FoxP3+ cells in each Treg batch.
Persistence and traffacking of CFSE-labeled Tregs infused into rhesus macaques
The persistence of intravenously infused CFSE-labeled Tregs in the blood and their trafficking to the bone marrow and LN was studied by determining the frequencies of CFSE+ Tregs in both the blood and tissues. Blood was collected everyday in the first week, every other day in the second week and twice a week thereafter. Bone marrow was collected on days 0, 2 and then once every week. The Day 0 bone marrow aspiration occurred within 60 minutes after the Treg infusion. When possible, LN samples were collected on Days 2 and 6 post-infusion. Four LN were accessible for excision (bilateral femoral and bilateral inguinal nodes).
For each of these tissues, cells were analyzed flow cytometrically and the % of total CD3+CD4+CD25+FoxP3+ Tregs that were CFSE+ was determined. The absolute numbers of these cells were calculated based on the CBC and differential counts (Sysmex XS-1000i, Kobe, Japan) obtained from each sample prior to flow cytometry. After each Treg infusion, the recipient was monitored longitudinally for the presence of CFSE+ cells until no further CFSE+ cells were detected. Once no CFSE was detected, an additional two week wash-out period was enforced prior to performing subsequent Treg infusions.
Pharmacokinetic analysis
The pharmacokinetic characteristics of the infused CFSE-labeled Tregs were determined using Phoenix® WinNonlin® PK software (Certara, Inc. St. Louis, MO) and applying the least squares method of non-linear regression. Statistical analysis of half-life differences for the three treatment groups (no treatment, tacrolimus and rapamycin) was calculated by ANOVA, with Tukey's post-hoc testing for paired comparisons (analysis performed using R, with p ≤ 0.05 considered statistically significant).
Immunosuppression
In some experiments recipient animals were treated with either rapamycin (to achieve a target trough level of 5-15 ng/ml) or tacrolimus (to achieve a target trough level of 8-12 ng/ml). Treatment with either agent was begun two weeks before the Treg infusion, and continued for the length of longitudinal analysis. At the end of each immunosuppresson trial, the drug (either rapamycin or tacrolimus) was discontinued and drug levels monitored until they were undetectable for two weeks. Once drug levels were undetectable for two weeks, a further two week wash-out was performed prior to subsequent Treg infusions.
Statistical analysis
For non-pharmacokinetic analyses, the data were analyzed by Student's t-test and/or by two way ANOVA. p values of ≤ 0.05 were considered statistically significant.
Results
Purity of ex-vivo expanded rhesus macaque CD4+CD25++ CD127−/low Tregs
As described in Methods and previously (18), rhesus macaque Tregs were purified by flow sorting of CD4+CD25++CD127−/low cells and were then expanded using anti-CD3/28 coated microbeads (Figure 1A, left panel). This strategy yielded Treg expansions of 1200-5900-fold within a 36-day culture period (Figure 1A, middle panel). The release criteria for these Treg expansion cultures included their being > 70% CD4+CD25++CD127−/lowFoxP3+ (Figure 1A, right panel), in addition to their being sterile, endotoxin free, and able to suppress an allogeneic MLR by > 2 fold at Treg: Teff ratio of 1:1 (data not shown). FoxP3-negative T cells that were present at the end of the 36-day culture period retained their CD25+/CD127- phenotype but were not counted as Tregs in this analysis, given the loss of FoxP3 expression.
Measuring the size of the accessible pool of Tregs in NHP
To determine the optimal dose of Tregs to use clinically, it is critical to define the size of the endogenous Treg pool. While a comprehensive calculation of the total-body Treg pool is not feasible, due to the inaccessibility of many of the organs to which Tregs traffic, the rhesus macaque model did allow us to measure the size of the peripheral blood Treg pool. To accomplish this goal, we performed a pulse experiment using CFSE-labeled Tregs infused into 3 individual recipients at doses ranging from 2.0×10⁶-24×106/kg. The dilution of the CFSE-labeled Tregs into the total Treg pool was determined by drawing blood in the first hour after infusion and determining the percentage of the total CD3+CD4+CD25+FoxP3+Treg pool that was CFSE+ (Figure 1B). These data were used to calculate the size of the total peripheral blood Treg compartment, as described in Methods. As shown in Figure 1C, each of 3 individual macaques received between 5-8 Treg infusions with a total of 18 measurements made using escalating doses of CFSE-labeled Tregs (Figure 1C-D). As shown in Figure 1C-D, these escalating doses constituted 2.3-63.2% of the total peripheral Treg pool. The size of the peripheral blood Treg pool for each individual animal was calculated, and a composite pool size determined using the combined data. As shown in Figure 1C, the endogenous Treg pool in the three experimental animals was 47±24 ×106, 85±14 ×106 and 87±18 ×106 Tregs/kg. Combining the data from all three animals (Figure 1D) yielded a peripheral blood Treg pool size of 75±11 ×106 Tregs/kg.
Biphasic elimination of infused Tregs from peripheral blood
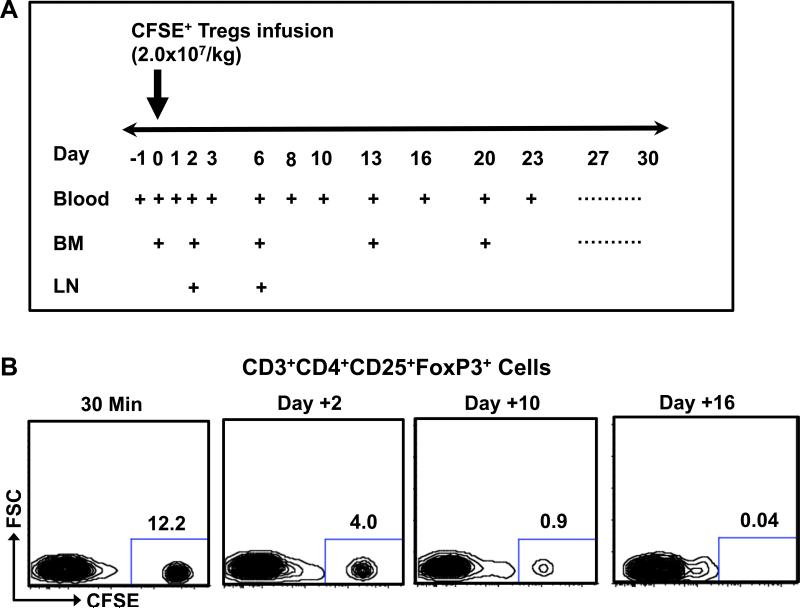
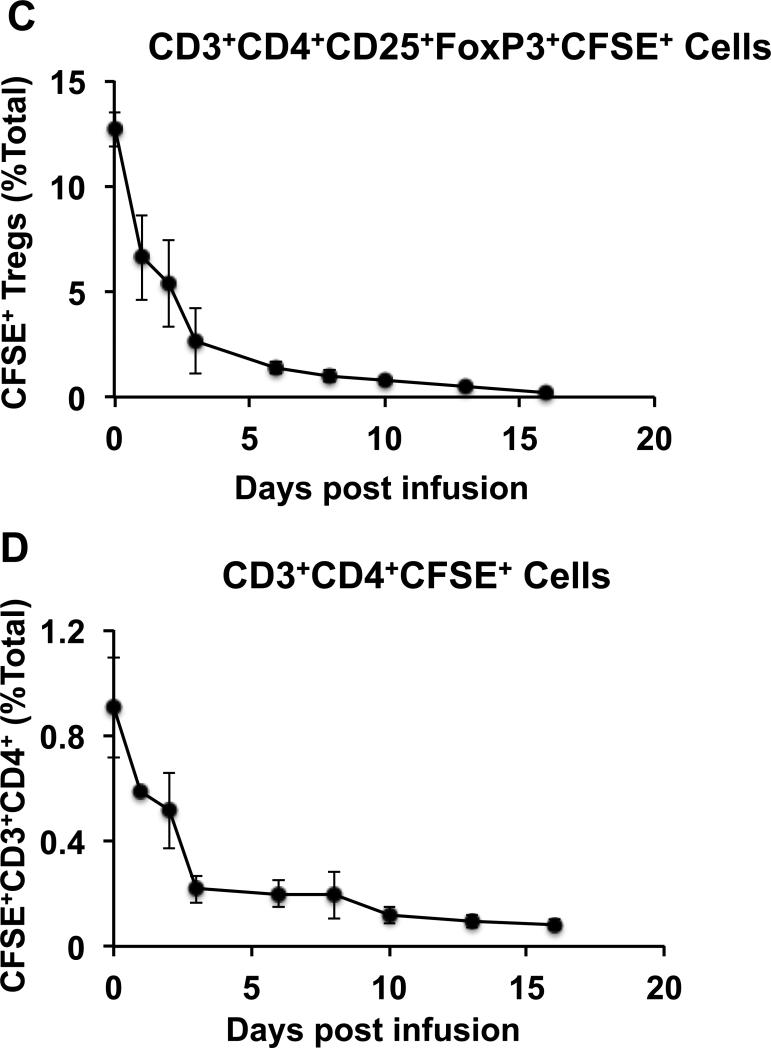
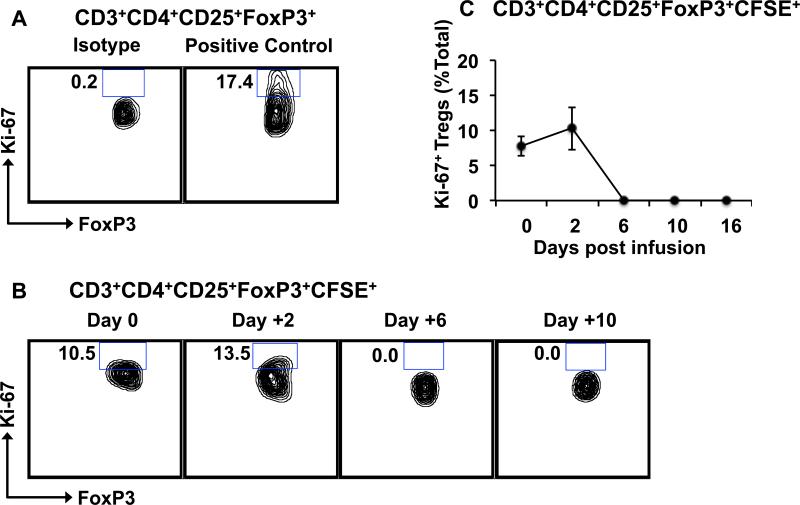
To determine the half-life of Tregs infused into rhesus macaques, blood was analyzed for the persistence of the CFSE-labeled Tregs (Figure 2A). As shown in Figure 2B-C, the majority of the infused Tregs disappeared rapidly from the peripheral circulation after infusion, with very few detectable CFSE+ Tregs left in blood after Day +16. Pharmacokinetic analysis detected two phases of elimination: an initial α phase of distribution (between Day 0 and Day 3), with a T1/2 of 32.4 +/− 11.3 hours, and a terminal β phase of elimination (from Day 6 onward) with a T1/2 of 120.4 +/− 19.7 hours. This pharmacokinetic profile is similar to what has previously been reported for adoptive therapy with both Tregs and Chimeric Antigen Receptor T cells in humans (5, 24, 25). Importantly, a similar pattern of disappearance was observed for both the CD3+CD4+CD25+FoxP3+ cells (Figure 2C) and for the total infused CD3+CD4+ innoculum (Figure 2D), suggesting that the Treg half-life was not due only to phenotypic shifts in these cells after infusion, but represented a bone fide disappearance of the adoptively transferred cells from the peripheral blood. Persisting infused Tregs did not demonstrate a typical CFSE dilution profile indicative of proliferation (Figure 2B) and the percentages of Ki-67+ cells in the persisting Tregs did not increase after adoptive transfer (Figure 3) suggesting that the disappearance of the infused CFSE-labeled cells was not due to proliferation.
Figure 2. Elimination kinetics of ex vivo expanded CFSE-labeled Tregs from the peripheral blood after intravenous infusion.
A. Strategy for blood draws, bone marrow aspirates and LN biopsies after Treg infusion.
B. Representative flow cytometric analysis of CD3+CD4+CD25+FoxP3+ cells after infusion. Infused Tregs were separated from the endogenous Treg pool based on their CFSE label.
C. Percentage of CFSE+ Tregs in the CD3+CD4+CD25+FoxP3+ pool over a 16-day period after infusion. Data is shown as the mean ± SEM from three different animals.
D. Percentage of CFSE+ CD3+CD4+ cells in the CD3+CD4+ pool over a 16-day period after infusion. Data is shown as the mean ± SEM from three different animals.
Figure 3. Infused CFSE-labeled Tregs do not proliferate after adoptive transfer.
Tregs in the peripheral blood were identified flow cytometrically by CD3, CD4, CD25 and FoxP3, and were then analyzed for FoxP3 and Ki-67 expression.
A. Representative contour plots showing positive-control Ki-67 staining of proliferating NHP Tregs.
B. Representative contour plots showing the frequencies of Ki-67+FoxP3+ cells in the infused CD3+CD4+CD25+FoxP3+CFSE+ population over time.
C. Summary data showing frequencies of Ki-67+ Tregs in the CD3+CD4+CD25+FoxP3+CFSE+ population over time. Data is shown as the mean ± SEM of three independent experiments.
Migration of infused Tregs to bone marrow and LN
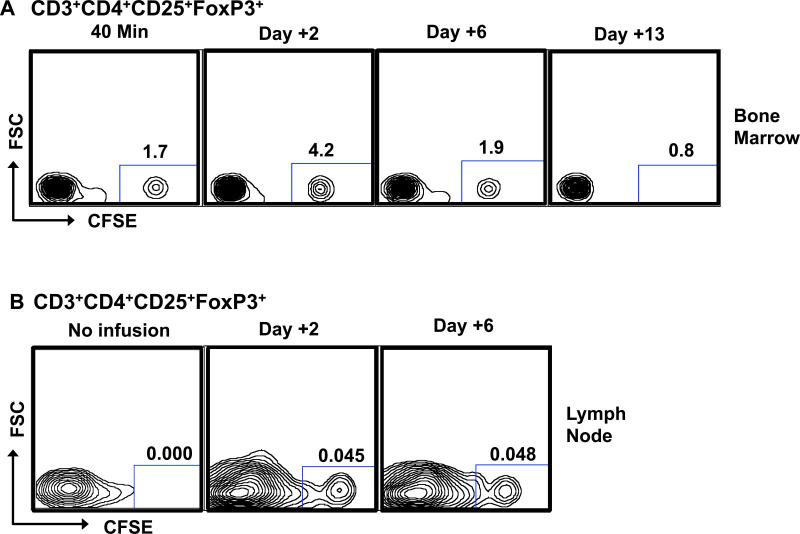
The rapid α phase of elimination of the infused Tregs from the peripheral circulation prompted us to investigate whether these cells migrated to other anatomic sites after infusion. In rhesus macaques, both the bone marrow and LN are readily accessible sites for monitoring. As shown in Figure 4, our analysis indicated that CFSE+CD3+CD4+CD25+CD127−/lowFoxP3+ cells did migrate to both of these tissues after adoptive transfer. However, as also demonstrated in this Figure, for both the bone marrow and LN, the disappearance of the infused Tregs followed a similar pattern as in blood, suggesting that the α distribution phase of Tregs from the blood was not due to their preferential accumulation in either of these two sites.
Figure 4. Infused Tregs migrate to bone marrow and LN.
Isolated bone marrow (A) and LN (B) cells were stained for CD3, CD4, CD25, and FoxP3. CFSE fluorescence was determined on CD3+CD4+CD25+FoxP3+ cells. Representative data from three independent experiments is shown.
Loss of phenotypic integrity of Tregs after infusion
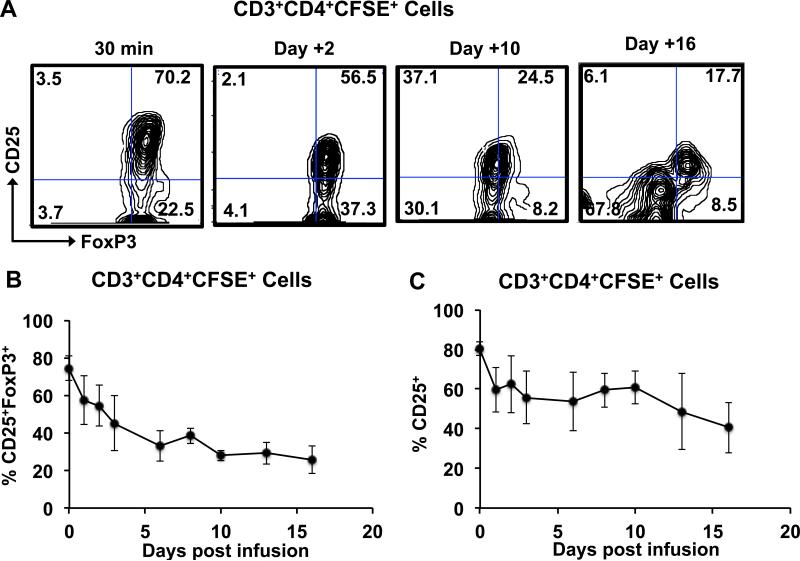
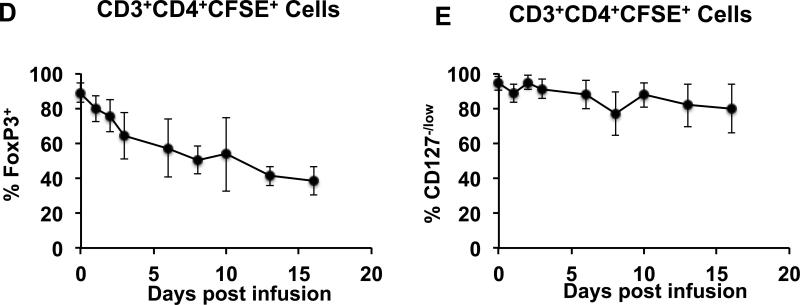
To address the critical issue of the phenotypic stability of adoptively transferred Tregs, we performed the following analysis: Persisting CD3+CD4+CFSE+ cells post-infusion were analyzed for their expression of CD25, CD127 and FoxP3, and cells expressing both CD25 and FoxP3 were counted as phenotypically intact Tregs. The CD3+CD4+CFSE+ cells were also analyzed for CD127 expression, given the importance of this marker in the phenotypic definition of Tregs. As shown in Figures 5A-B although on Day 0, the vast majority of the infused CFSE+ CD4 cells were CD25+FoxP3+ and CD127−/low, the phenotype of the CFSE+ cells changed rapidly post-infusion. The persisting CFSE+ cells started losing both CD25 and FoxP3 expression by Day +1 post-infusion and by day 16, only <30 % of the persisting CFSE+CD4 cells were CD25+FoxP3+ (Figures 5A-B). Of note, the CD127−/low phenotype was more stable then either the CD25+ or FoxP3+ phenotypes. Thus, while <40% of the persisting CD3+CD4+ CFSE+ cells were CD25+ or FoxP3+ on day 16, >70% of these cells still retained the CD127−/low phenotype (Figures 5C-E).
Figure 5. Loss of phenotypic integrity of infused Tregs after adoptive transfer.
Persisting infused cells in the peripheral circulation were identified by CD3, CD4 and CFSE positivity and were then analyzed for the expression of CD25, FoxP3 and CD127.
A. Representative flow cytometric analysis of FoxP3 and CD25 expression in CD3+CD4+ CFSE+ cells over time.
B. Combined longitudinal analysis of CD25+FoxP3+ cells in the total CD3+CD4+CFSE+ population (mean ± SEM of three independent experiments).
C. Combined longitudinal analysis of CD25+ cells in the total CD3+CD4+CFSE+ population (mean ± SEM of three independent experiments).
D. Combined longitudinal analysis of FoxP3+ cells in the total CD3+CD4+CFSE+ population (mean ± SEM of three independent experiments).
E. Combined longitudinal analysis of CD127−/low cells in the total CD3+CD4+CFSE+ population (mean ± SEM of three independent experiments).
Rapamycin enhances the persistence and phenotypic stability of adoptively transferred Tregs
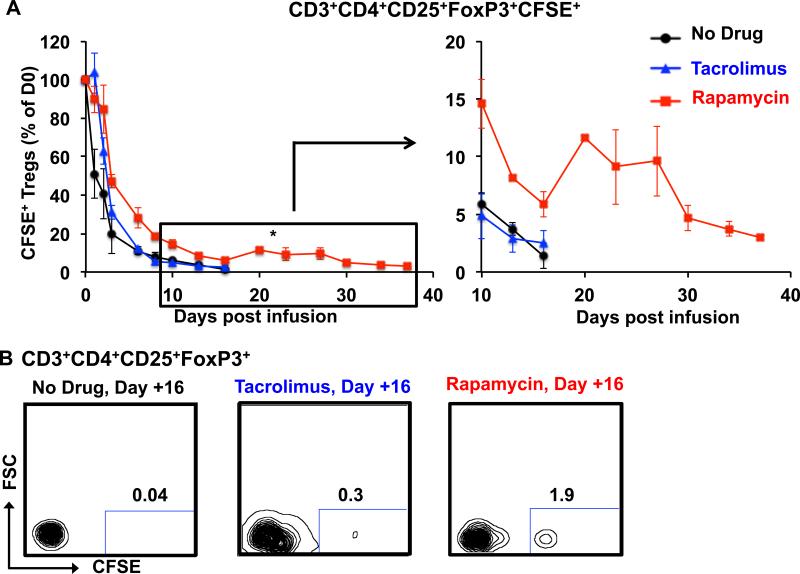
To determine the impact of immunosuppression on the stability of adoptively transferred Tregs, animals who had previously received Tregs in the absence of any immunosuppression received additional Treg infusions in the presence of therapeutic levels of either tacrolimus or rapamycin. As shown in figures 6A-B, the, infused Tregs rapidly disappeared from the peripheral circulation in animals treated with tacrolimus, with both α and β phases of elimination not statistically different from control infusions (α T1/2 = 47.4 +/− 4.3 hours, β T1/2 =165.2 +/−9.5 hours, p = 0.44 and 0.57 compared to control, respectively). In contrast, when these same recipients were treated with rapamycin, both α and β phases of elimination were significantly lengthened (α T1/2 = 67.7 +/− 6.9 hours, β T1/2 =252.1 +/−54.9 hours, p = 0.04 and 0.05 compared to control, respectively). As can be noted in Figure 6A, the impact of rapamycin on Treg persistence was most apparent at later time-points after transfer. Thus, recipients treated with rapamycin still had measurable CFSE-labeled Tregs in the peripheral blood as late as Day +37 post-infusion, whereas the same recipients treated with either no immunosuppression or tacrolimus had undetectable Tregs more than 21 days earlier.
Figure 6. Rapamycin enhances the persistence and phenotypic integrity of infused Tregs after adoptive transfer.
Rhesus macaques were given either no drug (black circles), tacrolimus (blue triangles) or rapamycin (red squares) in the setting of Treg adoptive transfer. Drug levels were targeted to achieve a trough of 5-15 ng/ml for rapamycin and 8-12 ng/ml for tacrolimus. CFSE+ Tregs were infused intravenously and tracked longitudinally in blood by flow cytometric analysis of CD3, CD4, CD25, FoxP3 and CFSE expression.
A. Percentage of persisting CFSE+ Tregs in the three treatment groups over the follow-up period, with Day 0 samples shown as 100%. Black circles: Tregs infused without concomitant immunosuppression. Blue triangles: Tregs infused into animals treated with tacrolimus. Red squares: Tregs infused into animals treated with rapamycin. Shown are the mean ± SEM for each time-point (n = 3 independent animals for each treatment type). An enlarged version of the data from day +10 to day +37 is shown to the right. * represents p ≤ 0.05
B. Representative flow cytometric analysis on Day +16 is shown for animals receiving no drug, tacrolimus or rapamycin.
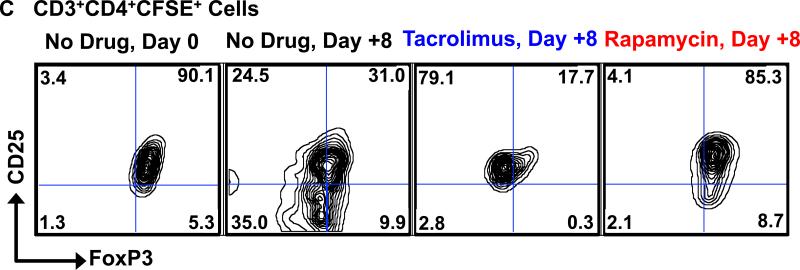
C-G. Rapamycin rescues the loss of phenotypic integrity of infused Tregs after adoptive transfer.
C. Representative flow cytometric analysis on Day +8 is shown for animals on no drug, tacrolimus and rapamycin (right three panels) compared to the flow cytometric analysis of the infused cells on Day 0 (30 minutes after infusion, far left panel).
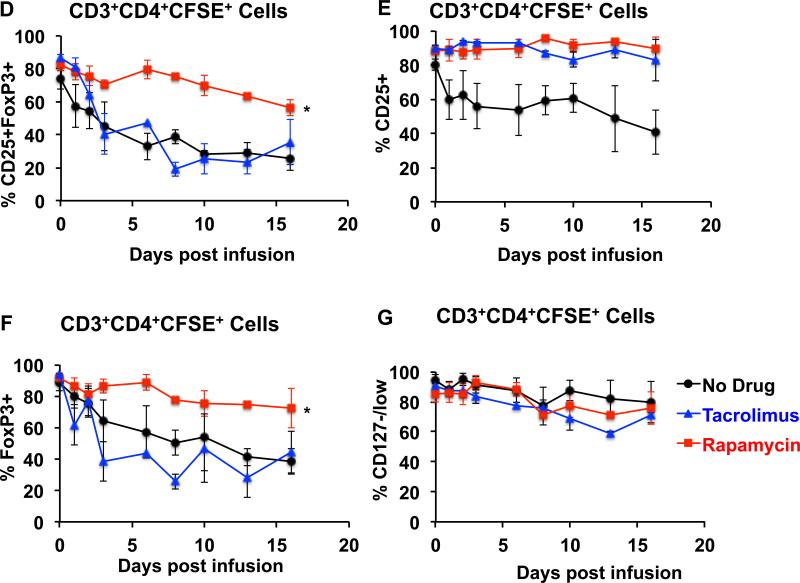
D. Comparison of the combined longitudinal analysis of CD25+FoxP3+ cells in the total CD3+CD4+CFSE+ population between animals treated with no immunosuppression, with tacrolimus, or with rapamycin. Shown is the mean ± SEM of three independent experiments for each treatment regimen. * represents p ≤ 0.05.
E. Comparison of the combined longitudinal analysis of CD25+ cells in the total CD3+CD4+CFSE+ population between animals treated with no immunosuppression, with tacrolimus, or with rapamycin. Shown is the mean ± SEM of three independent experiments for each treatment regimen.
F. Comparison of the combined longitudinal analysis of FoxP3+ cells in the total CD3+CD4+CFSE+ population between animals treated with no immunosuppression, with tacrolimus, or with rapamycin. Shown is the mean ± SEM of three independent experiments for each treatment regimen. * represents p ≤ 0.05.
G. Comparison of the combined longitudinal analysis of CD127−/low cells in the total CD3+CD4+CFSE+ population between animals treated with no immunosuppression, with tacrolimus, or with rapamycin. Shown is the mean ± SEM of three independent experiments for each treatment regimen.
We next studied the effect of both tacrolimus and rapamycin on the phenotypic stability of the infused Tregs. For this purpose we compared the frequencies of CD25+FoxP3+ cells in the persisting CD3+CD4+CFSE+ cells in recipients that were untreated, or, in animals who received Tregs in the presence of either tacrolimus or rapamycin. As shown in figures 6C and 6D, compared to either no treatment, or to tacrolimus, rapamycin was associated with significant preservation of the phenotype of the infused Tregs in the peripheral blood.
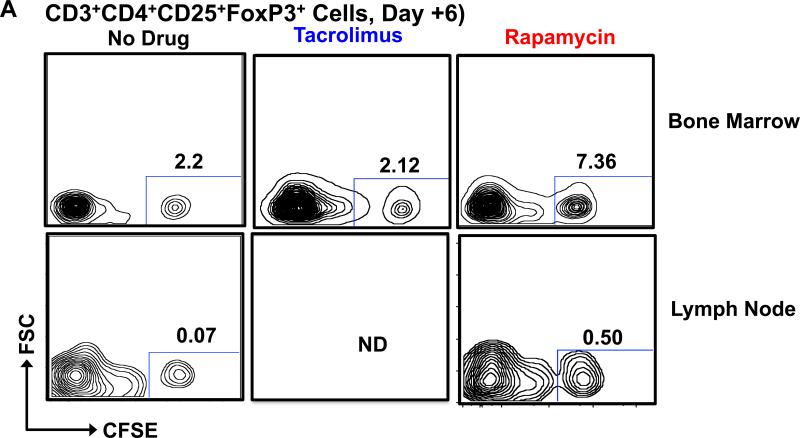
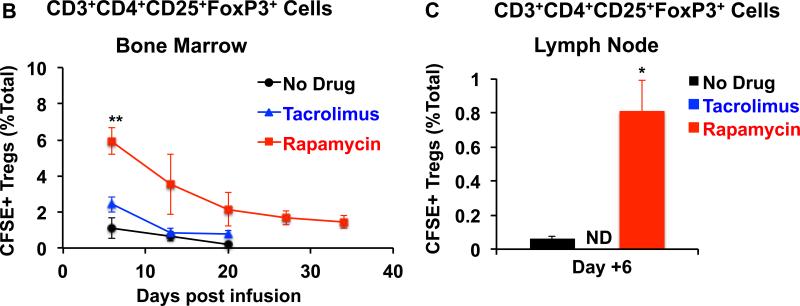
Of note, distinct phenotypic shifts occurred in recipients receiving Tregs in the presence of no immunosuppression and those treated with tacrolimus. Thus, when recipients received no immunosuppression, the infused Tregs rapidly lost expression of both FoxP3 and CD25. Tacrolimus treatment was able to preserve CD25 expression but not FoxP3 expression (Figures 6E-6F). In contrast, when these same recipients were given rapamycin, both FoxP3 and CD25 expression was better preserved (Figure 6C-F). Neither rapamycin nor tacrolimus had a significant effect on CD127 expression in the adoptively transferred cells (Figure 6G). Concomitant with the observations in blood, recipients treated with rapamycin also demonstrated higher frequencies of CFSE-labeled CD3+CD4+CD25+FoxP3+ Tregs in the bone marrow and LN compared to the other treatment groups (Figure 7A-C).
Figure 7. Increased frequencies of infused CFSE Tregs in bone marrow and LN in animals treated with rapamycin.
After transfer, infused CFSE + Tregs were quantified in the bone marrow and LN Treg pools (by determining the percentage of CFSE+ Tregs from the total CD3+CD4+CD25+FoxP3+ Treg pool) in animals treated with either no immunosuppression (bone marrow and LN), tacrolimus (only bone marrow) or rapamycin (bone marrow and LN). A. Representative flow cytometric analysis on Day + 6 for bone marrow and LN is shown. B. Longitudinal summary analysis for the bone marrow from animals receiving no adjunctive immunosuppression (black circles), tacrolimus (blue triangles), or rapamycin (red squares). Shown is the mean ± SEM (n = 3). ** represents p ≤ 0.01.
C. LN analysis on Day +6 after Treg transfer is shown for animals receiving no adjunctive immunosuppression (black) or rapamycin (red). Note: For technical reasons, the LN could not be excised in animals receiving tacrolimus. Shown is the mean ± SEM (n = 3). * represents p ≤ 0.05.
Discussion
While there are many ongoing and planned studies of Tregs for both HCT and solid organ transplantation, this work continues to confront several important unknowns concerning Treg biology. These unknowns could represent serious barriers to the widespread clinical translation of Treg-based therapies, and substantially increase the risk of failure of these expensive and complicated trials. NHP models represent a unique opportunity to address these issues: NHP studies can ‘add value’ to clinical adoptive cellular therapy studies, since they permit more frequent tissue sampling as well as longitudinal analysis of the peripheral blood, and the ability to test multiple treatment regimens in a single recipient.
The first question addressed in the current study was the size of the primate Treg pool, accessible in the peripheral blood. To our knowledge, this represents the first dose-response curve of infused Tregs in either a non-human or human primate system. Using a pulse with CFSE-labeled Tregs, we have calculated the accessible pool to be 76±10 ×106 Tregs/kg. If predictive of the size of the human Treg compartment, this calculation suggests that previous Treg dosing regimens (which have infused~2-3×10⁶ Tregs/kg) may have only minimally perturbed native Treg numbers.
The second issue that was addressed in this study was the survival of Tregs after infusion. As shown in Figure 2, we observed a biphasic elimination pattern of the infused CFSE-labeled Tregs, with a rapid α elimination phase and a more prolonged β phase. Our results are very similar to the single previous study in patients, in which Tregs were tracked, where possible, with donor-specific MHC-specific antibodies. (5) Although the pharmacokinetic data in the clinical trial was not sufficiently granular to deconvolute multiple phases of elimination, the tracked Tregs did appear to have a short half-life, and were not observable in the peripheral blood after 14 days post-infusion. The cause of the short α distribution phase of the infused Tregs in both NHP and patients remains unknown. Our data provides evidence that these cells do traffic out of the peripheral blood, into both the bone marrow and LN, but that they eventually disappear from these sites as well. Thus, although trafficking to target organs may account for some of the initial distribution phase, the extent to which the α distribution may be caused by other mechanisms, including cell death or immune-mediated clearance, could represent a major hurdle for the field of adoptive cellular therapy, where function is often tied to persistence of significant numbers of cells after transfer. Importantly, both Ki-67 staining and the CFSE dilution profile of the infused Tregs did not demonstrate any post-transfer proliferation, consistent with the loss of Tregs deriving from their death in the absence of in vivo expansion signals. Future studies using permanently gene-marked Tregs will allow a definitive study of Treg proliferation after transfer.
The mechanisms controlling post-transfer Treg expansion and survival in nonlymphopenic recipients still remain to be determined, and it is a possibility that the relative IL-2 withdrawal that transferred Tregs may face when removed from culture may inhibit both proliferation and survival programs. The presence of an in vivo auto- or allo-antigen, or the expansion of Tregs in the presence of these antigens may, therefore, improve Treg survival, and this is amenable for testing in future NHP studies. In addition, alternative culture conditions, including shorter culture times, fewer stimulations, or non-cryopreserved Tregs could all impact Treg survival and stability after transfer, and deserve testing in future studies.
The final issues that we addressed were the linked questions of the phenotypic stability of Tregs after transfer, and strategies by which to optimize the stability of their phenotype (and presumably) their suppressive function. One of the most striking observations that we made in this study was the rapid loss of both CD25 and FoxP3 expression in adoptively transferred primate Tregs, which occurred within 6 days after their transfer. Infusion of these cells in the presence of tacrolimus was able to stabilize their expression of CD25 (likely due to the salutary impact of NFAT inhibition on CD25 expression (26, 27), but did not prevent the loss of FoxP3 expression in the transferred cells. Thus, recipients treated with tacrolimus displayed a similar loss of phenotypically-intact Tregs as when the cells were infused without any immunosuppression, suggesting, as has been observed in mice (17, 28) that tacrolimus is not an effective adjunctive immunosuppressive agent with which to pair these cells. While this loss of Treg phenotype implies that the transferred cells would have also lost their suppressive function, it is important to note that we were not able to test this directly in the present study: the numbers of CFSE-labeled cells persisting in recipients were too low to successfully re-purify them after infusion. This re-purification would be necessary in order to test their suppressive function in an in vitro proliferation assay.
In contrast to what we observed with tacrolimus, when Tregs were infused in recipients treated with rapamycin, the phenotypic integrity of the infused cells was significantly stabilized, with the majority of the infused cells retaining their CD25+/FoxP3+ phenotype up to 23 days post-infusion. Rapamycin has been previously shown to stabilize FoxP3 expression (through histone H3 methylation as well as other pathways (29, 30)), suggesting that these mechanisms may have contributed to the impact of rapamycin observed in the present study. Rapamycin also increased the duration of survival of the Tregs, increasing both their α distribution phase and terminal β elimination half-life. The mechanism for this increased survival has not yet been determined. However, previous studies have suggested that rapamycin can inhibit Treg apoptosis:(31) control of this pathway may have contributed to the improved T1/2 that we observed. Given the many previous studies showing that rapamycin can preserve or enhance Treg function, (18, 32-35) our results strongly suggest that strategies including Treg adoptive therapy should employ adjunctive treatment with rapamycin, to both prolong Treg survival and safeguard Treg phenotype.
While rapamycin was clearly superior to either no adjunctive immunosuppression or treatment with tacrolimus, it is important to note that our results show that considerable work remains to be done to establish an optimal Treg therapeutic regimen, and that key changes may be needed in order to manufacture an optimal Treg product. These may include the identification of a Treg sub-fraction that, once expanded ex vivo, optimally maintains survival and proliferation signals in vivo, and may also include the addition of cytokine therapy to promote Treg proliferation and survival. In addition, extended Treg phenotyping, including monitoring of tissue homing integrins and chemokines, as well as markers of T cell effector function and terminal differentiation, may identify immunosuppressive regimens that optimally preserve the suppressive function and trafficking capacity of the infused cells.
Our results suggest that there is a subpopulation of adoptively-transferred Tregs at high risk for early distribution (and elimination) and a second subpopulation with a significantly longer half-life. The genetic (or epigenetic) factors that distinguish these two populations are not yet known. This represents an important area for future investigation, as the efficacy of Treg adoptive therapy will likely be linked to both their longevity and their phenotypic stability after transfer.
Supplementary Material
Figure S1: No significant toxic effect of CFSE on in vitro cultured Tregs after 24 hours of CFSE staining. Tregs were labeled with CFSE and cultured at 37°C in a CO2 incubator in XVivo-15 media supplemented as previously described. Representative samples were collected and analyzed for number of live cells at 2, 3, and 6 days after the start of the culture and normalized to the cell numbers present at 24 hours. Shown is the mean ± SEM (n = 3).
Acknowledgments
We gratefully acknowledge the technical support provided by members of Dr. Kean's laboratory and the expert veterinary support provided by the staff at Yerkes National Primate Research Center, Atlanta, GA.
This work was supported by Yerkes National Primate Research Center Base Grant, #RR00165. CPL was supported by NIH grant #s 2U19 AI051731, and 2P01 AI044644. LSK was supported by NIH grant #s 2U19 AI051731, 1R01 HL095791 and by a Burroughs Wellcome Fund Career Award. ADK was supported by JDRF 1-2008-594, NIH grant #s 1U01AI079223-01A1, 5 U19 AI051731. BRB was supported by NIH grant #s R01 AI34495, HL 56067, P01 CA 067493 AI 056299 and a grant from the Leukemia and Lymphoma Society of America.
Abbreviations
- BMT
bone marrow transplant
- GvHD
graft-versus-host disease
- MLR
mixed lymphocyte reaction
- NHP
non-human primate
- Tregs
regulatory T cells
Footnotes
Disclosure: The authors of this manuscript have no conflicts of interest to disclose as described by the American Journal of Transplantation.
Supporting information
Additional Supporting Information may be found in the online version of this article.
References
- 1.Steiner D, Brunicki N, Bachar-Lustig E, Taylor PA, Blazar BR, Reisner Y. Overcoming T cell-mediated rejection of bone marrow allografts by T-regulatory cells: synergism with veto cells and rapamycin. Exp Hematol. 2006;34(6):802–8. doi: 10.1016/j.exphem.2006.02.017. [DOI] [PubMed] [Google Scholar]
- 2.Rodriguez-Garcia M, Boros P, Bromberg JS, Ochando JC. Immunotherapy with myeloid cells for tolerance induction. Curr Opin Organ Transplant. 2010;15(4):416–21. doi: 10.1097/MOT.0b013e32833bcf5e. [DOI] [PMC free article] [PubMed] [Google Scholar]
- 3.Ge W, Jiang J, Arp J, Liu W, Garcia B, Wang H. Regulatory T-cell generation and kidney allograft tolerance induced by mesenchymal stem cells associated with indoleamine 2,3-dioxygenase expression. Transplantation. 2010;90(12):1312–20. doi: 10.1097/TP.0b013e3181fed001. [DOI] [PubMed] [Google Scholar]
- 4.Issa F, Hester J, Goto R, Nadig SN, Goodacre TE, Wood K. Ex vivo-expanded human regulatory T cells prevent the rejection of skin allografts in a humanized mouse model. Transplantation. 2010;90(12):1321–7. doi: 10.1097/TP.0b013e3181ff8772. [DOI] [PMC free article] [PubMed] [Google Scholar]
- 5.Brunstein CG, Miller JS, Cao Q, McKenna DH, Hippen KL, Curtsinger J, et al. Infusion of ex vivo expanded T regulatory cells in adults transplanted with umbilical cord blood: safety profile and detection kinetics. Blood. 2011;117(3):1061–70. doi: 10.1182/blood-2010-07-293795. [DOI] [PMC free article] [PubMed] [Google Scholar]
- 6.Di Ianni M, Falzetti F, Carotti A, Terenzi A, Castellino F, Bonifacio E, et al. Tregs prevent GVHD and promote immune reconstitution in HLA-haploidentical transplantation. Blood. 2011;117(14):3921–8. doi: 10.1182/blood-2010-10-311894. [DOI] [PubMed] [Google Scholar]
- 7.Sakaguchi S, Miyara M, Costantino CM, Hafler DA. FOXP3+ regulatory T cells in the human immune system. Nat Rev Immunol. 2010;10(7):490–500. doi: 10.1038/nri2785. [DOI] [PubMed] [Google Scholar]
- 8.Sakaguchi S, Wing K, Onishi Y, Prieto-Martin P, Yamaguchi T. Regulatory T cells: how do they suppress immune responses? Int Immunol. 2009;21(10):1105–11. doi: 10.1093/intimm/dxp095. [DOI] [PubMed] [Google Scholar]
- 9.Bennett CL, Christie J, Ramsdell F, Brunkow ME, Ferguson PJ, Whitesell L, et al. The immune dysregulation, polyendocrinopathy, enteropathy, X-linked syndrome (IPEX) is caused by mutations of FOXP3. Nature genetics. 2001;27(1):20–1. doi: 10.1038/83713. [DOI] [PubMed] [Google Scholar]
- 10.Ding Y, Xu J, Bromberg JS. Regulatory T cell migration during an immune response. Trends Immunol. 2012;33(4):174–80. doi: 10.1016/j.it.2012.01.002. [DOI] [PMC free article] [PubMed] [Google Scholar]
- 11.Itoh M, Takahashi T, Sakaguchi N, Kuniyasu Y, Shimizu J, Otsuka F, et al. Thymus and autoimmunity: production of CD25+CD4+ naturally anergic and suppressive T cells as a key function of the thymus in maintaining immunologic self-tolerance. J Immunol. 1999;162(9):5317–26. [PubMed] [Google Scholar]
- 12.Marek-Trzonkowska N, Mysliwiec M, Dobyszuk A, Grabowska M, Techmanska I, Juscinska J, et al. Administration of CD4+CD25highCD127- regulatory T cells preserves beta-cell function in type 1 diabetes in children. Diabetes care. 2012;35(9):1817–20. doi: 10.2337/dc12-0038. [DOI] [PMC free article] [PubMed] [Google Scholar]
- 13.Matsuoka K, Koreth J, Kim HT, Bascug G, McDonough S, Kawano Y, et al. Low-dose interleukin-2 therapy restores regulatory T cell homeostasis in patients with chronic graft-versus-host disease. Sci Transl Med. 2013;5(179):179ra43. doi: 10.1126/scitranslmed.3005265. [DOI] [PMC free article] [PubMed] [Google Scholar]
- 14.Taylor PA, Lees CJ, Blazar BR. The infusion of ex vivo activated and expanded CD4(+)CD25(+) immune regulatory cells inhibits graft-versus-host disease lethality. Blood. 2002;99(10):3493–9. doi: 10.1182/blood.v99.10.3493. [DOI] [PubMed] [Google Scholar]
- 15.Hoffmann P, Ermann J, Edinger M, Fathman CG, Strober S. Donor-type CD4(+)CD25(+) regulatory T cells suppress lethal acute graft-versus-host disease after allogeneic bone marrow transplantation. J Exp Med. 2002;196(3):389–99. doi: 10.1084/jem.20020399. [DOI] [PMC free article] [PubMed] [Google Scholar]
- 16.Edinger M, Hoffmann P, Ermann J, Drago K, Fathman CG, Strober S, et al. CD4+CD25+ regulatory T cells preserve graft-versus-tumor activity while inhibiting graft-versus-host disease after bone marrow transplantation. Nat Med. 2003;9(9):1144–50. doi: 10.1038/nm915. [DOI] [PubMed] [Google Scholar]
- 17.Nguyen VH, Zeiser R, Dasilva DL, Chang DS, Beilhack A, Contag CH, et al. In vivo dynamics of regulatory T-cell trafficking and survival predict effective strategies to control graft-versus-host disease following allogeneic transplantation. Blood. 2007;109(6):2649–56. doi: 10.1182/blood-2006-08-044529. [DOI] [PubMed] [Google Scholar]
- 18.Singh K, Kozyr N, Stempora L, Kirk AD, Larsen CP, Blazar BR, et al. Regulatory T cells exhibit decreased proliferation but enhanced suppression after pulsing with sirolimus. Am J Transplant. 2012;12(6):1441–57. doi: 10.1111/j.1600-6143.2011.03963.x. [DOI] [PMC free article] [PubMed] [Google Scholar]
- 19.Anderson A, Martens CL, Hendrix R, Stempora LL, Miller WP, Hamby K, et al. Expanded nonhuman primate tregs exhibit a unique gene expression signature and potently downregulate alloimmune responses. American journal of transplantation : official journal of the American Society of Transplantation and the American Society of Transplant Surgeons. 2008;8(11):2252–64. doi: 10.1111/j.1600-6143.2008.02376.x. [DOI] [PMC free article] [PubMed] [Google Scholar]
- 20.Hippen KL, Merkel SC, Schirm DK, Sieben CM, Sumstad D, Kadidlo DM, et al. Massive ex vivo expansion of human natural regulatory T cells (T(regs)) with minimal loss of in vivo functional activity. Sci Transl Med. 2011;3(83):83ra41. doi: 10.1126/scitranslmed.3001809. [DOI] [PMC free article] [PubMed] [Google Scholar]
- 21.Graziano M, St-Pierre Y, Beauchemin C, Desrosiers M, Potworowski EF. The fate of thymocytes labeled in vivo with CFSE. Experimental cell research. 1998;240(1):75–85. doi: 10.1006/excr.1997.3900. [DOI] [PubMed] [Google Scholar]
- 22.Quah BJ, Warren HS, Parish CR. Monitoring lymphocyte proliferation in vitro and in vivo with the intracellular fluorescent dye carboxyfluorescein diacetate succinimidyl ester. Nature protocols. 2007;2(9):2049–56. doi: 10.1038/nprot.2007.296. [DOI] [PubMed] [Google Scholar]
- 23.Quah BJ, Parish CR. New and improved methods for measuring lymphocyte proliferation in vitro and in vivo using CFSE-like fluorescent dyes. J Immunol Methods. 2012;379(1-2):1–14. doi: 10.1016/j.jim.2012.02.012. [DOI] [PubMed] [Google Scholar]
- 24.Kowolik CM, Topp MS, Gonzalez S, Pfeiffer T, Olivares S, Gonzalez N, et al. CD28 costimulation provided through a CD19-specific chimeric antigen receptor enhances in vivo persistence and antitumor efficacy of adoptively transferred T cells. Cancer Res. 2006;66(22):10995–1004. doi: 10.1158/0008-5472.CAN-06-0160. [DOI] [PubMed] [Google Scholar]
- 25.Jensen MC, Popplewell L, Cooper LJ, DiGiusto D, Kalos M, Ostberg JR, et al. Antitransgene rejection responses contribute to attenuated persistence of adoptively transferred CD20/CD19-specific chimeric antigen receptor redirected T cells in humans. Biol Blood Marrow Transplant. 2010;16(9):1245–56. doi: 10.1016/j.bbmt.2010.03.014. [DOI] [PMC free article] [PubMed] [Google Scholar]
- 26.Bopp T, Palmetshofer A, Serfling E, Heib V, Schmitt S, Richter C, et al. NFATc2 and NFATc3 transcription factors play a crucial role in suppression of CD4+ T lymphocytes by CD4+ CD25+ regulatory T cells. J Exp Med. 2005;201(2):181–7. doi: 10.1084/jem.20041538. [DOI] [PMC free article] [PubMed] [Google Scholar]
- 27.Karwot R, Ubel C, Bopp T, Schmitt E, Finotto S. Increased immunosuppressive function of CD4(+)CD25(+)Foxp3(+)GITR+ T regulatory cells from NFATc2((−/−)) mice controls allergen-induced experimental asthma. Immunobiology. 2012;217(9):905–11. doi: 10.1016/j.imbio.2012.01.004. [DOI] [PubMed] [Google Scholar]
- 28.Zeiser R, Nguyen VH, Beilhack A, Buess M, Schulz S, Baker J, et al. Inhibition of CD4+CD25+ regulatory T-cell function by calcineurin-dependent interleukin-2 production. Blood. 2006;108(1):390–9. doi: 10.1182/blood-2006-01-0329. [DOI] [PMC free article] [PubMed] [Google Scholar]
- 29.Haxhinasto S, Mathis D, Benoist C. The AKT-mTOR axis regulates de novo differentiation of CD4+Foxp3+ cells. J Exp Med. 2008;205(3):565–74. doi: 10.1084/jem.20071477. [DOI] [PMC free article] [PubMed] [Google Scholar]
- 30.Sauer S, Bruno L, Hertweck A, Finlay D, Leleu M, Spivakov M, et al. T cell receptor signaling controls Foxp3 expression via PI3K, Akt, and mTOR. Proc Natl Acad Sci U S A. 2008;105(22):7797–802. doi: 10.1073/pnas.0800928105. [DOI] [PMC free article] [PubMed] [Google Scholar]
- 31.Calastretti A, Rancati F, Ceriani MC, Asnaghi L, Canti G, Nicolin A. Rapamycin increases the cellular concentration of the BCL-2 protein and exerts an anti-apoptotic effect. Eur J Cancer. 2001;37(16):2121–8. doi: 10.1016/s0959-8049(01)00256-8. [DOI] [PubMed] [Google Scholar]
- 32.Hendrikx TK, Velthuis JH, Klepper M, van Gurp E, Geel A, Schoordijk W, et al. Monotherapy rapamycin allows an increase of CD4 CD25 FoxP3 T cells in renal recipients. Transpl Int. 2009;22(9):884–91. doi: 10.1111/j.1432-2277.2009.00890.x. [DOI] [PubMed] [Google Scholar]
- 33.Ma A, Qi S, Wang Z, Massicotte E, Dupuis M, Daloze P, et al. Combined therapy of CD4(+)CD25(+) regulatory T cells with low-dose sirolimus, but not calcineurin inhibitors, preserves suppressive function of regulatory T cells and prolongs allograft survival in mice. Int Immunopharmacol. 2009;9(5):553–63. doi: 10.1016/j.intimp.2009.01.033. [DOI] [PubMed] [Google Scholar]
- 34.Zeiser R, Leveson-Gower DB, Zambricki EA, Kambham N, Beilhack A, Loh J, et al. Differential impact of mammalian target of rapamycin inhibition on CD4+CD25+Foxp3+ regulatory T cells compared with conventional CD4+ T cells. Blood. 2008;111(1):453–62. doi: 10.1182/blood-2007-06-094482. [DOI] [PMC free article] [PubMed] [Google Scholar]
- 35.Coenen JJ, Koenen HJ, van Rijssen E, Kasran A, Boon L, Hilbrands LB, et al. Rapamycin, not cyclosporine, permits thymic generation and peripheral preservation of CD4+ CD25+ FoxP3+ T cells. Bone Marrow Transplant. 2007;39(9):537–45. doi: 10.1038/sj.bmt.1705628. [DOI] [PubMed] [Google Scholar]
Associated Data
This section collects any data citations, data availability statements, or supplementary materials included in this article.
Supplementary Materials
Figure S1: No significant toxic effect of CFSE on in vitro cultured Tregs after 24 hours of CFSE staining. Tregs were labeled with CFSE and cultured at 37°C in a CO2 incubator in XVivo-15 media supplemented as previously described. Representative samples were collected and analyzed for number of live cells at 2, 3, and 6 days after the start of the culture and normalized to the cell numbers present at 24 hours. Shown is the mean ± SEM (n = 3).


