

Abstract
Mesenchymal stem cells (MSCs) are a potential source of adult stem cells for cell-based therapeutics due to their substantial multilineage differentiation capacity and secretory functions. No information is presently available regarding the maintenance of immunosuppressive properties of this cell type with repeated passages. It was therefore the aim of the present study to analyze the biological properties, particularly the immunoregulatory effect, of MSCs from late passages. The differences between young and old MSCs in morphology, cell surface antigen phenotype, proliferation, gene expression and immunomodulatory ability were investigated. The results of the current study demonstrated that with the passage of cells, senescent MSCs displayed a characteristically enlarged and flattened morphology, different gene expression profiles and stronger immunosuppressive activities. Increased interleukin-6 production may be a possible underlying mechanism for this enhanced immunomodulatory ability of MSCs. These findings suggest that aged MSCs may provide a treatment option for patients with graft versus host disease and other diseases associated with dysregulation of the immune system.
Keywords: gene expression, immunomodulatory ability, senescence, umbilical cord-mesenchymal stem cell
Introduction
Mesenchymal stem cells (MSCs) are a potential source of adult stem cells for cell-based therapeutics, due to their substantial multilineage differentiation capacity and secretory activity (1–4). Allogeneic umbilical cord and autologous bone marrow may be ideal practical sources of MSCs as they can be easily obtained without ethical concerns. Previous studies have provided encouraging results regarding the application of MSCs in tissue repair and regeneration in several disease models (5–8).
The immunomodulatory activity of MSCs is important in cell therapy (9); MSCs can directly modulate the function of T-cells. They inhibit the maturation and migration of various antigen-presenting cells, suppress B-cell activation, induce suppressor T-cell formation and alter the expression levels of several receptors required for antigen capture and processing (10,11). This immunosuppressive activity of MSCs is influential in tissue repair and regeneration. The anti-oxidative effects of MSCs can improve the survival of injured cells. In addition, expression of the heme-oxygenase-1 (HOX1) protein within MSCs has been demonstrated to decrease cytotoxicity and inhibit the apoptosis induced by oxidative stress (12).
Currently applied doses of MSCs range from 1 to 5 million MSCs/kg body weight (13). Thus, ex vivo expansion is required to meet the high demand of cell dose. With repeated passages, however, MSCs cultured in vitro inevitably undergo senescence, leading to reduced life span and growth arrest. While it has been demonstrated that aging may alter the capacity of MSCs to differentiate into osteoblasts or adipocytes (14), presently there is no information indicating the effects of aging on the immunosuppressive potential of MSCs.
Therefore, in the current study, MSCs from human umbilical cord (hUC-MSCs) were isolated, and their biological properties, particularly the immunomodulatory ability of hUC-MSCs, were compared between cells from early and late passages.
Materials and methods
Isolation and culture of MSCs
Human umbilical cords (n=10) were obtained from Qilu Hospital of Shandong University (Jinan, China) following clinically normal, healthy full-term deliveries. Informed consent was obtained from the parents of all individuals from whom tissues were collected. Tissue collection for research was approved by the Ethics Committee of Qilu Hospital (Shandong, China). Human umbilical cords were excised and washed in 0.1 M phosphate-buffered saline (PBS; pH 7.4) to remove excess blood. The cords were dissected, and blood vessels were removed. The remaining tissue was cut into small pieces (1–2 cm2) and placed in plates containing low-glucose Dulbecco’s modified Eagle’s medium supplemented with 10% fetal bovine serum, 100 U/ml penicillin and 100 μg/ml streptomycin (Gibco-BRL, Grand Island, NY, USA). Cultures were maintained at 37°C in a humidified atmosphere with 5% CO2. The medium was changed every 3–4 days. Following 7–12 days of culture, adherent cells were observed growing out from the individual tissue explants. The adherent fibroblast-like cells became confluent after 2–3 weeks of culture. They were treated with 0.25% trypsin (Gibco-BRL) and passaged at 1×10⁴ cells/cm2 in the medium described above. Cells at the third (hUC-MSC-p3) and fifteenth passage (hUC-MSC-p15) were analyzed in the following experiments.
Cell morphology and scanning electron microscopy (SEM)
Cell morphology was observed daily under a light microscope (IX71 Olympus inverted microscope; Olympus, Tokyo, Japan) Wright-Giemsa staining was performed at the end of passage 3, 6, 9, 12 and 15. The nucleocytoplasmic ratio was analyzed by Image-Pro Plus software (version 5.1.0; Media Cybernetics, Rockville, MD, USA). hUC-MSC-p3 and hUC-MSC-p15 were fixed with 2.5% glutaraldehyde followed by post-fixing with 2% osmium tetroxide and 1% tannic acid. Following dehydration, cells were dried at critical point and lightly sputter-coated with platinum using an IB-50 ion-coater (Eiko Engineering Co., Ltd., Ibaraki, Japan). The samples were observed and photographed using a Hitachi S-570 Scanning Electron microscope (Hitachi, Tokyo, Japan).
Cell surface antigen phenotype assessment by flow cytometry
hUC-MSC-p3 and hUC-MSC-p15 were collected and treated with 0.25% trypsin. The cells were individually stained with fluorescein isothiocyanate (FITC) or phycoerythrin (PE)-conjugated anti-marker monoclonal antibodies in 100 μl PBS for 15 min at room temperature, or for 30 min at 4°C, as recommended by the manufacturer. The antibodies used were specific for the following human antigens: CD34-PE, CD44-FITC, CD45-PE, CD73-PE, CD90-PE and CD105-PE (10 μl for 1×10⁶ cells; AbD Serotec, Raleigh, NC, USA). Cells were analyzed on a Cytometer 1.0, Cytomics™ FC500 flow cytometry system (Beckman Coulter, Brea, CA, USA). Positive cells were counted and the signals for the corresponding immunoglobulin isotypes were compared (15).
Senescence-associated β-galactosidase (SA-β-gal) staining
SA-β-gal staining was performed using the Cellular Senescence Assay kit (Genmed, Shanghai, China). Briefly, cells were fixed for 5 min at room temperature in 1× fixing solution, washed and then incubated overnight at 37°C with fresh SA-β-gal staining solution. Cells were washed with PBS and then examined under a light microscope (IX71 Olympus inverted microscope; Olympus). A total of 10 visual fields were selected in the hUC-MSC-p3 and hUC-MSC-p15 samples, respectively, and the cell number per cm3 was calculated according to the average blue-stained cell number of the 10 fields.
Cell proliferation assay of hUC-MSCs
hUC-MSCs were plated in triplicates at a density of 1×10⁴ cells/cm2 in 96-well culture plates. A 3-[4,5-dimethylthiazol-2-yl]-2,5-diphenyltetrazolium bromide (MTT) assay was performed daily for up to 6 days. Briefly, 20 μl of 5 mg/ml MTT (Sigma-Aldrich, St. Louis, MO, USA) was added to each well, and plates were incubated at 37°C for 4 h. The generated formazan was dissolved in 150 μl dimethyl sulfoxide and measured with a Model 450 microplate reader (Bio-Rad Laboratories, Richmond, CA, USA) at an optical density of 570 nm to determine cell viability.
Microarray analysis and identification of differentially expressed genes (DEGs)
Microarray experiments were performed using Affymetrix GeneChip miRNA Array and Operating Software (GCOS; Affymetrix, Santa Clara, CA, USA) to analyze >41,000 known genes, gene candidates and splice variants. The two experimental groups were hUC-MSC-p3 and hUC-MSC-p15. Three independently cultured samples for each experimental group were used for the microarray analysis. GCOS was used for data collection and normalization. The log2-transformed signal ratio of each gene was calculated using the GCOS baseline tool to identify the DEGs. log2 ratio >2 (four-fold change) was used as the cut-off.
Bioinformatic and functional analysis
For the functional analysis of DEGs, the gene ontology (GO; http://www.geneontology.org) functional categories and the Kyoto Encyclopedia of Genes and Genomes (KEGG; http://www.genome.jp/kegg/) functional pathways were searched for statistically enriched clusters/groups among the DEGs that were identified in the present study using the bioinformatics resources of the Database for Annotation, Visualization and Integrated Discovery (DAVID; http://david.abcc.ncifcrf.gov/). DAVID provides a comprehensive set of functional annotation tools for investigators to understand the biological meaning behind a large list of genes (16).
Peripheral blood mononuclear cell (PBMC) proliferation assay
hUC-MSC-p3 and hUC-MSC-p15 were adapted to co-culture medium (RPMI-1640 medium supplemented with 10% fetal bovine serum, 2 mM L-glutamine, 100 U/ml penicillin and 100 μg/ml streptomycin) by gradually reducing the proportion of Dulbecco’s modified Eagle’s medium. Subsequently, MSCs were plated in triplicate in 96-well plates with 100 μl of co-culture medium at 100% confluence. Allogeneic PBMCs were isolated from peripheral blood by Ficoll-Hypaque gradient centrifugation (300 × g for 20 min), resuspended at 4×10⁵/ml, and then added to wells at a density of 4×10⁴ cells/well in 100 μl medium with or without MSCs in the presence of 10 μg/ml phytohemagglutinin (PHA, Sigma-Aldrich, Taiwan, China). After 48, 72 and 96 h, 100 μl of cells from each well were transferred to new 96-well plates containing 10 μl Cell Counting kit-8 reagent (Dojindo, Kumamoto, Japan). The absorbance at 450 nm was measured with a Model 450 microplate reader. All experiments were performed in triplicate and were repeated at least twice.
Reverse transcription-quantitative polymerase chain reaction (RT-qPCR)
Total RNA was extracted from hUC-MSC-p3 and hUC-MSC-p15 using TRIzol reagent (Invitrogen Life Technologies, Carlsbad, CA, USA). To perform RT, first-strand complementary DNA (cDNA) was synthesized from 5 μg total RNA using Omniscript RT kit (Qiagen, Hamburg, Germany) according to the manufacturer’s instructions. PCR was performed using 2 μl tenfold diluted cDNA.
The cDNA samples were analyzed by RT-qPCR using the Applied Biosystems 7500 Real-Time PCR system (Foster City, CA, USA) with SYBR-Green I dye (Toyobo, Osaka, Japan). The primers (Table I) were obtained from Biosune (Shanghai, China). Data were analyzed using the 2−ΔΔCT method, where ΔCT=(CTtarget gene-CTβ-actin), to obtain the relative expression level, and each sample was normalized using β-actin expression. Results are presented as the fold change relative to the cDNA of hUC-MSC-p3. Data were analyzed using Sequence Detection system, version 1.4 (Applied Biosystems). Reported data are representative of at least three independent experiments.
Table I.
Primer sequences (5′-3′) used for reverse transcription-quantitative polymerase chain reaction.
| Gene | Primer sequence |
|---|---|
| IDO1 | F: GCCCTTCAAGTGTTTCACCAA R: GCCTTTCCAGCCAGACAAATAT |
| HMOX1 | F: AGGGAAGCCCCCACTCAAC R: ACTGTCGCCACCAGAAAGCT |
| IL-6 | F: GGTACATCCTCGACGGCATCT R: GTGCCTCTTTGCTGCTTTCAC |
| IL-10 | F: GCCTTGTCTGAGATGATCCAGTT R: TCACATGCGCCTTGATGTCT |
| iNOS | F: GGTGGAAGCGGTAACAAAGG R: TGCTTGGTGGCGAAGATGA |
| TGFβ1 | F: GGGAAATTGAGGGCTTTCG R: GAACCCGTTGATGTCCACTTG |
| IL-1α | F: GACGCCCTCAATCAAAGTATAATTC R: TCAAATTTCACTGCTTCATCCAGAT |
| IL-1β | F: GCGGCATCCAGCTACGAAT R: GTCCATGGCCACAACAACTG |
| IFN-γ | F: CCAACGCAAAGCAATACATGA R: TTTTCGCTTCCCTGTTTTAGCT |
| β-actin | F: GGACATCCGCAAAGACCTGTA R: GCATCCTGTCGGCAATGC |
IDO1, indoleamine 2,3-dioxygenase-1; F, forward; R, reverse; HMOX1, heme-oxygenase 1; IL, interleukin; iNOS, inducible nitric oxide synthase; TGF, transforming growth factor; IFN, interferon.
Interleukin (IL)-6 enzyme-linked immunoassay (ELISA)
The IL-6 levels in the supernatants of hUC-MSC-p3 and hUC-MSC-p15 were measured by ELISA (Mabtech, Nacka Strand, Sweden) according to the manufacturer’s instructions. IL-6 was assessed using three replicates of each sample.
Statistical analysis
Data are presented as the mean ± standard error of the mean and assessed via analysis of variance and Student’s t-test. P<0.05 was considered to indicate a statistically significant difference All statistical analyses were conducted using the SPSS 13.0 software program (SPSS, Inc., Chicago, IL, USA).
Results
Biological characteristics of hUC-MSCs
Adherent cells with a fibroblastic morphology were observed from 48 h following establishment of explant cultures of human umbilical cord tissue (17). The cells formed a monolayer of homogeneous bipolar spindle-like cells with a whirlpool-like morphology within 2 weeks (Fig. 1A). The expression levels of cell surface molecules on the isolated cells were evaluated by flow cytometry for a minimum of three samples of hUC-MSC-p3 (Fig. 1B) and hUC-MSC-p15 (Fig. 1C). No significant differences in the percentage expression of any of the markers used for flow cytometric analysis were observed. The cells were positive for the following MSC markers: CD44 (99.3 and 99.2%); CD73 (77.8 and 74.2%); CD90 (94.9 and 98.1%); and CD105 (99.8 and 97.1% in hUC-MSC-p3 and hUC-MSC-p15, respectively). They were negative for the following hematopoietic markers: CD34 (0.86 and 0.41%); and CD45 (1.39 and 1.08% in hUC-MSC-p3 and hUC-MSC-p15, respectively), which is consistent with the phenotype of MSCs. hUC-MSC-p3 and hUC-MSC-p15 exhibited similar surface antigen phenotypes, and no significant difference was identified between them (P>0.05).
Figure 1.

Morphology and immunophenotype of umbilical cord-derived cells. (A) Hematoxylin and eosin staining of umbilical cord-derived cells. Cells exhibited a bipolar spindle-shaped morphology and grew as a monolayer. Scale bar, 200 μm. Surface markers of (B) hUC-MSC-p3 and (C) hUC-MSC-p15 were detected by flow cytometric analysis. hUC-MSC-p3 and hUC-MSC-p15 expressed CD29, CD44, CD73, CD90, CD105 and CD106, but not CD34 and CD45, and no significant difference was identified between the expression levels (P>0.05). CD29 and CD106 are not shown in the figure.
With the passage of cells, MSCs became flat with increased cell size, decreased nucleocytoplasmic ratio and increased presence of granulated cytoplasm and debris (Fig. 2A and B). As observed using SEM, hUC-MSC-p3 had a full shape and equally distributed microvilli on the cell surface, whereas hUC-MSC-p15 exhibited more podia and less microvilli, spread more widely and contained more actin stress fibers associated with cellular senescence (Fig. 2C).
Figure 2.

Morphologic changes in hUC-MSCs during long-term culture. (A and B) Giemsa staining of umbilical cord-derived cells. With the passage of cells, MSCs became flat, displayed (A) increased cell size, and (B) possessed reduced nucleocytoplasmic ratio. Scale bar, 100 μm. (C) Morphologic changes identified by SEM. hUC-MSC-p3 were plump and round in size and had equally distributed microvilli on the cell surface, whereas hUC-MSC-p15 exhibited more podia and less microvilli, spread more widely and contained more actin stress fibers. Scale bar: Left, 10 μm; right, 60 μm. MSC, mesenchymal stem cell; SEM, scanning electron microscopy; P, passage.
SA-β-gal activity and cell proliferation of hUC-MSCs
Analyses of senescence-associated SA-β-gal activity and cell growth were performed to demonstrate the senescence of hUC-MSCs. SA-β-gal activity is widely used as a biomarker for senescence. Results of the current analysis demonstrated that hUC-MSC-p15 exhibited a high level of SA-β-gal activity, as determined by the number of flattened, blue-stained cells, while few SA-β-gal-positive cells were observed in hUC-MSC-p3 (P<0.01) (Fig. 3A and B). With regards to cell proliferation, hUC-MSC-p15 had reduced growth activity compared with that of hUC-MSC-p3; thus, a greater number of hUC-MSC-p3 were present compared with the number of hUC-MSC-p15 (Fig. 3C).
Figure 3.
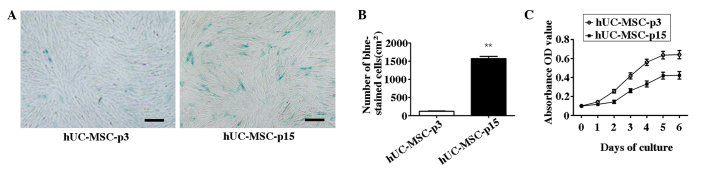
SA-β-gal activity and cell proliferation of hUC-MSCs. (A) Senescence of hUC-MSCs was detected by SA-β-gal staining. hUC-MSC-p15 exhibited high levels of SA-β-gal activity, as determined by the number of flattened and blue-stained cells. Few SA-β-gal-positive cells were observed in hUC-MSC-p3. Scale bar, 200 μm. (B) The number of blue-stained hUC-MSC-p15 cells were significantly higher than those of hUC-MSC-p3 (**P<0.01). (C) Cell proliferation was measured by MTT analysis. hUC-MSC-p15 exhibited a lower growth activity level than hUC-MSC-p3.
Identification of senescence-related genes in hUC-MSCs by microarray analysis
Whole-transcriptome oligonucleotide microarray analysis was performed to identify DEGs between early-passage (hUC-MSC-p3) and late-passage (hUC-MSC-p15) cells. Among the 44,000 probes represented on the microarray, 8,013 DEGs were observed in the comparison of hUC-MSC-p3 and hUC-MSC-p15 (data not shown).
Genes involved in deoxyribonucleotide catabolic process, small ribosomal subunit, snRNA binding, and NADH dehydrogenase activity were overrepresented in the upregulated genes of hUC-MSC-p15. By contrast, genes involved in the attachment of spindle microtubules to the chromosome, costamere, stress fiber and vinculin binding were overrepresented in the downregulated genes of hUC-MSC-p15. Subsets of representative significant GO terms of the up- and downregulated genes of hUC-MSC-p15 are presented in Table IIA and B, respectively.
Table II.
Enriched GO terms in hUC-MSC-p15 samples.
| A, Upregulated genes | ||||||
|---|---|---|---|---|---|---|
|
| ||||||
| GO term | GO ID | Ontology | Observed genes (n) | Total genes (n) | Fold enrichment | P-value |
| Deoxyribonucleotide catabolic process | GO:0009264 | BP | 11 | 14 | 6.10 | <0.001 |
| Pyrimidine deoxyribonucleotide metabolic process | GO:0009219 | BP | 8 | 13 | 4.78 | <0.001 |
| Antigen processing and presentation of peptide antigen via MHC class I | GO:0002474 | BP | 11 | 18 | 4.74 | <0.001 |
| 2′-Deoxyribonucleotide metabolic process | GO:0009394 | BP | 12 | 21 | 4.44 | <0.001 |
| Mitochondrial electron transport, NADH to ubiquinone | GO:0006120 | BP | 24 | 43 | 4.33 | <0.001 |
| Cytosolic small ribosomal subunit | GO:0022627 | CC | 22 | 35 | 4.90 | <0.001 |
| Organellar small ribosomal subunit | GO:0000314 | CC | 11 | 18 | 4.76 | <0.001 |
| Mitochondrial small ribosomal subunit | GO:0005763 | CC | 11 | 18 | 4.76 | <0.001 |
| Small ribosomal subunit | GO:0015935 | CC | 34 | 57 | 4.65 | <0.001 |
| Mitochondrial respiratory chain complex I | GO:0005747 | CC | 27 | 46 | 4.58 | <0.001 |
| snRNA binding | GO:0017069 | MF | 7 | 11 | 5.01 | <0.001 |
| NADH dehydrogenase activity | GO:0003954 | MF | 25 | 44 | 4.47 | <0.001 |
| NADH dehydrogenase (ubiquinone) activity | GO:0008137 | MF | 25 | 44 | 4.47 | <0.001 |
| NADH dehydrogenase (quinone) activity | GO:0050136 | MF | 25 | 44 | 4.47 | <0.001 |
| Oxidoreductase activity, acting on NADH or NADPH, quinone or similar compound as acceptor | GO:0016655 | MF | 26 | 50 | 4.09 | <0.001 |
|
| ||||||
| B, Downregulated genes | ||||||
|
| ||||||
| GO term | GO ID | Ontology | Observed genes (n) | Total genes (n) | Fold enrichment | P-value |
|
| ||||||
| Attachment of spindle microtubules to chromosome | GO:0051313 | BP | 7 | 10 | 4.16 | <0.001 |
| NLS-bearing substrate import into nucleus | GO:0006607 | BP | 9 | 13 | 4.11 | <0.001 |
| Microtubule anchoring | GO:0034453 | BP | 15 | 22 | 4.05 | <0.001 |
| SMAD protein import into nucleus | GO:0007184 | BP | 9 | 14 | 3.82 | <0.001 |
| Mitotic chromosome condensation | GO:0007076 | BP | 8 | 13 | 3.66 | <0.001 |
| Costamere | GO:0043034 | CC | 8 | 12 | 4.15 | <0.001 |
| Condensed nuclear chromosome, centromeric region | GO:0000780 | CC | 7 | 11 | 3.96 | <0.001 |
| Actomyosin | GO:0042641 | CC | 19 | 34 | 3.48 | <0.001 |
| Stress fiber | GO:0001725 | CC | 16 | 29 | 3.43 | <0.001 |
| ER to Golgi transport vesicle | GO:0030134 | CC | 11 | 20 | 3.42 | <0.001 |
| Vinculin binding | GO:0017166 | MF | 7 | 10 | 4.18 | <0.001 |
| Mannosyl-oligosaccharide mannosidase activity | GO:0015924 | MF | 6 | 10 | 3.58 | 0.0025 |
| DNA secondary structure binding | GO:0000217 | MF | 7 | 12 | 3.48 | 0.0013 |
| Microtubule plus-end binding | GO:0051010 | MF | 6 | 11 | 3.25 | 0.0047 |
| Poly-purine tract binding | GO:0070717 | MF | 6 | 11 | 3.25 | 0.0047 |
| Mannosidase activity | GO:0015923 | MF | 8 | 15 | 3.18 | 0.0013 |
Subset of 15 representative significantly overrepresented GO terms of the upregulated and downregulated genes of hUC-MSC-p15. GO, gene ontology; CC, cellular component; MF, molecular function; BP, biological process; NLS, nuclear localization sequence; ER, endoplasmic reticulum.
The expression levels of gene sets containing curated pathways in the KEGG pathway database were compared with expression patterns in hUC-MSC-p3 and hUC-MSC-p15 using the Gene Set Enrichment Analysis algorithm to identify gene pathways with different expression patterns at different stages of aging. A significance threshold of P<0.05 to identify DEG pathways was applied. Using this threshold, 20 upregulated pathways were identified in the hUC-MSC-p15 samples. Among these pathways, seven were associated with metabolism and biosynthesis, and six were involved in autoimmune disorders and degenerative disease (Table III). Furthermore, 49 pathways were significantly upregulated in the hUC-MSC-p3 samples. The majority of them were associated with extracellular matrix (ECM), intercellular junction, metabolism, biosynthesis and cell proliferation (data not shown).
Table III.
Upregulated pathways in hUC-MSC-p15 samples.
| Pathway ID | Definition | Enrichment score | P-value |
|---|---|---|---|
| hsa03010 | Ribosome | 18.62 | <0.01 |
| hsa05322 | Systemic lupus erythematosus | 16.50 | <0.01 |
| hsa00190 | Oxidative phosphorylation | 14.92 | <0.01 |
| hsa05012 | Parkinson’s disease | 11.46 | <0.01 |
| hsa05016 | Huntington’s disease | 8.94 | <0.01 |
| hsa05010 | Alzheimer’s disease | 8.32 | <0.01 |
| hsa05323 | Rheumatoid arthritis | 4.26 | <0.01 |
| hsa00100 | Steroid biosynthesis | 3.04 | <0.01 |
| hsa04621 | NOD-like receptor signaling pathway | 2.27 | <0.01 |
| hsa00052 | Galactose metabolism | 1.83 | 0.015 |
| hsa03040 | Spliceosome | 1.82 | 0.015 |
| hsa00900 | Terpenoid backbone biosynthesis | 1.75 | 0.018 |
| hsa05132 | Salmonella infection | 1.74 | 0.018 |
| hsa05164 | Influenza A | 1.66 | 0.022 |
| hsa05133 | Pertussis | 1.59 | 0.026 |
| hsa01040 | Biosynthesis of unsaturated fatty acids | 1.52 | 0.030 |
| hsa04145 | Phagosome | 1.41 | 0.039 |
| hsa04612 | Antigen processing and presentation | 1.38 | 0.041 |
| hsa04330 | Notch signaling pathway | 1.36 | 0.044 |
| hsa05219 | Bladder cancer | 1.35 | 0.045 |
Cellular senescence enhances the immunomodulatory activity of MSCs
Immunosuppressive effects of MSCs from early and late passages were analyzed in vitro using a lymphocyte co-culture assay. MSCs (~1.9×10⁴) and PBMCs (~4×10⁴) were seeded into a 96-well plate. The results demonstrated that hUC-MSC-p3 and hUC-MSC-p15 were able to inhibit PHA-stimulated PBMC proliferation. Notably, hUC-MSC-p15 had a significantly stronger inhibitory effect on PBMC proliferation than hUC-MSC-p3 (P<0.05; Fig. 4).
Figure 4.
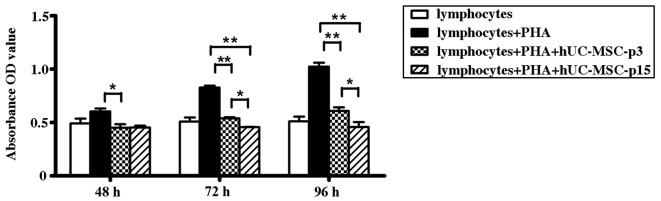
Senescence affects the capacity of cells to suppress allogeneic lymphocyte proliferation (*P<0.05 and **P<0.01). hUC-MSC-p3 and hUC-MSC-p15 significantly inhibited PHA-stimulated peripheral blood mononuclear cell proliferation following 72-h co-culture (P<0.01), and the inhibitory activity of hUC-MSC-p15 was higher than that of hUC-MSC-p3 (P<0.05). Quantitative data are expressed as the mean ± standard error. PHA, phytohemagglutinin.
Changes in immunoregulatory-related cytokines during MSC senescence
In order to define whether cytokine production by MSCs was affected by senescence, the mRNA of nine immunoregulatory-related cytokines was measured by RT-qPCR. The following four immunosuppressive genes were upregulated in hUC-MSC-p15: HMOX-1; IL-10; IL-6; and inducible nitric oxide synthase (iNOS) (P<0.05). By contrast, indoleamine 2,3-dioxygenase-1 (IDO-1) and transforming growth factor-β1 (TGF-β1) were not identified to be significantly changed (P>0.05). The anti-inflammatory genes, IL-1α, IL-1β and interferon-γ (IFN-γ) were downregulated in hUC-MSC-p15 compared with levels in hUC-MSC-p3 (P<0.05) (Fig. 5A). Protein levels of IL-6 were also measured by ELISA, and the results indicated that it was significantly increased during senescence (P<0.05; Fig. 5B).
Figure 5.

Changes in immunoregulatory-related cytokines. (A) RT-qPCR of immunoregulation-related genes (*P<0.05). The hUC-MSC-p3 group values were set at fold change=1. Four immunosuppressive genes, HMOX-1, IL-10, IL-6, and iNOS, were upregulated in hUC-MSC-p15 (P<0.05), whereas no significant difference was observed in IDO-1 and TGF-β1 (P>0.05). For the anti-inflammatory genes, IL-1α, IL-1β, and IFN-γ were downregulated (P<0.05). Quantitative data are expressed as the mean ± standard error. (B) ELISA results indicated that IL-6 production was greatly increased during senescence (P<0.05). HMOX-1, heme-oxygenase 1; IL, interleukin; iNOS, inducible nitric oxide synthase; IDO-1, indoleamine 2,3-dioxygenase-1; TGF-β1, transforming growth factor β1; IFN-γ, interferon γ.
Discussion
To consider the link between aging and MSCs, two interrelated components are important: in vitro aging (passage number in culture) and in vivo aging (donor age). Numerous studies have investigated the effects of donor age on MSC properties in addition to proliferation and differentiation capacities in vitro (18–20). Their findings indicate that in vitro aging has a greater effect on the proliferation and differentiation potential of MSCs compared with the effects of in vivo aging. In the current study, it was hypothesized that the basic effects of aging are associated with cellular senescence in vivo and in vitro. Therefore, in the present study, the effects of cellular senescence on the physiological, functional and molecular parameters of MSCs were focused upon. MSCs from the umbilical cord were cultured, and the fifteenth generation of cells were selected, mimicking cellular senescence.
Cellular senescence is a complex phenomenon that includes changes in functions and replicative capacities. Aging of cells during in vitro culture is dependent upon the number of cell divisions (21). With repeated passage, cells become enlarged and more granular, and their proliferation rates decrease. Ultimately, cells irrevocably stop dividing. Telomere shortening is currently established as one of the major mechanisms leading to replicative senescence (RS) (22,23). In addition, stress-induced premature senescence (SIPS) can be induced through several non-telomeric pathways involving cytokines, oncogenes (oncogene-induced senescence, OIS), persistent DNA damage activation or in vitro cell culture shock (24–26). In the present study, senescent MSCs were obtained through repeated passaging under normal atmospheric conditions. Therefore, RS and SIPS were assessed. hUC-MSC-p15 appeared as senescent cells with regards to morphology. Another sign of in vitro aging is a diminished division capacity due to reaching the maximal number of population doublings, which have been demonstrated to be 30–40 for MSCs in vitro (27,28). In the current study, hUC-MSCs exhibited high replicative potential until the fifteenth passage, when the cells gradually lost their proliferation potential. The number of SA-β-gal-positive cells, a marker for aged cells, increased in late-passage cells. However, with regards to the surface marker antigens, no significant age-related changes in the expression levels were observed, suggesting that the basic nature of the MSCs had not changed during senescence. Data from the current study demonstrated that MSCs at the fifteenth passage already had the characteristics of aging and therefore can be used as aged cells for further experiments.
Microarray analysis was used in the present study to compare the gene expression profiles of early-passage and late-passage hUC-MSCs, and to investigate the molecular mechanism underlying the senescence of these cells. Changes in cell morphology and function of senescent cells may partly be clarified by the microarray results. The gene expression levels of cytoskeleton-associated proteins, including actomyosin, stress fiber (Table IIB), fimbrin and microtubulin (data not shown) were significantly reduced. These proteins have functions in maintaining cell shape and maintaining internal structure; they are also involved in regulating a numebr of biological activities (29), including changing the stability and adaptability of the original external structure. The functions of transport vesicles and dynamic proteins inside the cells were suppressed. ECM was also downregulated in the aged cells. Given its diverse nature and composition, ECM can perform numerous functions, including providing support, segregating tissues from one another, and regulating intercellular communication and dynamic cell behavior (30,31). Their downregulation may be related to the metabolism, proliferation, migration and other aspects of functional changes in senescent cells. Increased metabolic levels of galactose, cholesterol synthesis and deoxyribonucleic acid, combined with decreased levels of protein synthesis and metabolism, may lead to the dysfunction and metabolic disorders observed in senescent cells. Several pathways associated with degenerative diseases were upregulated. The finding is consistent with individuals being more vulnerable to degenerative diseases with age.
It was also observed that a number of upregulated pathways were associated with autoimmune disorders. Considering that immunomodulatory activity is one of the key properties of MSCs, changes in the immunosuppressive potential of senescent MSCs were determined. The lymphocyte co-culture assay indicated that hUC-MSC-p15 had a significantly greater involvement in the inhibition of PHA-stimulated PBMC proliferation than hUC-MSC-p3. This result indicated that senescent MSCs may have a stronger immunomodulatory activity than young MSCs. MSC-mediated immunosuppression involves IDO (32), NO (33), IL-10 (34), TGF-β (35), and prostaglandin (PG) E2 (11). IDO-1 and cyclooxygenase-2 participate in the synthesis of PGE2 in MSCs. PGE2 is the major soluble factor responsible for the in vitro inhibition of allogeneic lymphocyte reaction (36). IDO-1 is an enzyme that catabolizes tryptophan, an essential amino acid, and is critical in MSC-mediated immunosuppression of various tissue origins (37). NO has a well-established role in macrophage function and has been demonstrated to affect T cell receptor signaling, cytokine receptor expression, and T cell phenotype (38). NO production is catalyzed by iNOS, which is important in immune regulation. IL-10, an anti-inflammatory cytokine, can directly regulate innate and adaptive Th1 and Th2 responses by limiting T cell activation and differentiation, and by suppressing pro-inflammatory responses in tissues, leading to impaired pathogen control and/or reduced immunopathology (39). HMOX-1 is an anti-inflammatory (40) and immunosuppressive molecule (41) in human MSCs (42) that can mediate the effect of molecules, such as IL-10 and NO (43). In the present study, HMOX-1 was indicated to be significantly upregulated in senescent cells. However, in contrast to a previous study by Toussaint et al (44), no significant changes were observed in the levels of TGF-β, a powerful pleiotropic immunosuppressive and anti-inflammatory cytokine (45). It is possible that the differences between the results are due to the use of different cell types or generations. In accordance with the changes above, three pro-inflammatory cytokines (IL-1α, IL-1β and IFN-γ) were significantly downregulated in senescent cells. These phenomena are in accordance with the results of lymphocyte proliferation assays. The upregulation of immunosuppressive and anti-oxidative molecules, together with the downregulation of proinflammatory cytokines, suggests that senescent MSCs have stronger immunosuppressive activities than less aged cells.
Specifically, it was noted that IL-6 mRNA was upregulated in senescent MSCs. IL-6 is theorized to function by triggering the suppressive effect of MSCs on T cells, as it induces the production of the anti-proliferative PGE2 in MSCs (46). In addition, neutralizing antibodies against IL-6 may reduce the capacity of MSCs to suppress T cell proliferation (46). These findings support the concept that IL-6 production is of relevance to immunoregulation by MSCs. Notably, IL-6 production has often previously been associated with aging (47,48), and IL-6 induces the expression of the GADD45a protein, which is associated with short telomere-induced replicative senescence (49). The results of the present study demonstrated increased IL-6 production by MSCs during senescence. This may explain why the suppression of PBMC proliferation by MSCs is enhanced following long-term in vitro culture.
In conclusion, changes in quantity, quality (differentiation/regeneration capacity) and immunomodulatory activity were observed between young and old hUC-MSCs. With the progressive passage of cells, senescent MSCs displayed a characteristic enlarged and flattened morphology, different gene expression profiles and stronger immunosuppressive activity. Increased IL-6 production may be a possible reason for the enhanced immunomodulatory ability of MSCs. The present study demonstrates further justification for the selection of MSCs in the treatment of immune-related diseases. However, the mechanism of cellular senescence and the effects of signaling pathways on immunomodulatory activities require further clarification.
Acknowledgements
This study was supported by the Fundamental Research Funds of Shandong University (no. 2014QY003-11) and grants from the Shandong Province Natural Science Foundation (no. 2013GSF11812) and 973 Research Development Program (no. 2012CB966504).
References
- 1.Williams AR, Hare JM. Mesenchymal stem cells: biology, pathophysiology, translational findings, and therapeutic implications for cardiac disease. Circ Res. 2011;109:923–940. doi: 10.1161/CIRCRESAHA.111.243147. [DOI] [PMC free article] [PubMed] [Google Scholar]
- 2.Musumeci G, Lo Furno D, Loreto C, et al. Mesenchymal stem cells from adipose tissue which have been differentiated into chondrocytes in three-dimensional culture express lubricin. Exp Biol Med (Maywood) 2011;236:1333–1341. doi: 10.1258/ebm.2011.011183. [DOI] [PubMed] [Google Scholar]
- 3.Matsushita K, Morello F, Wu Y, et al. Mesenchymal stem cells differentiate into renin-producing juxtaglomerular (JG)-like cells under the control of liver X receptor-alpha. J Biol Chem. 2010;285:11974–11982. doi: 10.1074/jbc.M109.099671. [DOI] [PMC free article] [PubMed] [Google Scholar]
- 4.Johnson TV, Bull ND, Hunt DP, et al. Neuroprotective effects of intravitreal mesenchymal stem cell transplantation in experimental glaucoma. Invest Ophthalmol Vis Sci. 2010;51:2051–2059. doi: 10.1167/iovs.09-4509. [DOI] [PMC free article] [PubMed] [Google Scholar]
- 5.Weiss ML, Medicetty S, Bledsoe AR, et al. Human umbilical cord matrix stem cells: preliminary characterization and effect of transplantation in a rodent model of Parkinson’s disease. Stem Cells. 2006;24:781–792. doi: 10.1634/stemcells.2005-0330. [DOI] [PubMed] [Google Scholar]
- 6.Tsai PC, Fu TW, Chen YM, et al. The therapeutic potential of human umbilical mesenchymal stem cells from Wharton’s jelly in the treatment of rat liver fibrosis. Liver Transpl. 2009;15:484–495. doi: 10.1002/lt.21715. [DOI] [PubMed] [Google Scholar]
- 7.Lund RD, Wang S, Lu B, et al. Cells isolated from umbilical cord tissue rescue photoreceptors and visual functions in a rodent model of retinal disease. Stem Cells. 2007;25:602–611. doi: 10.1634/stemcells.2006-0308. [DOI] [PubMed] [Google Scholar]
- 8.Liao W, Xie J, Zhong J, et al. Therapeutic effect of human umbilical cord multipotent mesenchymal stromal cells in a rat model of stroke. Transplantation. 2009;87:350–359. doi: 10.1097/TP.0b013e318195742e. [DOI] [PubMed] [Google Scholar]
- 9.Boregowda SV, Phinney DG. Therapeutic applications of mesenchymal stem cells: current outlook. BioDrugs. 2012;26:201–208. doi: 10.1007/BF03261879. [DOI] [PubMed] [Google Scholar]
- 10.Atoui R, Shum-Tim D, Chiu RC. Myocardial regenerative therapy: immunologic basis for the potential ‘universal donor cells’. Ann Thorac Surg. 2008;86:327–334. doi: 10.1016/j.athoracsur.2008.03.038. [DOI] [PubMed] [Google Scholar]
- 11.Aggarwal S, Pittenger MF. Human mesenchymal stem cells modulate allogeneic immune cell responses. Blood. 2005;105:1815–1822. doi: 10.1182/blood-2004-04-1559. [DOI] [PubMed] [Google Scholar]
- 12.Chen YT, Sun CK, Lin YC, et al. Adipose-derived mesenchymal stem cell protects kidneys against ischemia-reperfusion injury through suppressing oxidative stress and inflammatory reaction. J Transl Med. 2011;9:51. doi: 10.1186/1479-5876-9-51. [DOI] [PMC free article] [PubMed] [Google Scholar]
- 13.Subbanna PK. Mesenchymal stem cells for treating GVHD: in-vivo fate and optimal dose. Med Hypotheses. 2007;69:469–470. doi: 10.1016/j.mehy.2006.12.016. [DOI] [PubMed] [Google Scholar]
- 14.Laschober GT, Brunauer R, Jamnig A, et al. Age-specific changes of mesenchymal stem cells are paralleled by upregulation of CD106 expression as a response to an inflammatory environment. Rejuvenation Res. 2011;14:119–131. doi: 10.1089/rej.2010.1077. [DOI] [PubMed] [Google Scholar]
- 15.Lee OK, Kuo TK, Chen WM, et al. Isolation of multipotent mesenchymal stem cells from umbilical cord blood. Blood. 2004;103:1669–1675. doi: 10.1182/blood-2003-05-1670. [DOI] [PubMed] [Google Scholar]
- 16.Huang da W, Sherman BT, Lempicki RA. Systematic and integrative analysis of large gene lists using DAVID bioinformatics resources. Nat Protoc. 2009;4:44–57. doi: 10.1038/nprot.2008.211. [DOI] [PubMed] [Google Scholar]
- 17.Li J, Li D, Liu X, Tang S, Wei F. Human umbilical cord mesenchymal stem cells reduce systemic inflammation and attenuate LPS-induced acute lung injury in rats. J Inflamm (Lond) 2012;9:33. doi: 10.1186/1476-9255-9-33. [DOI] [PMC free article] [PubMed] [Google Scholar]
- 18.Justesen J, Stenderup K, Eriksen EF, Kassem M. Maintenance of osteoblastic and adipocytic differentiation potential with age and osteoporosis in human marrow stromal cell cultures. Calcif Tissue Int. 2002;71:36–44. doi: 10.1007/s00223-001-2059-x. [DOI] [PubMed] [Google Scholar]
- 19.Stenderup K, Justesen J, Clausen C, Kassem M. Aging is associated with decreased maximal life span and accelerated senescence of bone marrow stromal cells. Bone. 2003;33:919–926. doi: 10.1016/j.bone.2003.07.005. [DOI] [PubMed] [Google Scholar]
- 20.Tokalov SV, Gruener S, Schindler S, et al. A number of bone marrow mesenchymal stem cells but neither phenotype nor differentiation capacities changes with age of rats. Mol Cells. 2007;24:255–260. [PubMed] [Google Scholar]
- 21.von Zglinicki T, Martin-Ruiz CM. Telomeres as biomarkers for ageing and age-related diseases. Curr Mol Med. 2005;5:197–203. doi: 10.2174/1566524053586545. [DOI] [PubMed] [Google Scholar]
- 22.Olovnikov AM. A theory of marginotomy. The incomplete copying of template margin in enzymic synthesis of polynucleotides and biological significance of the phenomenon. J Theor Biol. 1973;41:181–190. doi: 10.1016/0022-5193(73)90198-7. [DOI] [PubMed] [Google Scholar]
- 23.Hayflick L. Mortality and immortality at the cellular level. A review. Biochemistry (Mosc) 1997;62:1180–1190. [PubMed] [Google Scholar]
- 24.Campisi J, d‘Adda di Fagagna F. Cellular senescence: when bad things happen to good cells. Nat Rev Mol Cell Biol. 2007;8:729–740. doi: 10.1038/nrm2233. [DOI] [PubMed] [Google Scholar]
- 25.Toussaint O, Medrano EE, von Zglinicki T. Cellular and molecular mechanisms of stress-induced premature senescence (SIPS) of human diploid fibroblasts and melanocytes. Exp Gerontol. 2000;35:927–945. doi: 10.1016/s0531-5565(00)00180-7. [DOI] [PubMed] [Google Scholar]
- 26.Serrano M, Blasco MA. Putting the stress on senescence. Curr Opin Cell Biol. 2001;13:748–753. doi: 10.1016/s0955-0674(00)00278-7. [DOI] [PubMed] [Google Scholar]
- 27.Banfi A, Muraglia A, Dozin B, et al. Proliferation kinetics and differentiation potential of ex vivo expanded human bone marrow stromal cells: Implications for their use in cell therapy. Exp Hematol. 2000;28:707–715. doi: 10.1016/s0301-472x(00)00160-0. [DOI] [PubMed] [Google Scholar]
- 28.Baxter MA, Wynn RF, Jowitt SN, et al. Study of telomere length reveals rapid aging of human marrow stromal cells following in vitro expansion. Stem Cells. 2004;22:675–682. doi: 10.1634/stemcells.22-5-675. [DOI] [PubMed] [Google Scholar]
- 29.Hall A, Nobes CD. Rho GTPases: molecular switches that control the organization and dynamics of the actin cytoskeleton. Philos Trans R Soc Lond B Biol Sci. 2000;355:965–970. doi: 10.1098/rstb.2000.0632. [DOI] [PMC free article] [PubMed] [Google Scholar]
- 30.Kao G, Huang CC, Hedgecock EM, Hall DH, Wadsworth WG. The role of the laminin beta subunit in laminin heterotrimer assembly and basement membrane function and development in C elegans. Dev Biol. 2006;290:211–219. doi: 10.1016/j.ydbio.2005.11.026. [DOI] [PubMed] [Google Scholar]
- 31.Kadler KE, Hill A, Canty-Laird EG. Collagen fibrillogenesis: fibronectin, integrins, and minor collagens as organizers and nucleators. Curr Opin Cell Biol. 2008;20:495–501. doi: 10.1016/j.ceb.2008.06.008. [DOI] [PMC free article] [PubMed] [Google Scholar]
- 32.Meisel R, Zibert A, Laryea M, et al. Human bone marrow stromal cells inhibit allogeneic T-cell responses by indoleamine 2,3-dioxygenase-mediated tryptophan degradation. Blood. 2004;103:4619–4621. doi: 10.1182/blood-2003-11-3909. [DOI] [PubMed] [Google Scholar]
- 33.Sato K, Ozaki K, Oh I, et al. Nitric oxide plays a critical role in suppression of T-cell proliferation by mesenchymal stem cells. Blood. 2007;109:228–234. doi: 10.1182/blood-2006-02-002246. [DOI] [PubMed] [Google Scholar]
- 34.Batten P, Sarathchandra P, Antoniw JW, et al. Human mesenchymal stem cells induce T cell anergy and downregulate T cell allo-responses via the TH2 pathway: relevance to tissue engineering human heart valves. Tissue Eng. 2006;12:2263–2273. doi: 10.1089/ten.2006.12.2263. [DOI] [PubMed] [Google Scholar]
- 35.Groh ME, Maitra B, Szekely E, Koç ON. Human mesenchymal stem cells require monocyte-mediated activation to suppress alloreactive T cells. Exp Hematol. 2005;33:928–934. doi: 10.1016/j.exphem.2005.05.002. [DOI] [PubMed] [Google Scholar]
- 36.Bunnell BA, Betancourt AM, Sullivan DE. New concepts on the immune modulation mediated by mesenchymal stem cells. Stem Cell Res Ther. 2010;1:34. doi: 10.1186/scrt34. [DOI] [PMC free article] [PubMed] [Google Scholar]
- 37.Zhang Q, Shi S, Liu Y, et al. Mesenchymal stem cells derived from human gingiva are capable of immunomodulatory functions and ameliorate inflammation-related tissue destruction in experimental colitis. J Immunol. 2009;183:7787–7798. doi: 10.4049/jimmunol.0902318. [DOI] [PMC free article] [PubMed] [Google Scholar]
- 38.Niedbala W, Cai B, Liew FY. Role of nitric oxide in the regulation of T cell functions. Ann Rheum Dis. 2006;65(Suppl 3):iii37–iii40. doi: 10.1136/ard.2006.058446. [DOI] [PMC free article] [PubMed] [Google Scholar]
- 39.Couper KN, Blount DG, Riley EM. IL-10: the master regulator of immunity to infection. J Immunol. 2008;180:5771–5777. doi: 10.4049/jimmunol.180.9.5771. [DOI] [PubMed] [Google Scholar]
- 40.Otterbein LE, Choi AM. Heme oxygenase: colors of defense against cellular stress. Am J Physiol Lung Cell Mol Physiol. 2000;279:L1029–1037. doi: 10.1152/ajplung.2000.279.6.L1029. [DOI] [PubMed] [Google Scholar]
- 41.Chauveau C, Rémy S, Royer PJ, et al. Heme oxygenase-1 expression inhibits dendritic cell maturation and proinflammatory function but conserves IL-10 expression. Blood. 2005;106:1694–1702. doi: 10.1182/blood-2005-02-0494. [DOI] [PubMed] [Google Scholar]
- 42.Chabannes D, Hill M, Merieau E, et al. A role for heme oxygenase-1 in the immunosuppressive effect of adult rat and human mesenchymal stem cells. Blood. 2007;110:3691–3694. doi: 10.1182/blood-2007-02-075481. [DOI] [PubMed] [Google Scholar]
- 43.Bach FH. Heme oxygenase-1: a therapeutic amplification funnel. FASEB J. 2005;19:1216–1219. doi: 10.1096/fj.04-3485cmt. [DOI] [PubMed] [Google Scholar]
- 44.Toussaint O, Remacle J, Dierick JF, et al. From the Hayflick mosaic to the mosaics of ageing. Role of stress-induced premature senescence in human ageing. Int J Biochem Cell Biol. 2002;34:1415–1429. doi: 10.1016/s1357-2725(02)00034-1. [DOI] [PubMed] [Google Scholar]
- 45.Derynck R, Akhurst RJ, Balmain A. TGF-beta signaling in tumor suppression and cancer progression. Nat Genet. 2001;29:117–129. doi: 10.1038/ng1001-117. [DOI] [PubMed] [Google Scholar]
- 46.Djouad F, Charbonnier LM, Bouffi C, et al. Mesenchymal stem cells inhibit the differentiation of dendritic cells through an interleukin-6-dependent mechanism. Stem Cells. 2007;25:2025–2032. doi: 10.1634/stemcells.2006-0548. [DOI] [PubMed] [Google Scholar]
- 47.Singh T, Newman AB. Inflammatory markers in population studies of aging. Ageing Res Rev. 2011;10:319–329. doi: 10.1016/j.arr.2010.11.002. [DOI] [PMC free article] [PubMed] [Google Scholar]
- 48.Ryu E, Hong S, Kang J, et al. Identification of senescence-associated genes in human bone marrow mesenchymal stem cells. Biochem Biophys Res Commun. 2008;371:431–436. doi: 10.1016/j.bbrc.2008.04.111. [DOI] [PubMed] [Google Scholar]
- 49.Zhan Q, Lord KA, Alamo I, Jr, et al. The gadd and MyD genes define a novel set of mammalian genes encoding acidic proteins that synergistically suppress cell growth. Mol Cell Biol. 1994;14:2361–2371. doi: 10.1128/mcb.14.4.2361. [DOI] [PMC free article] [PubMed] [Google Scholar]