

Abstract
Aim
To compare using propensity score analysis the outcome of beginning insulin therapy with basal, premix, mealtime + basal or mealtime insulin on the basis of data from 3031 people from the observational CREDIT (Cardiovascular Risk Evaluation in People with Type 2 Diabetes on Insulin Therapy) study. This approach overcomes likely confounding in baseline and unknown characteristics common to observational studies.
Methods
Efficacy and safety outcomes were collected at baseline and at 1 year in previously insulin-naïve people. Propensity score matched groups using all available baseline data were defined to compare outcomes by pairs of insulin regimens.
Results
From 2659 people with available data, propensity score matches were achieved for 686 people starting premix or basal insulin, 542 starting basal + mealtime or premix insulin and 400 starting basal or basal + mealtime. HbA1c reduction did not differ between the three pairs of insulin regimens. However, the relative risk of overall and nocturnal hypoglycaemia was lower (p = 0.010 to p < 0.001) with basal or basal + mealtime compared with premix insulin, and for nocturnal (p = 0.021) but not overall hypoglycaemia for basal compared to basal + mealtime insulin. Body weight increase was less for basal versus premix insulin [–1.3 (95% CI –2.1, –0.6) kg, p < 0.001] or versus basal + mealtime insulin [–1.4 (–2.5, –0.3) kg, p = 0.016], but did not differ between basal + mealtime and premix. Smaller groups matching mealtime insulin had some residual mismatching of HbA1c.
Conclusion
Comparing insulin regimens between individuals matched by propensity scores indicated differences in hypoglycaemia and body weight change, despite similar HbA1c reductions. Our findings are consistent with those from randomized controlled trials.
Keywords: CREDIT study, HbA1c, hypoglycaemia, insulin regimens, propensity score
Introduction
Guidelines, including evidence-based guidelines, from various health-care organizations recommend glucose control targets in people with type 2 diabetes (T2DM) 1–3. When metformin and other oral therapies can no longer attain glucose control targets, it is generally recommended that insulin therapy be started. Recommendations as to insulin type vary. Some authorities endorse both basal and premix approaches, and others place more emphasis on basal insulin; mealtime insulin alone is used on occasion, or in a comprehensive basal + mealtime regimen even from the time of starting insulin 1–3.
Randomized clinical trials (RCTs), such as the Treat to Target in Type 2 Diabetes (4-T) trial 4, have provided evidence on the relative efficacy of insulin regimens, but these trials were conducted in people and clinical environments that may not be representative of those in real-world clinical practice. Although randomized trials maximize internal validity, it is likely that a range of selection biases will exist in relation to the recruitment and retention of patients in trials. Analyses based on non-interventional observational studies may overcome some of the challenges of generalizability inherent in randomized trials and may be used as a bridge from randomized trials towards more real-world settings. Propensity score matching may overcome some of the limitations of observational studies of therapies in terms of internal validity 5, although properly randomized studies are the only design that can ensure unbiased results, albeit in an artificial setting. Hence it is informative to consider the results of both kinds of studies.
The Cardiovascular Risk Evaluation in People with Type 2 Diabetes on Insulin Therapy (CREDIT) study, an international 4-year, non-interventional, longitudinal study, was designed to evaluate, in routine clinical practice, the relationship between blood glucose control and cardiovascular (CV) events in people treated with insulin and to provide insight into current, real-world practices of the use of insulin in people with T2DM. Here we report blood glucose-related outcomes at 1 year and use propensity score matched analyses to compare the performance of different insulin regimens.
Methods
The CREDIT study design, site and participant selection process and participant baseline characteristics have been reported previously 6. Briefly, the study involved 314 centres in 12 countries, 10 in Europe, plus centres in Canada and Japan. Eligibility criteria were: men and women with T2DM, aged >40 years, who had started insulin therapy (any type or supplier) within 12 months prior to study entry and who had an HbA1c measurement within the 3 months before starting insulin. As a non-interventional study, there was no fixed study visit schedule, and insulin choice, dosage, titration, funding and concomitant oral agent therapy were according to usual local practice. Data were gathered in routine clinical practice, with the treating physicians asked to report updated participant data on a 6-month cycle. Data at the ’1-year’ follow-up represents that provided during the 9–18 months after beginning insulin. Ethical approval according to local regulations was obtained for all study sites. Conduct of the study adhered to standards of data collection for clinical trials, according to the Declaration of Helsinki. Written informed consent was obtained from all participants before commencement of data collation.
To assess glucose control-related outcomes, we studied HbA1c, fasting plasma glucose (FPG), postprandial plasma glucose (PPPG), symptomatic hypoglycaemic episodes (overall), nocturnal hypoglycaemic events, body weight increase and switching to alternative insulin therapy.
Statistical Analysis
Data are analysed and reported by descriptive statistics using sas software (v 9.2; Cary, NC, USA). Propensity score-matched cohorts were used to assess blood glucose control outcomes (as above) by pairs of insulin regimens: basal, mealtime, basal + mealtime and premix (giving six possible pairings). No distinction was made between analogue and human insulins.
The propensity score analysis was performed by one of the authors (N. F.). Proc GLIMMIX in sas (v 9.2) was used to develop propensity scores used as the basis for the selection of propensity score-matched cohorts. Each propensity score included the following baseline explanatory variables which could potentially be related with treatment allocation: age, sex, time since diagnosis of diabetes, weight, BMI, baseline HbA1c, use of biguanides, dipeptidyl peptidase (DPP)-4 inhibitors, glinides, glucagon-like peptide (GLP)-1 receptor agonists, sulfonylureas, thiazolidinediones and geographical region; we also included the number (count) of glucose-lowering drugs (other than insulin), α-adrenergic blockers, angiotensin 2 receptor blockers/ACE inhibitors, anticoagulants, antiplatelet agents, β-adrenergic blockers, calcium channel blockers, diuretics, fibrates, statins, vasodilators (including nitrates). The intention was to achieve precise matching for patient characteristics in matched cohorts, as selection biases might confound comparisons between the treatment strategies. An optimal matching algorithm (dist macro in sas) was used to match participants within the two groups, using a precise matching criterion (<0.01) for the principal analyses between treated pairs on the propensity score.
Once the propensity score-matched cohorts were established, baseline demographic and clinical characteristics were tabulated in the format described for the whole population. Matched cohorts were compared using generalized mixed models with appropriate error terms and link functions, with investigator sites included as random effects and where appropriate, baseline characteristics of the participants as explanatory variables.
Missing data were not imputed. Pair-matched cohorts are described using available baseline characteristics, and are compared for glucose-related outcomes at 1 year using methods analogous to those used in randomized trials. Sensitivity analyses were conducted using a more stringent matching criterion on the propensity scores (0.001).
Results
Participant Disposition
At the 1-year follow-up, data were available for 2734 (90.2%) of the 3031 participants in the population analysed at baseline. Of the 297 with no 1-year data, 239 had no follow-up information available within the time window and 58 withdrew before 1-year data were collected, because of participant request (n = 13), lost to follow-up (n = 15), death (n = 14), investigator request (n = 2) and other (n = 14).
Insulin and Oral Agent Regimens
The use of premix and basal + mealtime insulin therapy increased after 1 year, whereas the use of basal insulin and mealtime insulin declined (figure 1). A small proportion of participants (2.3%) were no longer taking insulin after 1 year. In all, 75.0% of participants remained on their initial regimen, with the highest percentage in the premix group (85.4%) and the lowest on mealtime insulin alone (37.6%). Insulin dose increased from 20.0 (s.d. 14.6) U/day when starting insulin to 35.7 (25.5) U/day at 1 year (Table 1).
Figure 1.
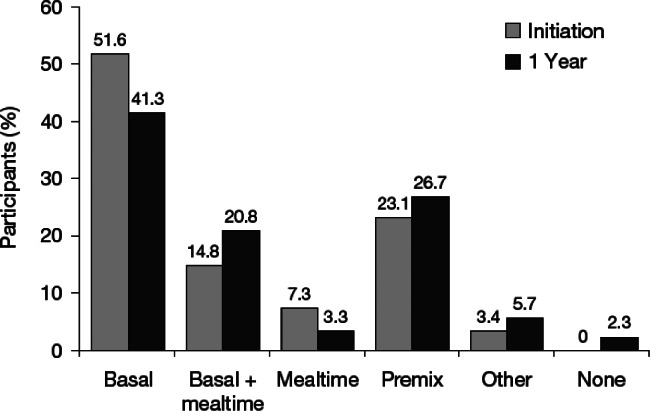
Proportion of people using specified insulin regimens at initiation and 1 year.
Table 1.
Baseline and 1-year metabolic outcomes in people with type 2 diabetes beginning insulin therapy in routine clinical practice
| Baseline | 1 year | Change | p | |
|---|---|---|---|---|
| n | 3031 | 2734 | 2481 | |
| Insulin dose, U/day | 20.0 (14.6) | 35.8 (25.6) | 15.7 (23.7) | <0.001 |
| HbA1c, % units | 9.5 (2.0) | 7.7 (1.4) | –1.9 (2.1) | <0.001 |
| mmol/mol | 80 (22) | 61 (15) | –21 (23) | <0.001 |
| HbA1c by initial insulin regimen, % units | ||||
| Basal (N = 1326, 1291, 1264)* | 9.3 (1.8) | 7.7 (1.4) | –1.5 (1.9) | <0.001 |
| Basal + mealtime (N = 392, 387, 379)* | 10.0 (2.2) | 7.5 (1.5) | –2.5 (2.5) | <0.001 |
| Mealtime only (N = 98, 197, 192)* | 9.4 (2.0) | 7.3 (1.2) | –2.1 (2.0) | <0.001 |
| Premix (N = 603, 577, 568)* | 9.8 (2.0) | 7.8 (1.4) | –2.0 (2.2) | <0.001 |
| Other (N = 82, 83, 78)* | 9.2 (1.9) | 7.6 (1.5) | –1.5 (2.1) | <0.001 |
| Fasting plasma glucose, mmol/l | 11.6 (3.7) | 7.9 (2.5) | –3.6 (4.0) | <0.001 |
| Postprandial plasma glucose, mmol/l | 14.2 (4.5) | 9.6 (3.2) | –4.7 (4.9) | <0.001 |
| Body weight, kg | 79.8 (18.9) | 81.4 (18.6) | 1.7 (4.8) | <0.001 |
| Blood pressure | ||||
| Systolic, mmHg | 138.7 (19.1) | 136.5 (16.9) | –2.3 | <0.0001 |
| Diastolic, mmHg | 80.8 (11.6) | 78.9 (10.3) | –1.9 | <0.0001 |
| Plasma lipids | ||||
| Total cholesterol, mmol/l | 5.2 (1.4) | 4.9 (1.3) | –0.4 (1.3) | <0.001 |
| LDL cholesterol, mmol/l | 2.9 (0.9) | 2.7 (0.8) | –0.2 (0.9) | <0.001 |
| HDL cholesterol, mmol/l | 1.3 (0.4) | 1.3 (0.4) | 0.0 (0.3) | 0.11 |
| Triglycerides, mmol/l | 2.1 (2.4) | 1.7 (1.4) | –0.4 (2.5) | <0.001 |
| Hypoglycaemia in previous 6 months | ||||
| Overall | ||||
| People with ≥1 event, % | 19.8 | |||
| Rate, events/patient-years | 2.2 (9.7) | |||
| Nocturnal | ||||
| People with ≥1 event, % | 7.9 | |||
| Rate, events/patient-years | 0.4 (2.0) | |||
Mean (s.d.) unless otherwise stated.
Number of participants at 1 year with HbA1c values at baseline, at 1 year, and at both times for change from baseline, respectively.
There was a trend towards the use of fewer oral glucose lowering medications at 1 year, with the largest decrease occurring with sulfonylureas (from 43.4 to 30.5% of participants). Compared to baseline, fewer participants were taking two oral medications (30.4 to 23.9%) and more were taking one (35.7 vs. 33.0%) or none (36.2 vs. 30.0%) after a year.
Overall Efficacy and Safety
Mean HbA1c declined by –1.9% (2.1) units [–21 (23) mmol/mol] from 9.5% (2.0) [80 (22) mmol/mol], over the year (Table 1), a change largely accounted for by the fall in FPG of –3.6 (4.0) mmol/l, although PPPG also fell by –4.7 (4.9) mmol/l. Only 32.1% of participants achieved an HbA1c <7%. In the 6 months before the 1-year visit, symptomatic hypoglycaemia was reported by 20.1% of participants, and nocturnal hypoglycaemia by 2.0% of participants (Table 1). Body weight increased by 1.7 kg (4.8). Blood pressure, total cholesterol, low-density lipoprotein (LDL)-cholesterol and triglycerides declined modestly, although reaching statistically significance, while high-density lipoprotein (HDL) cholesterol was unchanged (Table 1).
Comparison of Insulin Regimens
There were 2659 subjects who started insulin and had data that enabled their inclusion in the analysis: basal insulin alone, 1355; basal + mealtime insulin, 400; mealtime insulin alone, 204; premix insulin, 613; and other insulin, 87.
Basal Insulin versus Premix
A propensity score match was achieved for 343 people starting premix with 343 starting basal insulin (Table 2). In general, the pair groups were well matched, but there was some residual difference in region, where fewer people from Southern Europe were treated with premix (25%) versus basal (38%) (Table 2). The final insulin regimen at 1 year showed some evolution towards basal + mealtime and premix in those starting basal insulin, but was more stable (p < 0.001) on those starting premix (Table 3). Use of basal insulin was associated with a lower insulin dose and fewer injections than with premix insulin (Table 3).
Table 2.
Baseline characteristics of the larger propensity matched groups
| Basal versus premix | Basal + mealtime versus premix | Basal versus basal + mealtime | |||||||
|---|---|---|---|---|---|---|---|---|---|
| Basal | Premix | p | Basal + mealtime | Premix | p | Basal | Basal + mealtime | p | |
| n | 343 | 343 | 271 | 271 | 200 | 200 | |||
| Age, years | 61.3 (10.1) | 61.3 (9.5) | 0.98 | 59.4 (9.9) | 61.1 (9.7) | 0.045 | 62.1 (9.8) | 59.4 (9.7) | 0.005 |
| Diabetes duration, years | 10.4 (6.8) | 9.7 (6.7) | 0.22 | 9.6 (7.4) | 10.9 (7.7) | 0.043 | 10.8 (7.0) | 9.3 (7.1) | 0.037 |
| Female, n (%) | 165 (48.1) | 177 (51.6) | 0.40 | 151 (55.7) | 128 (47.2) | 0.059 | 108 (54.0) | 122 (61.0) | 0.19 |
| Body weight, kg | 82.2 (18.6) | 82.4 (18.2) | 0.90 | 77.4 (18.4) | 76.9 (18.7) | 0.72 | 79.1 (17.4) | 82.2 (17.1) | 0.069 |
| BMI, kg/m2 | 29.8 (6.0) | 30.2 (6.3) | 0.38 | 26.7 (6.0) | 28.2 (6.1) | 0.34 | 29.3 (5.6) | 30.4 (5.9) | 0.040 |
| HbA1c, % | 9.4 (2.0) | 9.7 (2.0) | 0.10 | 10.1 (2.1) | 10.0 (1.9) | 0.77 | 9.5 (2.4) | 9.8 (2.2) | 0.18 |
| mmol/mol | 79 (22) | 83 (22) | 87 (23) | 86 (21) | 80 (27) | 84 (24) | |||
| Prescriptions, n | 9.7 (3.0) | 9.5 (3.2) | 0.32 | 9.9 (2.5) | 9.6 (2.8) | 0.28 | 9.7 (2.9) | 9.6 (2.6) | 0.69 |
| α-Glucosidase inhibitor, n (%) | 14 (4.1) | 20 (5.8) | 0.38 | 7 (2.6) | 25 (9.2) | 0.002 | 10 (5.0) | 5 (2.5) | 0.29 |
| Biguanide, n (%) | 185 (53.9) | 185 (53.9) | 1 | 70 (25.8) | 88 (32.5) | 0.11 | 85 (42.5) | 71 (35.5) | 0.18 |
| DPP-4 inhibitor, n (%) | 0 (0) | 0 (0) | 1 | 0 (0) | 0 (0) | 1 | 0 | 0 | 1 |
| Glinides, n (%) | 12 (3.5) | 18 (5.3) | 0.36 | 2 (0.7) | 4 (1.5) | 0.69 | 4 (2.0) | 2 (1.0%) | 0.69 |
| GLP-1 receptor agonist, n (%) | 0 (0) | 0 (0) | 1 | 0 (0) | 0 (0) | 1 | 0 (0) | 0 (0) | 1 |
| Sulphonylurea, n (%) | 125 (36.4) | 127 (37.0) | 0.94 | 33 (12.2) | 51 (18.8) | 0.043 | 51 (25.5) | 44 (22.0) | 0.48 |
| Thiazolidinediones, n (%) | 25 (7.3) | 30 (8.8) | 0.57 | 6 (2.2) | 25 (9.3) | <0.001 | 11 (5.5) | 3 (1.5) | 0.053 |
| Region | 0.006 | <0.001 | 0.08 | ||||||
| North America, n (%) | 30 (8.8) | 46 (13.4) | 8 (3.0) | 29 (10.7) | 18 (9.0) | 7 (3.5) | |||
| Eastern Europe, n (%) | 115 (33.5) | 125 (36.4) | 95 (35.1) | 71 (26.2) | 71 (35.5) | 88 (44.0) | |||
| Southern Europe, n (%) | 129 (37.6) | 87 (25.4) | 86 (31.7) | 49 (18.1) | 76 (38.0) | 78 (39.4) | |||
| Northern Europe, n (%) | 52 (15.2) | 61 (17.8) | 20 (7.4) | 41 (15.1) | 20 (10.0) | 20 (10.0) | |||
| Japan, n (%) | 17 (5.0) | 24 (7.0) | 62 (22.9) | 81 (29.9) | 15 (7.5) | 7 (3.5) | |||
Mean (s.d.) unless otherwise stated.
Table 3.
Comparisons for insulin dose and outcomes for the larger propensity matched groups
| Basal versus premix | Basal + mealtime versus premix | Basal versus basal + mealtime | |||||||
|---|---|---|---|---|---|---|---|---|---|
| Basal | Premix | p | Basal + mealtime | Premix | p | Basal | Basal + mealtime | p | |
| n | 343 | 343 | 271 | 271 | 200 | 200 | |||
| Insulin dose, U/day | 30 [18, 46] | 39 [26, 52] | <0.001 | 40 [25,56] | 34 [21, 50] | 0.006 | 30 [20, 44] | 46 [32, 61] | <0.001 |
| Number of injections | 2 [1, 2] | 2 [2, 2] | 0.003 | 4 [3, 4] | 2 [2, 2] | <0.001 | 2 [1, 2] | 4 [4, 4] | <0.001 |
| Final insulin regimen, n (%) | |||||||||
| Basal | 252 (73.5) | 16 (4.7) | 33 (12.2) | 8 (3.0) | 141 (70.5) | 24 (12.0) | |||
| Basal + mealtime | 46 (13.4) | 23 (6.7) | 188 (69.4) | 16 (5.9) | 29 (14.5) | 160 (80.0)b | |||
| None | 5 (1.5) | 8 (2.3) | 15 (5.5) | 4 (1.5) | 2 (1.0) | 4 (2.0) | |||
| Premix | 40 (11.7) | 296 (86.3)a | 31 (11.4) | 242 (89.3)a | 27 (13.5) | 11 (5.5) | |||
| Short-acting | 0 (0) | 0 (0) | 4 (1.5) | 1 (0.4) | 1 (0.5) | 1 (0.5) | |||
| HbA1c, change (% units) | –1.7 (2.0) | –1.8 [2.0] | –2.5 (2.4) | –2.2 (2.2) | –1.8 (2.3) | –2.1 (2.3) | |||
| difference (95% CI) | –0.0 (–0.2, 0.2] | 0.99 | –0.2 (–0.5, 0.10) | 0.19 | 0.1 (–0.2, 0.4) | 0.68 | |||
| Body weight change, kg | 1.2 (4.5) | 2.3 (4.9) | 2.2 (5.4) | 2.7 (4.9) | 1.5 (4.7) | 2.7 (5.5) | |||
| difference (95% CI) | –1.3 (–2.1, –0.6) | <0.001 | –0.1 (–1.2, 0.9) | 0.78 | –1.4 (–2.5, –0.3) | 0.016 | |||
| Hypoglycaemia | |||||||||
| All, events/patient-years | 2.3 (9.0) | 3.0 (10.0) | 1.8 (4.9) | 3.2 (10.5) | 1.7 (5.5) | 1.7 (4.8) | |||
| RR (95% CI) | 0.7 (0.6, 0.9) | <0.001 | 0.6 (0.5, 0.8) | <0.001 | 1.3 (0.9, 1.7) | 0.14 | |||
| Nocturnal, events/patient years | 0.5 (1.8) | 0.8 (4.2) | 0.2 (1.1) | 0.6 (3.9) | 0.5 (1.7) | 0.3 (1.2) | |||
| RR (95% CI) | 0.6 (0.5, 0.9) | 0.010 | 0.3 (0.2, 0.6] | <0.001 | 2.0 (1.1, 3.5) | 0.021 | |||
Data for insulin dose and number of injections are median [IQ range]; others are mean (s.d.), or as stated.
Difference in subjects remaining on initial insulin regimen: ap < 0.001; bp = 0.034.
There was no difference in the fall of HbA1c over 1 year between these insulins (Table 3), accounting for baseline HbA1c and investigational sites as random effects. Weight gain was 1.3 kg greater with premix, whereas there were fewer overall and nocturnal hypoglycaemic episodes among those treated with basal insulin (Table 3). There was no difference on any criterion using tighter matching criteria (0.001), but only 155 people were included in each insulin regimen group after propensity score matching.
Basal + Mealtime versus Premix
A match was achieved for 271 people starting basal + mealtime with 271 starting premix insulin (Table 2). In general, the two treatment groups were well matched, but there were some residual differences in age and duration of diabetes, while again fewer people from Southern Europe were treated with premix (18%) (Table 2). Final insulin regimen showed some evolution towards basal alone and premix in those starting basal + mealtime insulin, but was more stable (p < 0.001) on those starting premix (Table 3). Use of premix insulin was associated with a lower insulin dose and fewer injections than with the multiple injection regimen (Table 3).
There was no difference in the fall of HbA1c or change in body weight over 1 year between these two insulin regimens (Table 3). However, there were fewer overall and nocturnal hypoglycaemic episodes among those treated with basal + mealtime insulins (both p < 0.001, Table 3). At the tighter level of matching, there were no statistically significant differences in outcomes for the 79 people per treatment group.
Basal versus Basal + Mealtime
A match was achieved for 200 people starting basal insulin with 200 starting basal + mealtime insulin (Table 2). In general, the groups were well matched, but there were some residual differences in age, duration of diabetes, body weight and BMI. The final insulin regimen at 1 year showed some evolution towards basal + mealtime and premix in those starting on basal insulin, and towards basal alone (12%) in those starting on a multiple injection regimen (overall change between insulins p = 0.034) (Table 3). Use of basal insulin was associated with a lower insulin dose and fewer injections than with basal + mealtime (Table 3).
There was no difference in the fall of HbA1c over 1 year between these two insulin regimens (Table 3). Despite the higher baseline weight for the basal + mealtime regimen, there was more weight gain (1.4 kg). While there was no difference in overall hypoglycaemic episodes, the relative risk of nocturnal episodes was lower on the basal + mealtime regimen (p = 0.021) (Table 3). At the tighter level of matching (0.001), there were only 67 people in each group. Similar results were found except for a lack of difference in weight gain between the two groups.
Comparisons of Mealtime-Only Insulin to Other Insulins
For the three propensity score-matched cohorts involving mealtime insulin alone, numbers were smaller: 244 in the premix group (122 in each), 214 for basal + mealtime and 154 for basal alone (Table 4). While matching was generally good, there were some regional differences, and imbalances in baseline HbA1c, varying from 6 mmol/mol (0.5 %) versus premix to 9 mmol/mol (0.8 %) versus basal. Thus, while HbA1c (baseline adjusted) appeared to fall more with both premix and basal than mealtime insulin regimens, this may reflect the lower starting levels on mealtime alone (Table 5). Numerically, overall hypoglycaemia was less frequent on mealtime alone than on premix or the multiple injection regimen, as was nocturnal hypoglycaemia compared to premix. Body weight changes did not differ (Table 5). With already lower numbers in these three comparisons involving mealtime insulin alone, tighter matching reduced these further and removed comparative differences in outcomes.
Table 4.
Baseline characteristics of the smaller propensity matched groups
| Premix versus mealtime | Basal + mealtime versus mealtime | Basal versus mealtime | |||||||
|---|---|---|---|---|---|---|---|---|---|
| Premix | Mealtime | p | Basal + mealtime | Mealtime | p | Basal | Mealtime | p | |
| n | 122 | 122 | 107 | 107 | 77 | 77 | |||
| Age, years | 61.8 (10.6) | 62.6 (8.7) | 0.53 | 60.9 (11.1) | 62.4 (8.8) | 0.29 | 60.7 (10.0) | 62.4 (9.1) | 0.28 |
| Diabetes duration, years | 11.8 (7.7) | 11.0 (7.8) | 0.41 | 10.6 (8.0) | 10.4 (7.9) | 0.84 | 11.2 (6.7) | 11.6 (8.6) | 0.74 |
| Female, n (%) | 49 (40.2) | 47 (38.5) | 0.90 | 50 (46.7) | 35 (32.7) | 0.050 | 36 (46.8) | 35 (45.5) | 1 |
| Body weight, kg | 73.4 (17.8) | 70.4 (17.7) | 0.19 | 70.8 (18.9) | 67.0 (16.5) | 0.11 | 77.8 (17.2) | 76.3 (18.5) | 0.60 |
| BMI, kg/m2 | 27.0 (5.6) | 26.2 (5.4) | 0.22 | 26.4 (6.1) | 25.0 (4.9) | 0.068 | 28.2 (5.4) | 27.9 (5.7) | 0.79 |
| HbA1c, % | 9.8 (1.8) | 9.3 (1.9) | 0.031 | 10.2 (2.2) | 9.5 (1.9) | 0.009 | 9.3 (2.0) | 8.5 (1.5) | 0.003 |
| mmol/mol | 84 (20) | 78 (21) | 88 (24) | 80 (21) | 78 (22) | 69 (17) | |||
| Prescriptions, n | 9.8 (2.5) | 10.4 (1.8) | 0.029 | 10.0 (2.4) | 10.3 (1.5) | 0.27 | 9.7 (2.7) | 10.4 (2.1) | 0.061 |
| α-Glucosidase inhibitor, n (%) | 14 (11.5) | 11 (9.0) | 0.67 | 6 (5.6) | 9 (8.4) | 0.59 | 4 (5.2) | 9 (11.7) | 0.25 |
| Biguanide, n (%) | 39 (32.0) | 42 (34.4) | 0.79 | 15 (14.0) | 23 (21.5) | 0.21 | 35 (45.5) | 41 (53.3) | 0.42 |
| DPP-4 inhibitor, n (%) | 0 (0%) | 0 (0%) | 1 | 0 (0) | 0 (0) | 1 | 0 (0) | 0 (0) | 1 |
| Glinides, n (%) | 3 (2.5) | 6 (4.9) | 0.50 | 1 (0.9) | 1 (0.9) | 1 | 4 (5.2) | 7 (9.1) | 0.53 |
| GLP-1 receptor agonist, n (%) | 0 (0%) | 0 (0%) | 1 | 0 (0) | 0 (0) | 1 | 0 (0) | 0 (0) | 1 |
| Sulphonylurea, n (%) | 26 (21.3) | 28 (23.0) | 0.88 | 6 (5.6) | 14 (13.1) | 0.098 | 23 (29.9) | 24 (31.2) | 1 |
| Thiazolidinediones, n (%) | 8 (6.6) | 11 (9.0) | 0.63 | 3 (2.8) | 5 (4.7) | 0.72 | 8 (10.4) | 8 (10.4) | 1 |
| Region | 0.002 | 0.040 | 0.28 | ||||||
| North America, n (%) | 8 (6.6) | 5 (4.1) | 2 (1.9) | 3 (2.8) | 3 (3.9) | 5 (6.5) | |||
| Eastern Europe, n (%) | 26 (21.3) | 11 (9.0) | 21 (19.6) | 9 (8.4) | 21 (27.3) | 11 (14.3) | |||
| Southern Europe, n (%) | 14 (11.4) | 32 (26.2) | 17 (15.9) | 25 (23.4) | 28 (36.4) | 33 (42.9) | |||
| Northern Europe, n (%) | 16 (13.1) | 12 (9.8) | 8 (7.5 | 3 (2.8) | 14 (18.2) | 12 (15.6) | |||
| Japan, n (%) | 58 (47.5) | 62 (50.8) | 59 (55.1) | 67 (62.6) | 11 (14.3) | 16 (20.8) | |||
Mean (s.d.), unless otherwise stated.
Table 5.
Comparisons for insulin dose and outcomes for the smaller propensity matched groups
| Premix versus mealtime | Basal + mealtime versus mealtime | Basal versus mealtime | |||||||
|---|---|---|---|---|---|---|---|---|---|
| Premix | Mealtime | p | Basal + mealtime | Mealtime | p | Basal | Mealtime | p | |
| n | 122 | 122 | 107 | 107 | 77 | 77 | |||
| Insulin dose, U/day | 30 [18,50] | 24 [14, 36] | 0.004 | 22 [13, 33] | 27 [19, 44] | 0.005 | 23 [16, 39] | 27 [16, 40] | 0.95 |
| Number of injections | 2 [2, 2] | 3 [2, 4] | <0.001 | 4 [2, 4] | 3 [2, 4] | 0.42 | 1 [1, 2] | 3 [2, 4] | <0.001 |
| Final insulin regimen, n (%) | |||||||||
| Basal | 2 (1.6) | 5 (4.1) | 13 (12.2) | 4 (3.7) | 58 (75.5)a | 3 (3.9) | |||
| Basal + mealtime | 4 (3.3) | 36 (29.5) | 58 (54.2)b | 30 (28.0) | 11 (14.3) | 29 (37.7) | |||
| None | 1 (0.8) | 7 (5.7) | 8 (7.5) | 4 (3.7) | 1 (1.3) | 3 (3.9) | |||
| Premix | 115 (94.3)a | 30 (24.6) | 25 (23.4) | 29 (27.1) | 6 (7.8) | 10 (13.0) | |||
| Short-acting | 0 (0) | 44 (36.1) | 3 (2.8) | 40 (37.4) | 1 (1.3) | 32 (41.6) | |||
| HbA1c, change (% units) | –2.2 (2.1) | –2.1 (2.1) | –2.8 (2.5) | –2.3 (2.1) | –1.5 (1.9) | –1.3 (1.9) | |||
| difference (95% CI) | 0.4 (0.05, 0.7) | 0.025 | 0.2 (–0.2, 0.6) | 0.25 | 0.6 (0.2, 1.0) | 0.008 | |||
| Body weight change, kg | 2.0 (4.7) | 1.2 (5.6) | 1.6 (5.1) | 1.6 (5.9) | 0.7 (3.6) | 1.1 (5.9) | |||
| difference (95% CI) | 0.9 (–0.4, 2.3) | 0.17 | 0.4 (–1.2, 2.0) | 0.63 | –0.3 (–1.9, 1.3) | 0.74 | |||
| Hypoglycaemia | |||||||||
| All (events/patient-years) | 3.2 (12.4) | 1.5 (3.7) | 3.0 (10.2) | 1.4 (3.6) | 0.3 (0.9) | 0.3 (1.1) | |||
| RR (95% CI) | 2.1 (1.3, 3.4) | 0.002 | 3.3 (2.3, 4.8) | <0.001 | 1.2 (0.7, 2.0) | 0.50 | |||
| Nocturnal (events/patient-years) | 0.4 (2.0) | 0.1 (0.9) | 0.1 (0.5) | 0.1 (0.9) | 0.1 (0.4) | 0.1 (0.6) | 1.0 | ||
| RR (95% CI) | 3.2 (1.3, 7.5) | 0.009 | 0.8 (0.3, 2.8) | 0.76 | 1.0 (0.3, 3.0) | ||||
Data for insulin dose and number of injections are median [IQ range]; others are mean (s.d.), or as stated. Difference in subjects remaining on initial insulin regimen: ap < 0.001; bp = 0.025.
Discussion
We developed propensity score-matched comparisons of patients with a similar observed likelihood of being treated with a particular insulin regimen, comparing those patients who commenced that strategy against those with similar characteristics who commenced the regimen being compared. Analogous to the unbiased approach used in randomized trials, we adopted the intention to treat principle in which we compared strategies of treatment, allowing patients to change therapy based upon their clinical need during follow-up in the study.
In the CREDIT study, blood glucose control in this group of well-resourced countries was disappointingly poor at the time of starting insulin (Table 1), but consistent with reports from primary health care in the UK 7,8, and with global data from less well-resourced countries 9. The improvement in blood glucose control at 1 year in terms of HbA1c, FPG and PPPG was clinically useful. However, because of high baseline levels a minority of those studied attained a satisfactory HbA1c of 7.0 %. This again seems to reflect problems in diabetes care in routine practice, for dose titration over 1 year was only to some 36 U/day, while overall 75% of people remained on their initial insulin regimen. The problem cannot be attributed to hypoglycaemia, which in the last 6 months was experienced by only 20% of those studied (and only 2% experienced severe hypoglycaemia). Body weight gain of less than 2 kg on average would also not seem to be an explanation. It appears that barriers to starting insulin therapy might not be eliminated even after it has been begun 10,11.
In randomized controlled trials, usually of specific insulin types or regimens, larger reductions in HbA1c have been reported from baseline levels which bracket those reported here 12,13. However in those studies, active insulin dose titration was used, and the achieved insulin doses for some regimens were more than double those found here, with more weight gain and hypoglycaemia. Where people had better baseline levels, as in the UK multicentre 4 T study 4, falls in HbA1c were less with any regimen, but glucose was better controlled at 12 months and with a similar increment in insulin dose to our study. Taken together it appears that in routine clinical practice, such as in the centres studied here, results as good as in the RCTs were obtained. However, the opportunity for better performance by starting at more respectable HbA1c levels, and by titration of doses and regimens if good control was not obtained, was missed. Similar conclusions were reached in a shorter (24 weeks) observational study in a broader cohort of less well-resourced countries 9. In that study, however, the lack of body weight gain and paucity of hypoglycaemia were attributed to educational initiatives being implemented at the same time insulin was started.
In general, in observational studies it is not appropriate to make statistical comparisons of different therapies because of confounding factors in their use. These can for example be regular parts of clinical practice (e.g. metformin is started in different circumstances from thiazolidinediones), differing clinical habits in different countries (e.g. use of basal or premix insulin most commonly) or more subtle effects (choice of insulin regimen for people started on insulin as in-patients in the context of other illness). Here, by including a range of baseline diabetes and risk measures we have defined propensity-matched sets between pairs of insulin types/regimens, but can only validate this matching by comparison of those same characteristics. Not surprisingly, we failed to achieve a satisfactory match for some pairs of treatments, suggesting the insulins were being used in quite different circumstances, but this occurred in general where best possible pair matching resulted in fewer pairs, again as might be expected. Although we included measures of baseline frailty, in particular age, treatment for CV disease and body mass, it is useful to consider the likely direction of a bias should unexplained patient frailty lead to a systematic difference in the selection of diabetes regimen. It seems likely that such a bias revealed in patients initiating insulin would be expressed as a tendency to subject frailer patients to less intrusive regimens. Thus we might anticipate that any bias would be against basal insulin. Nevertheless, apparently valid comparisons were obtained for basal versus premix, basal versus multiple injection therapy and mealtime alone versus premix. While some mismatch occurred for the first for region, this was largely for southern Europe and then only by 13% of the total population. The effect disappeared with tighter matching, without affecting conclusions, but this meant a much smaller test population with lower statistical power.
The finding of similar glucose control (as HbA1c) with basal and premix insulin, despite lower insulin dose, differs from the 4 T study at 1 year where insulin detemir did less well than analogue premix despite similar dose titration 4. However, in our study we were not aware of the mix of different basal and premix insulins, human or analogue, or type/manufacturer. More consistent, however, is the finding that there was less hypoglycaemia, in particular nocturnal hypoglycaemia, and less weight gain, with the basal insulin than premix 4,12. When basal insulin was compared with a basal + mealtime regimen there was also no difference in HbA1c despite lower insulin dose. However, the short-acting insulin in this regimen is then associated with more weight gain, although still not clinically large (mean 1.4 kg making 2.7 kg in all). Overall hypoglycaemia did not differ, but nocturnal hypoglycaemia, though low in frequency, was more frequent with basal insulin, perhaps indicating that in some individuals pushing the dose too hard when short-acting insulin is required can give problems at night. These data are consistent with that of the basal + mealtime versus premix comparison, where HbA1c and body weight change did not differ despite higher dose with the multiple injection regimen, but hypoglycaemia remained less frequent.
The mealtime insulin alone comparisons are more troublesome, owing to smaller paired groups for our primary outcome variable of interest, HbA1c. As a result the greater drops in HbA1c in two of the comparisons may simply have been due to higher starting levels or to residual confounders in the datasets. In these circumstances it is probably unwise to conclude anything about the apparent differences in relative risk of hypoglycaemia.
Our study has limitations. Lack of the strict site monitoring that usually occurs in RCTs may have resulted in missed or inaccurate information, for example of hypoglycaemia where recall is known to be a problem. Although non-interventional and with retrospective entry of baseline data, we cannot exclude the possibility that investigators started insulin on occasion in the knowledge that the patient could be entered into the study. Nevertheless, clearly the baseline HbA1c level shows that insulin was indicated in the overwhelming majority. The grouping of insulins into categories which implies that both human and anologue insulins may be included in the same category enables adequate numbers of subject in each insulin per group, and was also required by regulatory bodies. However this approach may obfuscate benefits of a specific regimen as part of an ‘average’ effect with a less successful insulin. While the propensity analysis is a powerful tool for pair matching groups to remove possible hidden confounders in the data, by its very nature it is not possible to validate fully the success of this analysis. Furthermore it is clear from the smaller ill-matched groups that such confounders do exist in the original dataset, confirming our caution in not comparing insulins without propensity pair-matching, and providing support for the approach we have taken over others that involve attempting statistical adjustment for difference in patient characteristics (which would have compared patients who did not share characteristics in our excluded analyses). A strength and limitation of the propensity score approach is that it constrains comparisons to subjects with a similar likelihood of receiving a treatment based upon their observed characteristics. This means that the number of subjects actually included in matched comparisons is smaller than that available. While ensuring that we do not compare unalike patients, based upon the observed characteristic that they have equal likelihood to be treated with the either regimen, the consequence is that subjects are discarded where they do not share an equal likelihood of either treatment option. The propensity score approach may thus in our setting be considered to provide a good basis for comparison between the treatments but only for those subjects for whom there exists a similar likelihood to receive either therapy.
In conclusion, insulin therapy delivers in routine clinical practice the gains described from RCTs, and without major problems of hypoglycaemia (except in a small minority) and without large amounts of weight gain. Basal insulin at 1 year outperforms premix insulin in terms of weight gain and hypoglycaemia, although the differences are not large. A more complex mealtime + basal regimen gives uncertain advantage in glucose control, but with extra weight gain. Persistence of use of mealtime insulin alone is poor. In routine clinical practice insulin is still started late, and dose titration often remains inadequate.
Acknowledgments
We thank all the participants who allowed their data to be used for this study, and the study site investigators who collated and collected it. The study was sponsored by Sanofi. Editorial support was provided by Tom Claus, PhD, of PPSI (a PAREXEL Co.) and funded by Sanofi. Sanofi is a manufacturer of basal and mealtime insulins.
Conflict of Interest
N. F. contributed to the study design, study conduct/data collection, data analysis, and writing of the manuscript. B. B. contributed to the study design, study conduct /data collection, data analysis and critically re-reading the manuscript. P. H. contributed to study design, study conduct/data collection, data analysis and writing of the manuscript.
N. F. has received funding for research, educational activities, travel and consulting from Sanofi, Novo Nordisk and Medtronic Inc. B. B. has served as a consultant for Bristol-Myers Squibb, Eli Lilly and Sanofi. Philip Home, either personally or through institutions with which he is associated, receives funding for research, advisory, and educational activities from most insulin and oral-agent manufacturers, including Sanofi.
References
- 1.IDF Clinical Guidelines Task Force. Global guideline for type 2 diabetes: recommendations for standard, comprehensive, and minimal care. Diabet Med. 2006;23:579–593. doi: 10.1111/j.1464-5491.2006.01918.x. [DOI] [PubMed] [Google Scholar]
- 2.Inzucchi SE, Bergenstal RM, Buse JB, et al. Management of hyperglycemia in type 2 diabetes: a patient-centered approach: Position Statement of the American Diabetes Association (ADA) and the European Association for the Study of Diabetes (EASD) Diabetes Care. 2012;35:1364–1379. doi: 10.2337/dc12-0413. [DOI] [PMC free article] [PubMed] [Google Scholar]
- 3.Rodbard HW, Blonde L, Braithwaite SS, et al. American Association of Clinical Endocrinologists medical guidelines for clinical practice for the management of diabetes mellitus. Endocr Pract. 2007;13(1):1–68. doi: 10.4158/EP.13.S1.1. [DOI] [PubMed] [Google Scholar]
- 4.Holman RR, Thorne KI, Farmer AJ, et al. Addition of biphasic, prandial, or basal insulin to oral therapy in type 2 diabetes. N Engl J Med. 2007;357:1716–1730. doi: 10.1056/NEJMoa075392. [DOI] [PubMed] [Google Scholar]
- 5.Rosenbaum PR, Rubin DB. The central role of the propensity score in observational studies for causal effects. Biometrika. 1983;70:41–55. [Google Scholar]
- 6.Freemantle N, Balkau B, Danchin N, et al. Factors influencing initial choice of insulin therapy in a large international non-interventional study of people with type 2 diabetes. Diabetes Obes Metab. 2012;14:901–909. doi: 10.1111/j.1463-1326.2012.01613.x. [DOI] [PMC free article] [PubMed] [Google Scholar]
- 7.Sharplin P, Gordon J, Peters JR, Tetlow AP, Longman AJ, McEwan P. Switching from premixed insulin to glargine-based insulin regimen improves glycaemic control in patients with type 1 or type 2 diabetes: a retrospective primary-care-based analysis. Cardiovasc Diabetol. 2009;8:9. doi: 10.1186/1475-2840-8-9. [DOI] [PMC free article] [PubMed] [Google Scholar]
- 8.Sharplin P, Gordon J, Peters JR, Tetlow AP, Longman AJ, McEwan P. Improved glycaemic control by switching from insulin NPH to insulin glargine: a retrospective observational study. Cardiovasc Diabetol. 2009;8:3. doi: 10.1186/1475-2840-8-3. [DOI] [PMC free article] [PubMed] [Google Scholar]
- 9.Home P, Naggar NE, Khamseh M, et al. An observational non-interventional study of people with diabetes beginning or changed to insulin analogue therapy in non-Western countries: the A1chieve study. Diabetes Res Clin Pract. 2011;94:352–363. doi: 10.1016/j.diabres.2011.10.021. [DOI] [PubMed] [Google Scholar]
- 10.Karter AJ, Subramanian U, Saha C, et al. Barriers to insulin initiation: the translating research into action for diabetes insulin starts project. Diabetes Care. 2010;33:733–735. doi: 10.2337/dc09-1184. [DOI] [PMC free article] [PubMed] [Google Scholar]
- 11.Peyrot M, Rubin RR, Lauritzen T, et al. Resistance to insulin therapy among patients and providers: results of the cross-national Diabetes Attitudes, Wishes, and Needs (DAWN) study. Diabetes Care. 2005;28:2673–2679. doi: 10.2337/diacare.28.11.2673. [DOI] [PubMed] [Google Scholar]
- 12.Raskin P, Allen E, Hollander P, et al. Initiating insulin therapy in type 2 diabetes: a comparison of biphasic and basal insulin analogs. Diabetes Care. 2005;28:260–265. doi: 10.2337/diacare.28.2.260. [DOI] [PubMed] [Google Scholar]
- 13.Yki-Jarvinen H, Kauppinen-Makelin R, Tiikkainen M, et al. Insulin glargine or NPH combined with metformin in type 2 diabetes: the LANMET study. Diabetologia. 2006;49:442–451. doi: 10.1007/s00125-005-0132-0. [DOI] [PubMed] [Google Scholar]