Abstract
Although inhibition of p16INK4a expression is critical to preserve the proliferative capacity of stem cells, the molecular mechanisms responsible for silencing p16INK4a expression remain poorly characterized. Here, we show that the histone acetyltransferase (HAT) monocytic leukemia zinc finger protein (MOZ) controls the proliferation of both hematopoietic and neural stem cells by modulating the transcriptional repression of p16INK4a. In the absence of the HAT activity of MOZ, expression of p16INK4a is upregulated in progenitor and stem cells, inducing an early entrance into replicative senescence. Genetic deletion of p16INK4a reverses the proliferative defect in both MozHAT−/− hematopoietic and neural progenitors. Our results suggest a critical requirement for MOZ HAT activity to silence p16INK4a expression and to protect stem cells from early entrance into replicative senescence.
Keywords: Hematopoietic stem cell, Neural stem cells, Epigenetics, Histone acetylation, MOZ, Senescence
Introduction
Self-renewal of stem cells is vital for maintaining tissues homeostasis throughout the life span of an organism. Because of their high-mitotic activity, stem cells have to put in place inherent cellular defense mechanisms, such as senescence and apoptosis, to avoid the expansion of potentially malignant cells resulting from the accumulation of oncogenic mutations. Cells undergoing senescence display dramatic changes in chromatin structure, which contribute to the irreversible nature of the senescent state. These changes are regulated by the activities of chromatin modifying enzymes; however, the nature of these specific enzymes and their role in the control of senescence remains mostly unknown.
The histone acetyltranferase monocytic leukemia zinc finger protein (MOZ; MYST3 or KAT6A) is a key regulator of hematopoiesis recurrently found translocated in acute myeloid leukemia 1–5. Both MOZ null mouse embryos and mice carrying a G657E mutation, which renders the protein catalytically inactive (MozHAT−/− hereafter), have severe defects in the generation and maintenance of hematopoietic stem cells (HSCs) 6–8. In the absence of MOZ histone acetyltransferase (HAT) activity, the proliferative capacity of hematopoietic progenitors is dramatically impaired, with many cells withdrawing from the cell cycle during the G1 phase 8.
In this study, we establish that the proliferative defect observed in the absence of the HAT activity of MOZ is not limited to the hematopoietic compartment, but also extends to neural stem cells and progenitors (NSC/Ps). We show that this proliferative defect is caused by the upregulation of p16INK4a expression leading to a premature entry into replicative senescence and that the senescent phenotype can be rescued by genetic deletion of p16INK4a. We further demonstrate that MOZ binds directly to the promoter of p16INK4a indicating that this tumor suppressor is a direct target of MOZ. Our findings suggest that these two stem cell types, HSCs and NSCs, use the same novel mechanism involving MOZ-driven acetylation to maintain their capacity to proliferate and avoid senescence. Altogether, these results provide new insights into the control of stem and progenitor cell proliferation and identify an unexpected role of MOZ-mediated acetylation in the regulation of p16INK4a expression. This finding also suggests that a potential reinforcement of the repressive activity of MOZ on p16INK4a expression could be an important mechanism supporting the development of acute myeloid leukemia following MOZ translocations.
Materials and Methods
Cell Culture and Growth Curves
Differentiation of embryonic stem cells (ESCs) into embryoid bodies (EBs) was carried out as described previously 8,9. Serum-free conditions that sustain the proliferation of hematopoietic precursors in liquid culture were described previously 10. For neurospheres culture, we used the “NeuroCult Proliferation Kit” (Stem Cell Technologies, www.stemcell.com). To test the self-renewal capacity of neurospheres, cells were isolated from primary spheres using a NeuroCult Chemical Dissociation Kit (Stem Cell Technologies, www.stemcell.com). Self-renewal was quantified as number of secondary neurospheres generated per primary neurosphere. For proliferation studies, 10 µM 5-bromo-2-deoxyuridine (BrdU) was added to the cultures for 12 hours at 37°C.
Expression Analysis
Total RNA was extracted with an RNAeasy kit, treated with RNAse-free DNase (QIAGEN, www.qiagen.com), and reverse-transcribed into cDNA with random hexamers by use of an Omniscript RT kit (QIAGEN, www.qiagen.com). Real-time polymerase chain reaction (PCR) was performed on an ABI 7900 system (Applied Biosystems, www.lifetechnologies.com) using the Exiqon universal probe library and primer designer (Roche, www.roche.com). All expression data were calculated relative to β-actin as 2−Δct. Data are presented as ΔCt values from triplicates normalized to β-actin. Primer sequences are available upon request.
Flow Cytometry
EBs were trypsinized (TryplE; Life technologies, www.lifetechnologies.com) for 3 minutes. Bone marrow of transplanted NOD Scid Gamma NSG mice was isolated by flushing the femurs with phosphate-buffered saline containing 2% fetal bovine serum. Single-cell suspensions were analyzed on a FACScan or a FACScalibur flow cytometer (Becton Dickinson, www.bd.com) or sorted on a FACS Vantage cell sorter (Becton Dickinson). The antibodies used were as follows: Mac1 (biotinylated), Sca-1 labelled with fluorescein isothiocyanate (FITC), and c-Kit (APC) were used for the HSC analysis; For the isolation of Lin−cKit− or CD45.2+Lin−cKit+ population from bone marrow, we used CD45.2 (Biotin) and cKit labelled with allophycocyanin (APC) antibody together with a mix of antibodies recognizing lineage specific antigens Gr1, Mac1, B220, CD3, and Ter119 (PE). Staining with CD34 (Biotin) and cKit (APC) was performed to isolate hematopoietic progenitors from day 6 EBs. For the isolation of HSCs, we also included a combination of antibodies recognizing members of the SLAM markers CD150 (PE), CD48 (APC), and CD224.2 (FITC). All the antibodies were from BD Pharmingen or ebiosciences. For cell cycle analysis, BrdU incorporation (BrdU Flow kit, BD Pharmingen, www.bdbiosciences.com) was performed according to the manufacturer's instructions.
Senescence Analysis
Senescence associated β-galactosidase (SA β-gal) assay was performed using a senescence β-galactosidase staining kit (Cell Signaling, www.cellsingal.com).
Fetal Liver Transplantation and 5FU Treatment
NSG recipients (CD45.1) of 8- to 12-week-old were lethally irradiated with 250cGy in two doses of 125 cGy 3 hours apart and injected with donor (CD45.2) fetal liver cells. To determine the repopulating level of donor cells, peripheral blood was collected and stained with anti-CD45.1 and anti-CD45.2. For analysis of HSC proliferation in vivo, wild type (Wt) and MOZHAT−/− mice were intravenously administered 5-fluorouracil (5FU; Mayne Pharma PLC, Warwick, UK) at a single dose of 150 mg/kg body weight. Six days after 5-FU treatment, bone marrow cells were isolated and analyzed for p16INK4a expression by immunostaining. Sorted 6-day 5FU cells were grown in liquid culture in round-bottom microtiter plates (10 cells per well). After 10 days of incubation, cell number per well was scored using an inverted light microscope.
Competitive Repopulation Assays
Experimental conditions for this assay were published previously 11. Repopulating units (RUs) from each donor were calculated according to the method described by Harrison and Astle 12, where numbers of RUs are calculated from the percentage donor cells. In brief, the calculations are based in the formula RU = %(C)/(100 − %), where the number of fresh competitor marrow cells used per 105 equals C and percentage corresponds to the obtained percentage of donor cells.
Transgenic Mice and Embryo Generation
All animal work was performed under regulations governed by the Home Office Legislation under the Animal Scientific Procedures Act of 1986. Ink4a+/− mice were obtained from Dr. O. Samson with the consent of Dr. M. Serrano.
ChIP Assays
Chromatin immunoprecipitation was performed using the Red ChIP Kit (Diagenode, www.diagenode.com) following the instructions of the manufacturer. Crosslinked cells were sonicated for 15 cycles (30s on/30s off) with the Bioruptor (Diagenode, www.diagenode.com). Antibodies used were RNA Polymerase (H-224 from Santa Cruz Biotechnology, www.scbt.com) and anti-HAT MYST3 antibody (Ab41718 from Abcam, www.abcam.com). Ten million cells were used for each immunoprecipitation with the anti-Moz antibody. Eluted chromatin was quantified by qualitative PCR (qPCR). Data for ChIP were obtained by subtracting IgG control values to the corresponding antibody values. Graphs represent fold increase over control IgG.
Immunoblotting and Immunocytochemistry
To analyze protein expression levels, cells were solubilized in Radio-Immunoprecipitation Assay (RIPA) lysis buffer containing a cocktail of protease inhibitors (Sigma Aldrich). Electrophoresis was carried out using commercial reagents (Novex; Life Technologies, www.lifetechnologies.com). For immunoblot, proteins were transferred to a nitrocellulose membrane using the iBlot gel transfer apparatus (Life Technologies, www.lifetechnologies.com). Nonspecific binding was blocked by incubation in blocking buffer; Tris-buffered saline (TBST; 0.1% Tween-20) containing 5% skimmed milk. After incubation with the corresponding secondary antibodies, signal was developed using the Enhanced Chemiluminescence Plus kit (ECL-Plus kit; GE-Healthcare Bio-Sciences, www.gelifesciences.com). For p16INK4a and HP1-γ immunostainings cells were cytocentrifuged, fixed and stained with the corresponding antibody. Antibodies used were HP1-γ (07332 from Millipore, www.millipore.com) and p16INK4a (M-156 from Santa Cruz Biotechnologies, www.scbt.com)
Statistics
Statistical comparisons of data sets were performed with the two-tailed Student's test.
Results
HSC/Ps Undergo Early Entrance into Replicative Senescence in the Absence of MOZ HAT Activity
We established previously that HSCs and blood precursors carrying the mutated G657E MOZ protein lacking HAT activity have a profound proliferative deficiency, with many cells arresting in the G1 phase of the cell cycle 8. A cell leaving the cell cycle during the G1 phase may encounter different fates: it can differentiate, become quiescent, senescent, or undergo apoptosis. No signs of increased apoptosis or defects in differentiation were observed in MozHAT−/− hematopoietic progenitors 8 suggesting quiescence or senescence as the most likely fates. Therefore, we evaluated whether the reported G1 arrest previously observed in MozHAT−/− CD34+cKit+ hematopoietic progenitors is related to the acquisition of a senescent phenotype. Consistent with this hypothesis, a higher frequency of cells positive for the presence of senescence-associated heterochromatin foci (SAHF) 13, marking the accumulation of the nuclear Heterochromatin Protein 1-gamma (HP1γ) protein was detected in MozHAT−/− CD34+cKit+ hematopoietic progenitors generated by in vitro ESC differentiation than in their Wt counterparts (Fig. 1A). A significantly higher percentage of the hematopoietic progenitors also expressed the senescence-associated β-galactosidase (SA β-gal) in the absence of the HAT activity of MOZ (Fig. 1B). The progression through the G1 phase of the cell cycle in stem cells has been shown to be controlled by different cyclin-dependent kinase (CDK) inhibitors, such as p16(INK4a) 14–16, p21(CIP1) 16–20, p27 (Kip1) 21,22, and p57(Kip2) 23,24. We analyzed the transcription levels of these CDK inhibitors to evaluate whether changes in their expression could be linked to the observed phenotype in MozHAT−/− hematopoietic progenitors. Only transcriptional levels of the tumor suppressor p16INK4a were significantly altered in MozHAT−/− cells (Fig. 1C). To further investigate whether this upregulation of p16INK4a was reflecting changes in the transcription levels of known regulators of this tumor suppressor, such as Bmi1 15,25, Ezh1 26, Ezh2 27,28, and Suz12 29, we analyzed the expression of these genes by qPCR. We found no significant difference in the expression levels of proteins known to control p16INK4a transcription (Fig. 1C). We then verified that the transcription levels of p16INK4a were rapidly upregulated in MozHAT−/− hematopoietic progenitors upon culture conditions that promote their proliferation (Fig. 1D). Higher levels of p16INK4a protein were also detected in these cells by immunoblotting and immunostaining (Fig. 1E, 1F). Similarly, to the in vitro ESC-derived blood cells, MozHAT−/− cells isolated from embryonic fetal liver and highly enriched for HSCs (Lin−Sca+cKit+CD150+CD48−) 30 had a limited proliferative capacity (Fig. 2A). This proliferative defect was reflected by a significantly lower percentage of cells in the S-phase of the cell cycle, and the accumulation of cells in the G1 phase as shown by BrdU incorporation analysis (Fig. 2B). qPCR analysis also revealed that MozHAT−/− fetal liver HSCs displayed increased expression levels of p16INK4a upon culture (Fig. 2C). To confirm our findings with adult hematopoietic progenitors and circumvent the limiting perinatal lethality of MozHAT−/− mice, we transplanted Wt or MozHAT−/− fetal liver cells (CD45.2+) into irradiated immunodeficient NSG (CD45.1+) mice. Analyses of peripheral blood chimerism in transplanted animals 4 weeks after transplantation indicated that baselines of engraftment by CD45.2+ cells were higher than 90% and similar between mice repopulated by either Wt or MozHAT−/− fetal liver cells (Supporting Information Fig. S1A). We then isolated adult CD45.2+Lin−cKit+ hematopoietic progenitors from the bone marrow of the reconstituted mice for analysis. The MozHAT−/− cells displayed again proliferative defects associated with an increase in p16INK4a protein levels upon ex vivo culture in proliferation media (Supporting Information Fig. S1B–S1F). To confirm these ex vivo findings and assess proliferation in vivo, cohorts of reconstituted mice were treated with 5FU to induce HSC entry into cell cycle 31,32. The p16INK4a protein was detected by immunostaining in CD45.2+Lin−cKit+ bone marrow cells isolated from 5FU treated MozHAT−/− mice 6 days after treatment (Fig. 2D), whereas no positive staining was observed in 5FU-treated Wt controls. In addition, 7–10 days after treatment, a high percentage of 5FU-treated mice reconstituted with MozHAT−/− had to be euthanized (Fig. 2E) due to excessive weight loss (Supporting Information Fig. S1G) associated with the development of low blood counts (Fig. 2F). These findings are consistent with the profound long-term repopulation potential defect of MozHAT−/− HSCs in serial transplantation experiments as documented previously 8. Altogether, these experiments demonstrate that the absence of the HAT activity of MOZ either in ESCs derived, fetal or adult hematopoietic progenitors results in cell autonomous proliferative defects triggered by a premature entry into replicative senescence.
Figure 1.
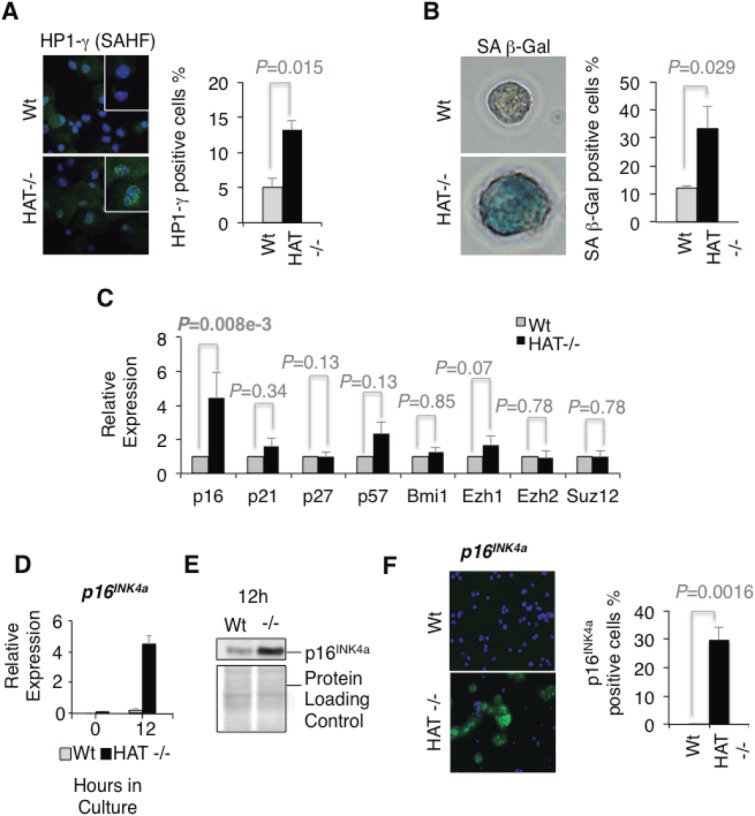
MozHAT−/− CD34+cKit+ hematopoietic progenitors leave the cell cycle to undergo early entrance into replicative senescence. (A): Senescence-associated heterochromatin foci. Wt and MozHAT−/− CD34+cKit+ hematopoietic progenitors isolated from day 6 embryoid bodies (EBs) were stained for Heterochromatin Protein 1-gamma (HP1-γ) (green) and 4',6-diamidino-2-phenylindole (DAPI) (blue) (magnification ×40). Bar graph indicates the percentage of cells stained positive for HP1-γ after 8 days in proliferation media. Bars represent mean ± SEM (B): CD34+cKit+ hematopoietic progenitors were stained with X-gal to detect the senescence-associated (SA) β-gal activity (pH: 6). Pictures show one representative cell of each group (magnification ×100). Bar graph indicates the percentage of cells stained after 10 days of culture in proliferation media. (C): Qualitative polymerase chain reaction (qPCR) analysis of the expression of diverse cyclin-dependent kinase inhibitors and p16INK4a regulators in CD34+cKit+ hematopoietic progenitors. For each gene, values for the MozHAT−/− are calculated relative to those of the Wt. Wt and MozHAT−/− progenitors cells were directly isolated from day 6 EBs and cultured in proliferation media for 48 hours before the analysis. Graph shows average values of three different experiments. Bars represent mean ± SEM (D): qPCR analysis of p16INK4a transcripts levels in CD34+cKit+ cells after 12 hours in proliferation media. (E): Immuno-blot shows p16INK4a levels of CD34+cKit+ hematopoietic progenitors 12 hours after plating in proliferation media. (F): Immunostaining of CD34+cKit+ hematopoietic progenitors 12 hours after plating (magnification ×20). Bar graph indicates the percentage of positive cells for p16INK4a. Abbreviations: HAT, histone acetyltransferase; SA β-gal, senescence-associated β-galactosidase; SAHF, senescence-associated heterochromatin foci; Wt, wild type.
Figure 2.
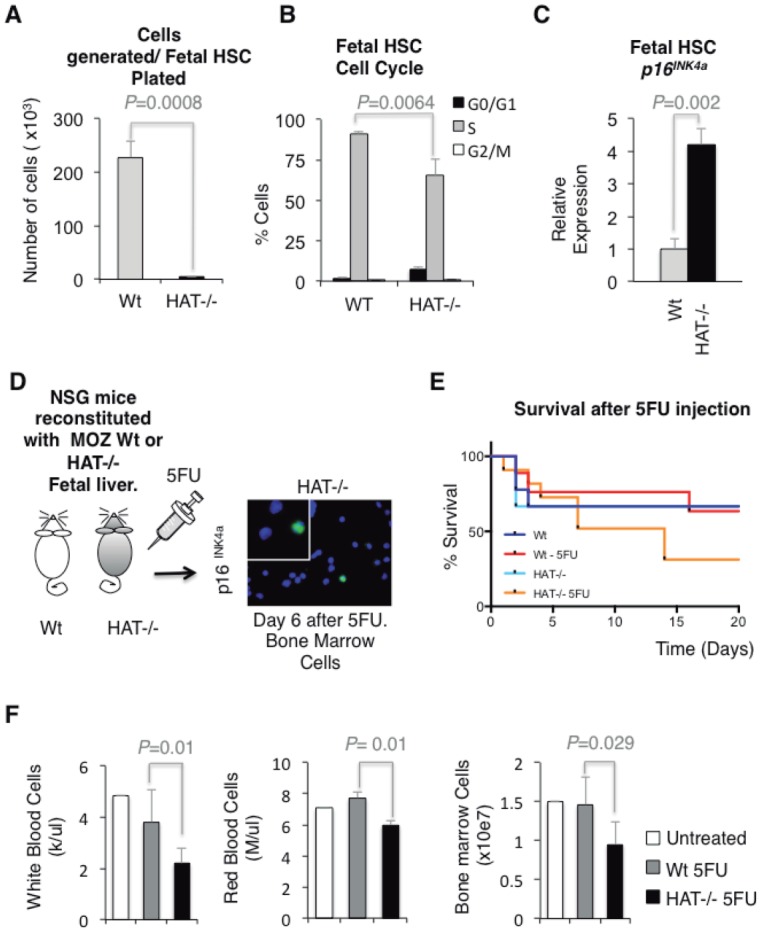
Impaired proliferation and p16INK4a upregulation in MozHAT−/− hematopoietic stem cell (HSC)/Ps in vivo. (A): Individual HSCs (Lin−Sca+cKit+CD150+CD48−) isolated from the fetal liver of Wt and MozHAT−/− embryos were sorted into 96-well plates containing proliferation media. Cell number was scored after 10 days. (B): Cell cycle status of Lin−Sca+cKit+CD150+CD48− fetal liver cells isolated from E14.5 embryos. Pregnant females were injected with 5-bromo-2-deoxyuridine 1 hour before harvesting of embryos and cell cycle was analyzed by flow cytometry. (C): Qualitative polymerase chain reaction analysis of p16INK4a expression in CD45.2+Lin−Sca+cKit+CD150+CD48− cells isolated from the bone marrow of reconstituted mice after 24 hours of culture in proliferation media. (D): Reconstituted mice were treated with 5FU. Bone marrow was harvested 6 days later and CD45.2+Lin−cKit+ cells were immunostained with a p16INK4a antibody. MOZHAT−/− bone marrow cells expressing p16INK4a are shown in the picture (magnification ×40). No cells positive for the p16INK4 staining were detected in the bone marrow of Wt reconstituted mice (data not shown). (E): Kaplan-Meier graph showing the survival of reconstituted NSG mice after 5FU injection. Control mice were not injected. Wt (n = 6), Wt 5FU (n = 6), histone acetyltransferase HAT−/− (n = 8) and HAT−/− 5FU (n = 8). (F): Low white and red blood cell counts and reduced bone marrow cellularity are detected in NSG mice reconstituted with MozHAT−/− fetal liver cells 7 days after injection with 5FU. Abbreviations: HAT, histone acetyltransferase; HSC, hematopoietic stem cell; MOZ, monocytic leukemia zinc finger protein; NSG, NOD Scid Gamma; Wt, wild type.
NSCs Self-Renewal Relies on MOZ HAT Dependent Silencing of p16INK4a
MOZ and its close homologue MORF (MOZ related factor, MYST4 or KAT6B) have been assigned specific roles in either hematopoietic or neural development, respectively 33,34. However, our previous observation that MozHAT−/− ESCs, unlike their Wt counterparts, did not extensively contribute to the formation of the brain in chimeric mice 8 suggests that MOZ, through its HAT activity, might also play a role in regulating the proliferation of NCS/Ps. To test this hypothesis, we first cultured cells isolated from the telencephalon of Wt and MozHAT−/− E14.5 embryos under clonogenic conditions to compare their potential to generate self-renewing neurospheres, a measurement of the number of cells with neural stem-like properties 35,36. MozHAT−/− embryos generated three times less neurospheres than Wt controls (Fig. 3A) suggesting that there are significantly fewer NSCs in the telencephalon of MozHAT−/− embryos. In addition, MozHAT−/− neurospheres displayed reduced expansion kinetics, producing fewer neurospheres at each passage, with an expansion index fivefold lower than Wt neurospheres (Fig. 3B), suggesting a reduced self-renewal potential. In fact, no neurospheres could be generated from the MOZHAT−/− cells after the third passage. In addition to this reduced expansion rate, MozHAT−/− neurospheres were, on average, smaller than their Wt counterparts (Fig. 3C), which could be indicative of cell-cycle arrest. BrdU incorporation analysis of MozHAT−/− secondary neurospheres revealed a reduced percentage of cells in the S-phase of the cell cycle and accumulation of cells at the G1 phase, similar to the phenotype observed for MozHAT−/− hematopoietic progenitors (Fig. 3D). Consistent with the acquisition of a senescent phenotype, cells from secondary MozHAT−/− neurospheres also displayed SA β-gal activity and higher p16INK4a expression levels than Wt controls (Fig. 3E, 3F). These in vitro findings were further substantiated in vivo by the observation that a lower percentage of cells expressing aldehyde dehydrogenase (ALDH), a marker of cells with stem-like properties 37,38, was detected in brains of E14.5 MozHAT−/− embryos compared with Wt embryos (Fig. 4A). Furthermore, a reduction in the number of cells expressing the proliferation marker Ki67 (Fig. 4B) and cells incorporating BrdU (Fig. 4C) was also observed in the brains of E14.5 MozHAT−/− embryos. Finally, qPCR analysis of E14.5 telencephalons revealed an increased p16INK4a expression in the telencephalon of MozHAT−/− embryos (Fig. 4D). Altogether, these data demonstrate that, similarly to the hematopoietic system, MozHAT−/− NSC/Ps display proliferative defects ex vivo and in vivo, upregulate the expression of p16INK4a and readily enter into replicative senescence.
Figure 3.
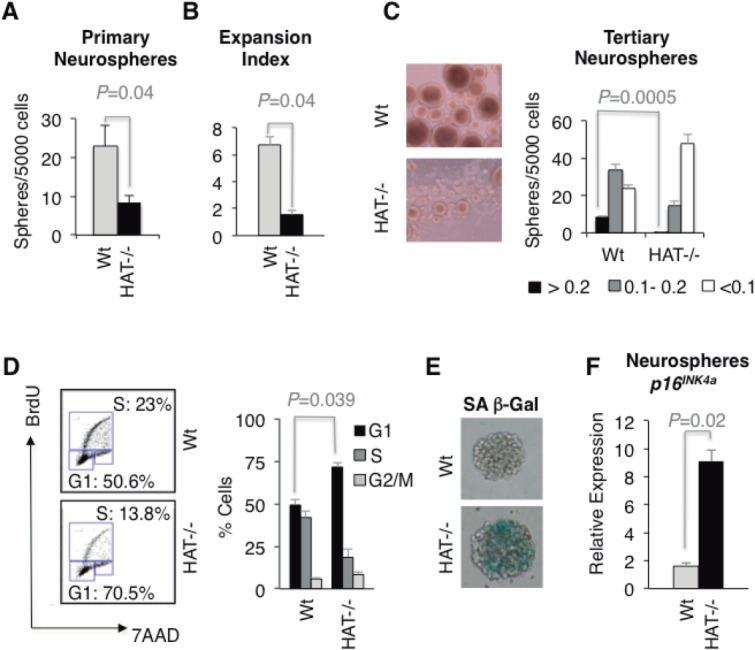
Telencephalon cells isolated from MozHAT−/− embryos display marked proliferative defects and signs of replicative senescence. (A): Frequency of primary neurospheres generated by E14.5 telencephalon cells. (B): Expansion index indicating the number of secondary neurospheres generated per primary neurosphere. (C): Morphology of Wt and MozHAT−/− day 8 tertiary neurospheres. Neurospheres are classified in different groups based on the diameter of the sphere. (<0.1 mm, 0.1–0.2 mm, and >0.2 mm). Bars represent mean ± SEM (n = 4). (D): Cell-cycle status of cells in neurospheres. Cells were isolated from day 6 secondary neurospheres. Percentage of cells in G1, S, and G2/M phases are indicated. Bars represent mean ± SEM (n = 3). (E): Senescence-associated β-galactosidase activity (pH: 6) in day 7 Wt and MozHAT−/− primary neurospheres. Magnification (×40). (F): Analysis of p16INK4a transcript levels in day 7 Wt, and MozHAT−/− neurospheres (n = 4 for each genotype). Abbreviations: 7AAD, 7-Aminoactinomycin D; BrdU, 5-bromo-2-deoxyuridine; HAT, histone acetyltransferase; SA β-gal, senescence-associated β-galactosidase; Wt, wild type.
Figure 4.
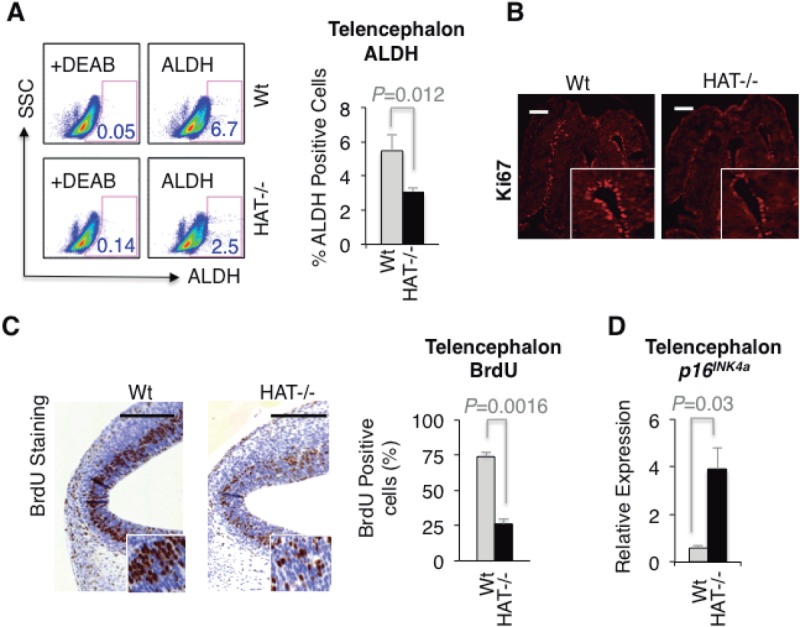
Impaired proliferation and p16INK4a upregulation in MozHAT−/− neural stem cells and progenitors in vivo. (A): Flow cytometry plots of ALDH activity in Wt and MozHAT−/− telencephalon cells. Cells isolated from E14.5 telencephalons were incubated with the ALDH substrate aldefluor in the presence or absence of the ALDH inhibitor diethylaminobenzaldehyde. Bar graph reflects the average percentage of ALDH positive cells. (B): Coronal sections of Wt and MozHAT−/− E14.5 telencephalons stained with anti-Ki67 antibody. Scale bar = 0.2 mm. (C): Sections of Wt and MozHAT−/− E14.5 telencephalons stained with anti-BrdU antibody. Bar graph represents the percentage of cells stained with BrdU. (D): Analysis of p16INK4a transcript levels in telencephalon tissue (n = 24) isolated from Wt and MozHAT−/− E14.5 embryos. Scale bar = 0.2 mm. Abbreviations: ALDH, aldehyde dehydrogenase; BrdU, 5-bromo-2-deoxyuridine; DEAB, diethylaminobenzaldehyde; HAT, histone acetyltransferase; SSC, Side Scatter; Wt, wild type.
Genetic Deletion of p16INK4a Largely Restores the Proliferative Capacity of HSC/Ps and NSC/Ps
As p16INK4a upregulation could be exacerbated in culture, we decided to directly evaluate to which extent the proliferative defects observed in MozHAT−/− mice are associated to an entry into replicative senescence induced by p16INK4a upregulation in vivo. To this end, we crossed heterozygote mice for the HAT mutation with p16INK4a/p19ARF knockout mice (hereafter INK4a−/−) 39 to generate double-knockout mice as well as heterozygotes and Wt control littermates. In the absence of INK4a, the embryonic and perinatal lethality of MozHAT−/− mice was clearly diminished resulting in increased frequency of MozHAT−/− mice at weaning (Fig. 5A). In addition, in the absence of p16INK4a, MozHAT−/− mice displayed an overall improved health status and a recovery of the runt phenotype reported previously for these mice 8. We next investigated whether the decreased frequency in HSC population observed in the fetal liver of MozHAT−/− embryos 8 was restored to normal level by deletion of p16INK4. Indeed INK4a+/+/MozHAT−/− (Wt/Ko) embryos displayed a reduced percentage of HSCs (Lin−Sca+cKit+CD150+CD48−), whereas the frequency of these cells was significantly higher in MozHAT−/− mice lacking p16INK4a (Ko/Ko) reaching similar values to those detected in INK4a+/+/MozHAT+/+ (Wt/Wt) embryos (Fig. 5B). To further investigate the contribution of p16INK4a to the proliferative defects of MozHAT−/− HSCs, we evaluated the ability of MozHAT−/− fetal liver cells on different INK4a backgrounds to repopulate the bone marrow of lethally irradiated recipients. INK4a+/+/MozHAT+/+ (Wt/Wt), INK4a−/−/MozHAT+/+ (Ko/Wt), INK4a+/+/MozHAT−/− (Wt/Ko) and INK4a−/−/MozHAT−/− (Ko/Ko) E14.5 CD45.2+ fetal liver cells were transplanted into lethally irradiated congenic CD45.1+ mice together with competitor CD45.1+/CD45.2+ cells. INK4a−/−/MozHAT−/− (Ko/Ko) fetal liver cells showed a significantly higher capacity to repopulate the bone marrow of recipient mice than INK4a+/+/MozHAT−/− (Wt/Ko) cells (Fig. 5C) indicating that the defective self-renewal capacity of MozHAT−/− HSCs could be rescued, at least partially, by the deletion of p16INK4a and strongly suggesting that p16INK4a is a critical MOZ target for the maintenance of HSC self-renewal. Similar to what we observed for the hematopoietic system, the genetic deletion of p16INK4a resulted in higher numbers of primary neurospheres generated by telencephalon cells of E14.5 MozHAT−/− embryos (Fig. 5D). Furthermore, serial passage of these primary neurospheres produced numbers of tertiary neurospheres similar of that of the Wt/Wt (Supporting Information Fig. S2A), indicating a substantial recovery of the expansion index of MozHAT−/− neurospheres in the absence of INK4a (Supporting Information Fig. S2B). Altogether, these results suggest that the defects observed in these MozHAT−/− neural cells are also mediated by the upregulation of p16INK4a. These results indicate that p16INK4a upregulation in MozHAT−/− cells inhibit NSC self-renewal driving cells into replicative senescence in a similar fashion to HSC/Ps lacking MOZ HAT activity.
Figure 5.
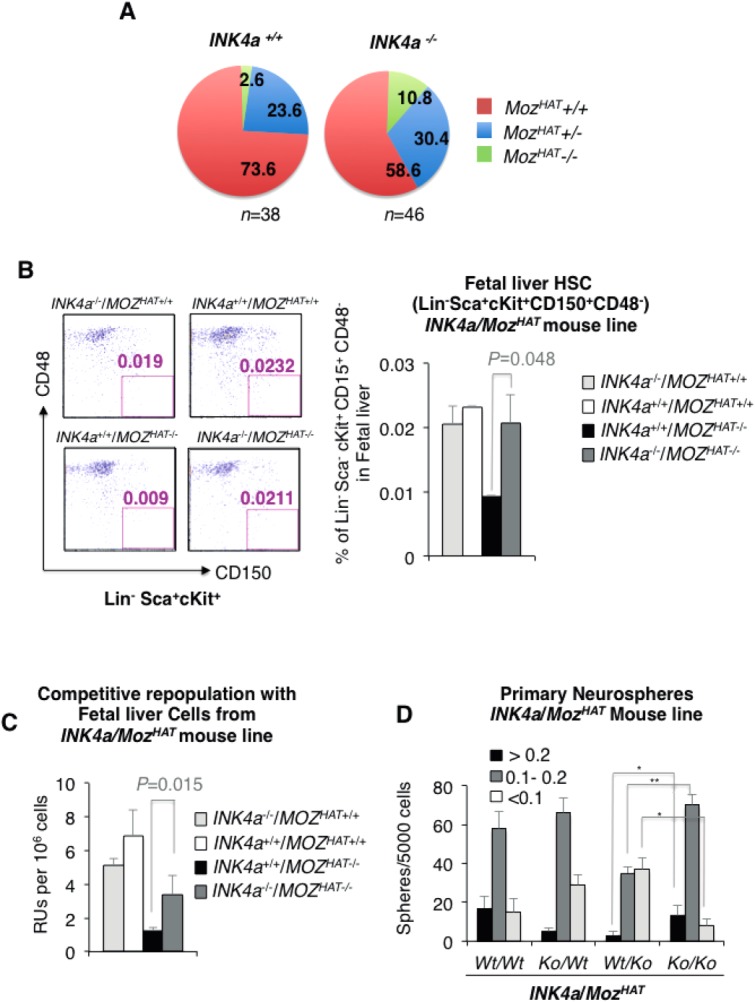
Impaired proliferation of MozHAT−/− hematopoietic stem cell (HSC), neural stem cell, and progenitors is rescued by genetic deletion of p16INK4a. (A): Genotype segregation of live mice produced by intercrossing of heterozygotes mice for the p16INK4a/ARF and MozHAT mutations (Ink4a+/−, MozHAT+/−). Numbers indicate the frequencies of the mice for each genotype. (B): Analysis of E14.5 fetal liver HSCs frequencies in INK4a−/−MozHAT+/+ (Ko/Wt), INK4a+/+MozHAT+/+ (Wt/Wt), INK4a+/+MozHAT−/− (Wt/Ko), and INK4a−/−MozHAT−/− (Ko/Ko) littermates. Fluorescence-activated cell sorting plots show the percentage of Lin−Sca+cKit+ CD150+CD48− cells of representative individuals in each group. Bar graph represents the average percentage of Lin−Sca+cKit+ CD150+CD48− cells in each phenotype. (C): Competitive repopulation assay of irradiated mice. Data are expressed as Repopulating units per 10e6 cells. (D): Bar graph shows the size of the neurospheres formed by telencephalon cells isolated from INK4a+/+MozHAT+/+ (Wt/Wt), INK4a−/−MozHAT+/+(Ko/Wt), INK4a+/+MozHAT−/− (Wt/Ko), and INK4a−/−MozHAT−/− (Ko/Ko) littermates. *p < .05; **p < .01. Abbreviations: HSC, hematopoietic stem cell; Ko, knockout; MOZ, monocytic leukemia zinc finger protein; RU, repopulating unit; Wt, wild type.
MOZ Binds to the Promoter of the p16INK4a Tumor Suppressor
In the absence of significant changes in the expression levels of known p16INK4a regulators, we decided to evaluate next by chromatin immunoprecipitation whether MOZ could directly bind to the p16INK4a promoter. The use of hematopoietic progenitors for these experiments would involve the isolation of very large number of cells difficult to obtain. To overcome this limitation, we decided to check whether the senescent phenotype was conserved in MozHAT−/− mouse embryonic fibroblasts (MEFs), which would provide a source of large numbers of cells needed for this study. We observed in clonogenic assays that the number of large proliferative colonies formed by individual MOZHAT−/− MEFs was almost three times less than those formed by Wt MEFs (Supporting Information Fig. S3A). Additionally, growth curves and cell cycle analyses using BrdU revealed a significant decline in the proliferation rate of the MozHAT−/− population over time (Supporting Information Fig. S3B) as well as a defect in the progression into the S-phase of the cell cycle (Supporting Information Fig. S3C). MozHAT−/− MEFs at passage five showed a high proportion of flattened cells containing SA-β-gal (Supporting Information Fig. S3D) and qPCR analysis of p16INK4a expression revealed that transcript levels were upregulated on average threefold in MozHAT−/− MEFs compared with Wt (Supporting Information Fig. S3E). Accordingly, protein levels of p16INK4a were clearly higher in MozHAT−/− MEFs than in the Wt and heterozygous MozHAT+/− MEFs (Supporting Information Fig. S3F). Together these results clearly indicate that the senescent phenotype mediated by the upregulation of p16INK4a was also observed in MozHAT−/− MEFs.
To determine whether the transcriptional upregulation of p16INK4a in the MozHAT−/− cells could be mediated by direct binding of MOZ to this locus, we performed ChIP analyses using MEFs isolated from E13.5 embryos. We detected MOZ binding to the p16INK4a promoter in Wt MEFs. This binding was conserved in MozHAT−/− MEFs indicating that the HAT mutation has no impact on the ability of MOZ to bind to this locus (Fig. 6A). A slightly higher binding frequency of MOZ to the p16INK4a promoter in the absence of HAT activity was consistently observed and might reflect a compensatory mechanism. Altogether, these results indicate that MOZ directly binds to the p16INK4a promoter. This might through acetylation of histones or potentially other interacting proteins, repress the transcription of this locus.
Figure 6.
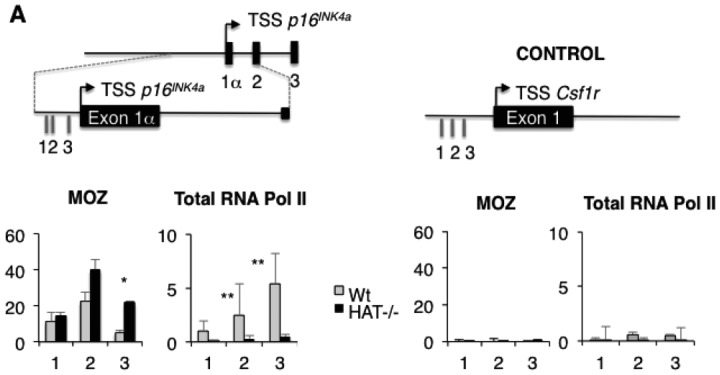
Monocytic leukemia zinc finger protein (MOZ) binding to the p16INK4a promoter at Wt and MOZHAT−/− Mouse embryonic fibroblasts. (A): Upper panel depicts p16INK4a promoter, exons, and introns. Numbers indicate amplified regions. Lower panel shows the ChIP analysis of MOZ binding at the p16INK4a promoter in Wt and MozHAT−/− MEFs. Binding of RNA Polymerase II was used as a positive control. Samples were prepared from passage 3 MEFs. The promoter of the CSF1R gene, not expressed in MEFs, was used as a negative control. *p < .05; **p < .01. Abbreviations: MOZ, monocytic leukemia zinc finger protein; TSS, Transcription Start Site.
Discussion
In this study, we establish that in the absence of the HAT activity of MOZ HSC/Ps readily exit the cell cycle to undergo premature entry into replicative senescence. These findings provide a likely explanation for the reported impairment of HSC self-renewal observed in mice expressing the catalytically inactive version of MOZ 8. In contrast to previous studies restricting the critical functions of MOZ and its close homologue MORF to hematopoietic and NSCs, respectively 34, we demonstrate here that similar proliferative defects are found in NSC/Ps lacking MOZ HAT activity (model in Fig. 7). Our data reveal that this common phenotype is at least partially caused by a premature upregulation of p16INK4a expression. Accordingly, genetic deletion of p16INK4a rescues to a large extent the proliferative defect. The fact that this phenotype is shared between the hematopoietic and neural compartments suggests that MOZ controls a regulatory mechanism conserved among stem cells from different tissues. This notion is supported by previous results showing that the contribution to specific organs in chimeric mice was consistently lower with MozHAT−/− ESCs than with Wt ESCs. The tissues with different contributions also included gut and liver in addition to the brain and hematopoietic organs 8.
Figure 7.
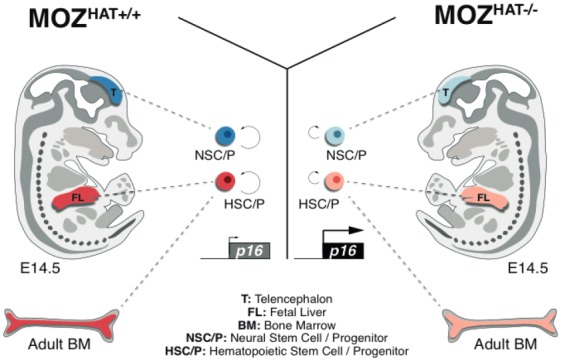
Monocytic leukemia zinc finger protein (MOZ) histone acetyltransferase (HAT) activity regulates the proliferation of different types of stem cells. The histone acetyltrasferase activity of MOZ prevents entry into early replicative senescence by regulating the expression of the tumor supperssor p16INK4a. In the absence of MOZ HAT activity, the levels of p16INK4a are significantly increased in both hematopoietic and neural stem and progenitor cell compartments. These cells then leave the cell cycle to become senescent, therefore resulting in severely impaired hematopoietic stem cells and neural stem cells self-renewal. Abbreviations: BM, bone marrow; HAT, histone acetyltransferase; HSC, hematopoietic stem cell; MOZ, monocytic leukemia zinc finger protein; NSC, neural stem cell.
The hematopoietic and neuronal phenotype of the MozHAT−/− mice bear strong similarities with the proliferative defects and premature senescence observed in neuronal and hematopoietic cells in the Bmi1 knock out animals 25,36,40–43. Bmi1 and other polycomb members are well-established negative epigenetic regulators of p16INK4a 44 whereas thritorax proteins 45 and SWI/SNF proteins 46 act positively on its expression. We did not detect a significant change in the level of expression of the p16INK4a regulators analyzed. However, we observed a direct interaction of MOZ to p16INK4a promoter suggesting that MOZ could introduce changes in histone acetylation pattern which, in turn, could alter the binding of transcriptional regulators of p16INK4a harboring bromodomains. Further studies will be required to determine whether the HAT activity of MOZ directly impacts on the binding of regulators of p16INK4a expression or whether MOZ is implicated in a completely novel level of regulation. The INK4a locus is one of the genomic regions most commonly mutated, deleted or epigenetically silenced in human cancers 47,48. It has been proposed that the fusion proteins produced upon translocation of the human MOZ locus with other HAT-encoding genes, such as CBP or p300, support the development of leukemia by altering the regulation of MOZ transcriptional targets. It would be interesting to examine if the repressive activity on p16INK4a expression mediated by MOZ acetylation is further exacerbated in these fusion proteins. As such, these MOZ leukemic fusion proteins might inhibit the triggering of senescence and promote the development of leukemia 49. Our findings also raise the intriguing possibility that the regulation of p16INK4a expression by MOZ could be used as a molecular target to induce senescence in cancer stem cells.
Conclusion
The histone acetyltranferase MOZ (Monocytic Leukemia Zinc Finger protein, MYST3, or KAT6A) has a crucial role in controlling hematopoietic stem cells (HSCs) proliferation. In this study, we identified a critical requirement for MOZ-HAT activity to silence p16Ink4a expression, to avoid senescence and sustain self-renewal of hematopoietic stem cells. We established that this effect is not limited to the hematopoietic compartment, but extends to neural stem cells and progenitors (NSC/P) suggesting that these two types of cells, HSCs and NSCs use the same mechanism involving MOZ-driven acetylation in order to maintain their capacity to proliferate. We propose that this mechanism could be also be critical for the self renewal of other types of stem cells.
Acknowledgments
We thank K. Labib, P. Sroczynska, C. Bonifer, and T.C. Somervaille for critical review of the manuscript. This work was supported by the Leukemia and Lymphoma Research Foundation (LLR), Cancer Research UK (CRUK), and the Biotechnology and Biological Sciences Research Council (BBSRC). F.M.P.-C. is currently affiliated with the Department of Internal Medicine, Hospital U.M. Valdecilla, IFIMAV, University of Cantabria, Santander, Spain.
Author Contributions
F.M.P.-C.: conception and design, collection and assembly of data, data analysis, and interpretation, manuscript writing and final approval of manuscript; G.C.: data analysis and interpretation, collection and assembly of data, manuscript writing and final approval of manuscript; M.L.-a-L. and S.S.: data analysis and interpretation; V.K.: conception and design, financial support and final approval of manuscript; G.L.: conception and design, financial support, manuscript writing and final approval of manuscript.
Disclosure of Potential Conflicts of Interest
The authors declare no potential conflicts of interest.
Supporting Information
See www.StemCells.com for supporting information available online.
References
- Borrow J, Stanton VP, Jr, Andresen JM, et al. The translocation t(8;16)(p11;p13) of acute myeloid leukaemia fuses a putative acetyltransferase to the CREB-binding protein. Nat Genet. 1996;14:33–41. doi: 10.1038/ng0996-33. [DOI] [PubMed] [Google Scholar]
- Carapeti M, Aguiar RC, Goldman JM, et al. A novel fusion between MOZ and the nuclear receptor coactivator TIF2 in acute myeloid leukemia. Blood. 1998;91:3127–3133. [PubMed] [Google Scholar]
- Chaffanet M, Gressin L, Preudhomme C, et al. MOZ is fused to p300 in an acute monocytic leukemia with t(8;22) Genes Chromosomes Canc. 2000;28:138–144. doi: 10.1002/(sici)1098-2264(200006)28:2<138::aid-gcc2>3.0.co;2-2. [DOI] [PubMed] [Google Scholar]
- Esteyries S, Perot C, Adelaide J, et al. NCOA3, a new fusion partner for MOZ/MYST3 in M5 acute myeloid leukemia. Leukemia. 2008;22:663–665. doi: 10.1038/sj.leu.2404930. [DOI] [PubMed] [Google Scholar]
- Perez-Campo FM, Costa G, Lie-a-Ling M, et al. The MYSTerious MOZ, a histone acetyltransferase with a key role in haematopoiesis. Immunology. 2013;139:161–165. doi: 10.1111/imm.12072. [DOI] [PMC free article] [PubMed] [Google Scholar]
- Katsumoto T, Aikawa Y, Iwama A, et al. MOZ is essential for maintenance of hematopoietic stem cells. Genes Dev. 2006;20:1321–1330. doi: 10.1101/gad.1393106. [DOI] [PMC free article] [PubMed] [Google Scholar]
- Thomas T, Corcoran LM, Gugasyan R, et al. Monocytic leukemia zinc finger protein is essential for the development of long-term reconstituting hematopoietic stem cells. Genes Dev. 2006;20:1175–1186. doi: 10.1101/gad.1382606. [DOI] [PMC free article] [PubMed] [Google Scholar]
- Perez-Campo FM, Borrow J, Kouskoff V, et al. The histone acetyl transferase activity of monocytic leukemia zinc finger is critical for the proliferation of hematopoietic precursors. Blood. 2009;113:4866–4874. doi: 10.1182/blood-2008-04-152017. [DOI] [PMC free article] [PubMed] [Google Scholar]
- Sroczynska P, Lancrin C, Pearson S, et al. In vitro differentiation of mouse embryonic stem cells as a model of early hematopoietic development. Methods Mol Biol. 2009;538:317–334. doi: 10.1007/978-1-59745-418-6_16. [DOI] [PubMed] [Google Scholar]
- Mikula M, Schreiber M, Husak Z, et al. Embryonic lethality and fetal liver apoptosis in mice lacking the c-raf-1 gene. EMBO J. 2001;20:1952–1962. doi: 10.1093/emboj/20.8.1952. [DOI] [PMC free article] [PubMed] [Google Scholar]
- Langer JC, Henckaerts E, Orenstein J, et al. Quantitative trait analysis reveals transforming growth factor-β2 as a positive regulator of early hematopoietic progenitor and stem cell function. J Exp Med. 2004;199:5–14. doi: 10.1084/jem.20030980. [DOI] [PMC free article] [PubMed] [Google Scholar]
- Harrison DE, Astle CM. Short- and long-term multilineage repopulating hematopoietic stem cells in late fetal and newborn mice: models for human umbilical cord blood. Blood. 1997;90:174–181. [PubMed] [Google Scholar]
- Narita M, Nunez S, Heard E, et al. Rb-mediated heterochromatin formation and silencing of E2F target genes during cellular senescence. Cell. 2003;113:703–716. doi: 10.1016/s0092-8674(03)00401-x. [DOI] [PubMed] [Google Scholar]
- Stepanova L, Sorrentino BP. A limited role for p16Ink4a and p19Arf in the loss of hematopoietic stem cells during proliferative stress. Blood. 2005;106:827–832. doi: 10.1182/blood-2004-06-2242. [DOI] [PMC free article] [PubMed] [Google Scholar]
- Oguro H, Iwama A, Morita Y, et al. Differential impact of Ink4a and Arf on hematopoietic stem cells and their bone marrow microenvironment in Bmi1-deficient mice. J Exp Med. 2006;203:2247–2253. doi: 10.1084/jem.20052477. [DOI] [PMC free article] [PubMed] [Google Scholar]
- Cheng T, Rodrigues N, Shen H, et al. Hematopoietic stem cell quiescence maintained by p21cip1/waf1. Science. 2000;287:1804–1808. doi: 10.1126/science.287.5459.1804. [DOI] [PubMed] [Google Scholar]
- van Os R, Kamminga LM, Ausema A, et al. A Limited role for p21Cip1/Waf1 in maintaining normal hematopoietic stem cell functioning. Stem Cells. 2007;25:836–843. doi: 10.1634/stemcells.2006-0631. [DOI] [PubMed] [Google Scholar]
- Viale A, De Franco F, Orleth A, et al. Cell-cycle restriction limits DNA damage and maintains self-renewal of leukaemia stem cells. Nature. 2009;457:51–56. doi: 10.1038/nature07618. [DOI] [PubMed] [Google Scholar]
- Yu H, Yuan Y, Shen H, et al. Hematopoietic stem cell exhaustion impacted by p18 INK4C and p21 Cip1/Waf1 in opposite manners. Blood. 2006;107:1200–1206. doi: 10.1182/blood-2005-02-0685. [DOI] [PMC free article] [PubMed] [Google Scholar]
- Qiu J, Takagi Y, Harada J, et al. Regenerative response in ischemic brain restricted by p21cip1/waf1. J Exp Med. 2004;199:937–945. doi: 10.1084/jem.20031385. [DOI] [PMC free article] [PubMed] [Google Scholar]
- Cheng T, Rodrigues N, Dombkowski D, et al. Stem cell repopulation efficiency but not pool size is governed by p27(kip1) Nat Med. 2000;6:1235–1240. doi: 10.1038/81335. [DOI] [PubMed] [Google Scholar]
- Qiu J, Takagi Y, Harada J, et al. p27Kip1 constrains proliferation of neural progenitor cells in adult brain under homeostatic and ischemic conditions. Stem Cells. 2009;27:920–927. doi: 10.1002/stem.1. [DOI] [PMC free article] [PubMed] [Google Scholar]
- Yamazaki S, Iwama A, Takayanagi S, et al. Cytokine signals modulated via lipid rafts mimic niche signals and induce hibernation in hematopoietic stem cells. EMBO J. 2006;25:3515–3523. doi: 10.1038/sj.emboj.7601236. [DOI] [PMC free article] [PubMed] [Google Scholar]
- Matsumoto A, Takeishi S, Kanie T, et al. p57 is required for quiescence and maintenance of adult hematopoietic stem cells. Cell Stem cell. 2011;9:262–271. doi: 10.1016/j.stem.2011.06.014. [DOI] [PubMed] [Google Scholar]
- Bruggeman SW, Valk-Lingbeek ME, van der Stoop PP, et al. Ink4a and Arf differentially affect cell proliferation and neural stem cell self-renewal in Bmi1-deficient mice. Genes Dev. 2005;19:1438–1443. doi: 10.1101/gad.1299305. [DOI] [PMC free article] [PubMed] [Google Scholar]
- Hidalgo I, Herrera-Merchan A, Ligos JM, et al. Ezh1 is required for hematopoietic stem cell maintenance and prevents senescence-like cell cycle arrest. Cell Stem cell. 2012;11:649–662. doi: 10.1016/j.stem.2012.08.001. [DOI] [PubMed] [Google Scholar]
- Agherbi H, Gaussmann-Wenger A, Verthuy C, et al. Polycomb mediated epigenetic silencing and replication timing at the INK4a/ARF locus during senescence. Plos One. 2009;4:e5622. doi: 10.1371/journal.pone.0005622. [DOI] [PMC free article] [PubMed] [Google Scholar]
- Barradas M, Anderton E, Acosta JC, et al. Histone demethylase JMJD3 contributes to epigenetic control of INK4a/ARF by oncogenic RAS. Genes Dev. 2009;23:1177–1182. doi: 10.1101/gad.511109. [DOI] [PMC free article] [PubMed] [Google Scholar]
- Kotake Y, Cao R, Viatour P, et al. pRB family proteins are required for H3K27 trimethylation and Polycomb repression complexes binding to and silencing p16INK4alpha tumor suppressor gene. Genes Dev. 2007;21:49–54. doi: 10.1101/gad.1499407. [DOI] [PMC free article] [PubMed] [Google Scholar]
- Yilmaz OH, Kiel MJ, Morrison SJ. SLAM family markers are conserved among hematopoietic stem cells from old and reconstituted mice and markedly increase their purity. Blood. 2006;107:924–930. doi: 10.1182/blood-2005-05-2140. [DOI] [PMC free article] [PubMed] [Google Scholar]
- Lerner C, Harrison DE. 5-Fluorouracil spares hemopoietic stem cells responsible for long-term repopulation. Exp Hematol. 1990;18:114–118. [PubMed] [Google Scholar]
- Venezia TA, Merchant AA, Ramos CA, et al. Molecular signatures of proliferation and quiescence in hematopoietic stem cells. Plos Biology. 2004;2:e301. doi: 10.1371/journal.pbio.0020301. [DOI] [PMC free article] [PubMed] [Google Scholar]
- Yang XJ, Ullah M. MOZ and MORF, two large MYSTic HATs in normal and cancer stem cells. Oncogene. 2007;26:5408–5419. doi: 10.1038/sj.onc.1210609. [DOI] [PubMed] [Google Scholar]
- Voss AK, Thomas T. MYST family histone acetyltransferases take center stage in stem cells and development. Bioessays. 2009;31:1050–1061. doi: 10.1002/bies.200900051. [DOI] [PubMed] [Google Scholar]
- Suslov ON, Kukekov VG, Ignatova TN, et al. Neural stem cell heterogeneity demonstrated by molecular phenotyping of clonal neurospheres. Proc Natl Acad Sci U S A. 2002;99:14506–14511. doi: 10.1073/pnas.212525299. [DOI] [PMC free article] [PubMed] [Google Scholar]
- Molofsky AV, Pardal R, Iwashita T, et al. Bmi-1 dependence distinguishes neural stem cell self-renewal from progenitor proliferation. Nature. 2003;425:962–967. doi: 10.1038/nature02060. [DOI] [PMC free article] [PubMed] [Google Scholar]
- Cai J, Cheng A, Luo Y, et al. Membrane properties of rat embryonic multipotent neural stem cells. J Neurochem. 2004;88:212–226. doi: 10.1046/j.1471-4159.2003.02184.x. [DOI] [PubMed] [Google Scholar]
- Corti S, Locatelli F, Papadimitriou D, et al. Identification of a primitive brain-derived neural stem cell population based on aldehyde dehydrogenase activity. Stem Cells. 2006;24:975–985. doi: 10.1634/stemcells.2005-0217. [DOI] [PubMed] [Google Scholar]
- Serrano M, Lee H, Chin L, et al. Role of the INK4a locus in tumor suppression and cell mortality. Cell. 1996;85:27–37. doi: 10.1016/s0092-8674(00)81079-x. [DOI] [PubMed] [Google Scholar]
- van der Lugt NM, Domen J, Linders K, et al. Posterior transformation, neurological abnormalities, and severe hematopoietic defects in mice with a targeted deletion of the bmi-1 proto-oncogene. Genes Dev. 1994;8:757–769. doi: 10.1101/gad.8.7.757. [DOI] [PubMed] [Google Scholar]
- Jacobs JJ, Kieboom K, Marino S, et al. The oncogene and Polycomb-group gene bmi-1 regulates cell proliferation and senescence through the ink4a locus. Nature. 1999;397:164–168. doi: 10.1038/16476. [DOI] [PubMed] [Google Scholar]
- Lessard J, Sauvageau G. Bmi-1 determines the proliferative capacity of normal and leukaemic stem cells. Nature. 2003;423:255–260. doi: 10.1038/nature01572. [DOI] [PubMed] [Google Scholar]
- Leung C, Lingbeek M, Shakhova O, et al. Bmi1 is essential for cerebellar development and is overexpressed in human medulloblastomas. Nature. 2004;428:337–341. doi: 10.1038/nature02385. [DOI] [PubMed] [Google Scholar]
- Bracken AP, Kleine-Kohlbrecher D, Dietrich N, et al. The Polycomb group proteins bind throughout the INK4A-ARF locus and are disassociated in senescent cells. Genes Dev. 2007;21:525–530. doi: 10.1101/gad.415507. [DOI] [PMC free article] [PubMed] [Google Scholar]
- Kotake Y, Zeng Y, Xiong Y. DDB1-CUL4 and MLL1 mediate oncogene-induced p16INK4a activation. Cancer Res. 2009;69:1809–1814. doi: 10.1158/0008-5472.CAN-08-2739. [DOI] [PMC free article] [PubMed] [Google Scholar]
- Kia SK, Gorski MM, Giannakopoulos S, et al. SWI/SNF mediates polycomb eviction and epigenetic reprogramming of the INK4b-ARF-INK4a locus. Mol Cell Biol. 2008;28:3457–3464. doi: 10.1128/MCB.02019-07. [DOI] [PMC free article] [PubMed] [Google Scholar]
- Gil J, Peters G. Regulation of the INK4b-ARF-INK4a tumour suppressor locus: all for one or one for all. Nat Rev Mol Cell Biol. 2006;7:667–677. doi: 10.1038/nrm1987. [DOI] [PubMed] [Google Scholar]
- Beroukhim R, Mermel CH, Porter D, et al. The landscape of somatic copy-number alteration across human cancers. Nature. 2010;463:899–905. doi: 10.1038/nature08822. [DOI] [PMC free article] [PubMed] [Google Scholar]
- Hahn WC, Weinberg RA. Rules for making human tumor cells. N Engl J Med. 2002;347:1593–1603. doi: 10.1056/NEJMra021902. [DOI] [PubMed] [Google Scholar]
Associated Data
This section collects any data citations, data availability statements, or supplementary materials included in this article.


