

Abstract
The evolution of diversity in the marine ecosystem is poorly understood, given the relatively high potential for connectivity, especially for highly mobile species such as whales and dolphins. The killer whale (Orcinus orca) has a worldwide distribution, and individual social groups travel over a wide geographic range. Even so, regional populations have been shown to be genetically differentiated, including among different foraging specialists (ecotypes) in sympatry. Given the strong matrifocal social structure of this species together with strong resource specializations, understanding the process of differentiation will require an understanding of the relative importance of both genetic drift and local adaptation. Here we provide a high-resolution analysis based on nuclear single-nucleotide polymorphic markers and inference about differentiation at both neutral loci and those potentially under selection. We find that all population comparisons, within or among foraging ecotypes, show significant differentiation, including populations in parapatry and sympatry. Loci putatively under selection show a different pattern of structure compared to neutral loci and are associated with gene ontology terms reflecting physiologically relevant functions (e.g. related to digestion). The pattern of differentiation for one ecotype in the North Pacific suggests local adaptation and shows some fixed differences among sympatric ecotypes. We suggest that differential habitat use and resource specializations have promoted sufficient isolation to allow differential evolution at neutral and functional loci, but that the process is recent and dependent on both selection and drift.
Keywords: adaptation, Cetacea, ecological genetics, population genomics, sympatric divergence
Introduction
The scarcity of strong geographical barriers and the large dispersal abilities of many marine species have led to suggestions that selection is a dominant mechanism driving population differentiation (Naciri et al. 1999; Bierne et al. 2003). This view has been supported by studies showing genetic structure associated with environmental and physiological differences (Ruzzante et al. 1996; Beheregaray & Sunnucks 2001; Jorgensen et al. 2005; Palumbi & Lessios 2005; Atarhouch et al. 2007; White et al. 2010; Bowen et al. 2013). However, several examples are known among marine taxa where small-scale population differentiation has been attributed to complex phylogeographic scenarios involving differentiation in isolation due to cyclical climate change (Alvarado Bremer et al. 2005; Domingues et al. 2007, 2008), vicariance or the opening of dispersal corridors (Tringali 1999; de Bruyn et al. 2005; Puckridge et al. 2012).
Cetaceans have large dispersal abilities and long-life expectancies, and yet often show genetic differentiation over relatively small geographic scales (Hoelzel 2009). Some studies have suggested that small-scale population differentiation in these species is caused by adaptation to local environmental differences (Yoshida et al. 2001; Möller et al. 2010; Mendez et al. 2011; Amaral et al. 2012), although the inference is indirect. It is also the case that closely related species with very similar distribution patterns may show very different patterns of genetic differentiation, such as the fine-scale differentiation seen for bottlenose dolphins (Tursiops truncatus) in European waters (Natoli et al. 2005) compared to the lack of structure for common dolphins (Delphinus delphis) over the same range (Moura et al. 2013a). This may emphasize the importance of species-specific resource requirements and specializations towards the evolution of habitat dependence, philopatry and population differentiation (Yurk et al. 2002; Natoli et al. 2006; Hoelzel et al. 2007; Moura et al. 2013a).
Killer whales show population genetic structure over spatial scales that are much smaller than their dispersal abilities (Hoelzel et al. 2007). These large-bodied dolphins are distributed worldwide and organized into stable, matrifocal social groups called pods. Different communities of pods exhibit consistent, long-term specializations on prey resource, defining different ‘ecotypes’ (which sometimes also differ with respect to other aspects of behaviour and morphology, see de Bruyn et al. 2013). Although the level of gene flow between pods varies depending on the ecotype, gene flow between different ecotypes has been shown to be limited based on inference from both mtDNA and microsatellite DNA markers, with some exceptions (see Hoelzel et al. 2007; Morin et al. 2010; Foote et al. 2013). In the North Pacific, two ecotypes, known as ‘residents’ and ‘transients’, occupy largely sympatric distribution ranges (Ford et al. 2000), but are genetically well differentiated (e.g. Hoelzel et al. 2007). This is coincident with differences in prey specialization (fish vs. marine mammals, respectively, Ford et al. 1998; Krahn et al. 2007), social organization (Ford et al. 2000), mating systems (Pilot et al. 2010) and vocal behaviour (Yurk et al. 2002; Deecke et al. 2005).
Significant genetic differentiation is typically found for all comparisons of killer whale populations defined a priori either geographically or by ecotype (Hoelzel et al. 2007; Morin et al. 2010), although overall diversity is low worldwide, likely due to a bottleneck during the last glacial period (Hoelzel et al. 2002; Moura et al. 2014a). Differentiation is seen both between ecotypes in sympatry and following a pattern of isolation by distance within an ecotype (Hoelzel et al. 2007). However, previous studies restricted to neutral markers can provide only limited insight into the mechanisms of ecological adaptation and differentiation between ecotypes. Here we focus on the North Pacific, but include outgroup populations from the North Atlantic (Iceland) and Southern Oceans (Marion Island, MI). We use restriction-site-associated DNA (RAD) single-nucleotide polymorphic (SNP) markers to provide a high-resolution genomewide assessment of population structure at both neutral loci and markers putatively under selection. We test the hypothesis that populations representing sympatric ecotypes (e.g. residents and transients) will show patterns of differentiation that reflect selection at functional loci. More broadly, we investigate the hypothesis that in addition to the process of genetic drift, disruptive selection is driving the differentiation of killer whale ecotypes in sympatry.
Methodology
Samples were used from a long-term DNA archive built from previous studies (Hoelzel et al. 2007). Newly obtained samples from a population in the Southern Ocean at MI were collected through remote biopsy sampling, using protocols approved by the University of Pretoria's Animal Use and Care Committee (EC023-10) and under permit from the Prince Edward Islands Management Committee. Details on sample numbers and origins are provided in Table S1 (Supporting information). The distribution of sample sites is illustrated in Fig.1.
Figure 1.
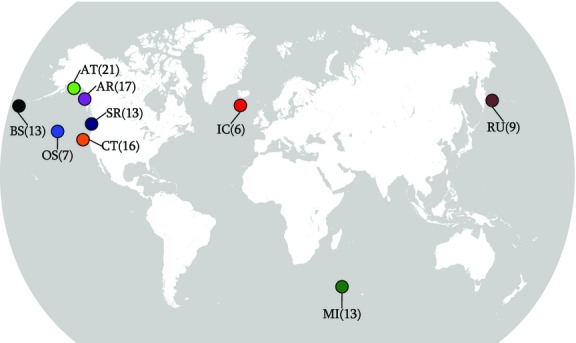
Map of sample sites (colour coded online to match Fig4) and sample sizes parenthetically. Location abbreviations are as defined in Table2. See text for definitions of population codes.
RAD sequencing
A modified RAD Seq protocol (Baird et al. 2008) was carried out using the NotI restriction enzyme to obtain genomewide nuclear data (see Moura et al. 2014b for details). A subset of the samples (N = 43) was used in an earlier study on phylogenomics (Moura et al. 2014b). Briefly, genomic DNA (500 ng–1 μg) was digested at 37 °C overnight, followed by 5 min at 65 °C for termination, with fragments isolated with AMPure XP beads (Agencourt). The forward adapter (p5 adapter) was modified to employ 4 adapters for initial ligation, thus facilitating sequencing cluster differentiation (see Moura et al. 2014b).
Adapter-ligated fragments were sheared by sonication targeting a 500 bp average fragment size, recovered with AMPure XP beads and end-repaired using a commercial kit (NEB E6050L) following manufacturer's instructions. Fragments were then selected using streptavidin magnetic beads (Dynabeads® M-280 Streptavidin cat no11205D Life Technologies), using 15 min of binding time at room temperature with agitation, and washed 3 times with Tris/Ethylenediaminetetraacetic acid (TE). DNA that bound to the beads was ligated to a universal p7 sequence adapter.
Amplification primers were designed with 8-bp barcodes to allow multiplexing in a single sequencing lane. A single barcoded primer and a universal primer were used to amplify each sample. Cycling conditions included an initial denaturation step at 98 °C for 30 s, followed by 12–14 cycles of one denaturation step at 98 °C for 10 s, annealing at 60 °C for 30 s, extension at 72 °C for 30 s, followed by a final 5-min extension step. Samples were purified with AMPure XP beads which were washed with 80% ethanol and resuspended in 10 mm Tris pH 7.5. A Qubit (Life Technologies) was used for quantity assessment, and a Bioanalyser 2100 (Agilent) for quality assessment. A 1.5% Pippin prep cassette (Sage Scientific) was used to select pooled samples based on size and quantified by qPCR (KAPA). Two initial 2 × 150 MiSeq runs were carried out without phiX, for a pool of 5 libraries (one sample per library) using this modified and the original Baird et al. (2008) published approach, for quality control (see supplement to Moura et al. 2014b for more detail). The two methods provide comparable results. Sequencing of the pooled libraries was performed on the Illumina HiSeq 2000 using v3 chemistry.
SNP mapping and genotyping
Trimmed short reads were mapped against the killer whale genome version 1.1 (GenBank accession no. ANOL00000000) using BWA short read mapper (Li & Durbin 2009). SNP genotypes were called with the Genome Analysis Toolkit (gatk) software package (McKenna et al. 2010), using the Unified Genotyper module (DePristo et al. 2011). A multisample genotype calling was carried out, including only variable SNPs that were called with a minimum base quality score of 10. vcftools (Danecek et al. 2011) was then used to remove all indels, as well as positions with average coverage below 20× and genotype quality below Q20. SNPs for which at least one individual had missing data were removed from the datafile (so that we included only the SNPs that had been confidently scored for all individuals; input file provided on Dryad).
Selection detection and population structure analyses
The FST outlier method implemented in lositan (Antao et al. 2008) was used to detect putative signs of selection. The following ecotypes/geographic locations were used to define populations (following the results obtained in Hoelzel et al. 2007; Parsons et al. 2013): Marion Island (MI), Iceland (IC), North Pacific Offshores (OS), Alaskan residents (AR), Southern residents (SR), Alaska transients (AT), California transients (CT), Bering Sea residents (BS) and Russian residents (RU). See Table S1 (Supporting information) for ecotype designation for each putative population. Baseline mean neutral FST was calculated excluding putative selected loci, which were detected using the bisection algorithm over 50 000 simulations with a false discovery rate of 0.1. Fixed differences were identified from genotype profiles and tested against chance using a binomial distribution test.
Comparisons of population structure based on SNPs were carried out using the discriminant analysis of principal components (DAPC) method (Jombart et al. 2010) implemented in the software package adegenet (Jombart & Ahmed 2011) both by assigning each individual to the predefined populations, and by determining the best supported number of clusters (1–20) without a priori identification of structure. In both analyses, the first 40 principal components were retained, as were the first four discriminant functions. Patterns of population structure obtained with both neutral and positively selected SNPs were analysed using factorial correspondence analysis (FCA) as implemented in adegenet. Patterns of population diversity and differentiation between neutral and selected SNPs were investigated by comparing pairwise FST and nucleotide differences, using the software arlequin (Excoffier et al. 2005). Differential patterns were assessed using the nonparametric Mann–Whitney U-test and χ2 in 2 × 2 contingency tables (further details provided in the Results section).
Functional annotation of relevant SNPs
To identify sites within the relatively well-annotated bottlenose dolphin genome, a sufficient region of sequence to permit confident alignment (2000 bp) centred by the SNP of interest was retrieved from the killer whale genome and mapped against the bottlenose dolphin genome (version 1.69) using the ensembl blat alignment tool. Functional annotation of the genes found to be physically linked to any of these SNPs was carried out using the david web tool (Sherman et al. 2007). This analysis was carried out for all SNPs found to have fixed differences between populations, and for the SNPs with the strongest evidence for either positive or balancing selection based on the analysis using lositan (limited to those assigned as an outlier with a probability of 1). Genes of interest were identified as those within 5 kb of a SNP that was either a strong outlier or one of the fixed differences. A minimum linkage block size of 5 kb has been suggested in some studies (e.g. Nash et al. 2005; Shimada et al. 2011). Due to potential inbreeding and small effective population sizes, linkage blocks in killer whales may be relatively large, but the actual size is unknown. Therefore, for our study, 5 kb was chosen as a compromise: short enough for the SNP to be very likely within a linkage block, and long enough to include a reasonable number of loci to investigate.
To test whether any functions were overrepresented for the genes linked to SNPs putatively under selection, we carried out the gene ontology (GO) term enrichment analysis as implemented in the software fatigo+ (Al-Shahrour et al. 2007), using the Babelomics portal (Medina et al. 2010). This software compares the proportional representation of a given GO term in the submitted gene list to the proportion in a reference genome. Significance was assessed by means of a two-tailed Fisher's exact test, and only those results still significant at the P < 0.05 level after correction for type 1 errors were included.
Enrichment analyses were carried out against the human genome background list, with any duplicate entries removed. We chose the human background list because this is the mammalian genome with the most complete and robust level of annotation. However, we also assessed enrichment against a background list of genes linked to the SNPs identified from our RAD analysis. First we identified genes within 5 kb of all SNPs identified in our RAD analysis, and from the list of genes associated with SNPs identified as neutral (identified using lositan; see above), generated 10 random lists of the same length as the putative selected loci list. These were investigated for the overrepresentation of GO terms using fatigo+ using the human background list. On the assumption that the full RAD SNP-associated list would provide a representation of the background GO terms found across the full genome (though at a lower resolution), we also compared our putative selected loci list against GO terms for genes associated with the full set of RAD SNP loci.
Demographic analyses
To investigate killer whale demographic history, we analysed neutral SNPs using diffusion approximation of the joint allele frequency spectrum in ∂a∂i version 1.6.3 (Gutenkunst et al. 2009). To polarize the SNPs and determine the derived allele, killer whale reads were mapped against the bottlenose dolphin (T. truncatus) genome assembly version 1.69 available from the ensembl database. SNPs were called and filtered as described above, and sites that were found to be under positive or balancing selection were removed. A statistical correction for errors in the outgroup Tursiops sequence was applied using a trinucleotide substitution matrix from Hwang & Green (2004) and an estimate of 1.82% sequence divergence between the dolphin and killer whale. Our estimate of sequence divergence was based on a genome size of 2.3 Gb, a divergence time of 10 million years (following the TMRCA between the two species as determined from a multilocus phylogeny, McGowen et al. 2009), and a mutation rate of 2.34 × 10⁻⁸ substitutions/nucleotide/generation, following the mutation rate estimates for the nuclear genome in Odontocetes (Dornburg et al. 2012).
The ∂a∂i software is effectively limited to analysing up to three populations at a time. Therefore, we focused on two trios of populations that reflected the most informative lineage histories as indicated by the topology in our phylogenies from Moura et al. (2014b). The first analysis included the Southern Ocean (MI), Alaska transient (AT) and OS populations, and the second included AT, OS and the Alaska resident population (AR). We selected AT and AR for these analyses because they represented the largest samples for the transient and resident ecotypes, respectively, and are found in sympatry. In our model, the ancestral population was allowed to vary in population size until the initial population split, and then the two daughter populations were allowed to vary in size with symmetric migration, until the second divergence, after which all three populations were allowed to vary in size and experience symmetric migration. To investigate the order in which populations split, we shuffled the order of the populations for each analysis and then selected the model that demonstrated the maximum likelihood. We then performed 25 independent replicates for that model, chose the maximum-likelihood outcome and report the estimates for all of the parameters under that model (shown as ‘estimate’ in Tables S2 and S3, Supporting information). We assessed uncertainty by conducting 100 bootstrap replicates with replacement for that model, optimizing parameters for 25 iterations each. Bootstrap parameter distributions were mostly right skewed, and therefore, we report median values together with parametric parameters for log(10)-transformed data (mean and 95% confidence intervals). We discarded runs that failed to converge (after Excoffier et al. 2013), including all runs that failed to complete or where parameter values were continually increasing. Parameter estimates were converted to more meaningful demographic units by applying the mutation rate specified above, a sequence length of 1.45 Mb and a generation time of 25.7 years (Taylor et al. 2007).
Results
Neutral population structure
A total of 3281 variable SNPs could be confidently mapped to the killer whale reference genome (see Methodology), shared among 115 individuals (Genbank accessions: SAMN03020306–SAMN03020378; SAMN02820869–SAMN02820892; SAMN02820894–SAMN02820911). Using lositan (Antao et al. 2008), 347 SNPs were identified as outliers, 168 as being potentially under positive selection and 179 as being under balancing selection (Fig.2). Discriminate analysis of principal components (DAPC, Jombart et al. 2010) using only the neutral SNPs were able to correctly discriminate all ecotypes and geographical populations when population identity was included as a factor (Fig.3a). When there was no a priori population identification, only the Russian and Bering Sea resident populations grouped together (Fig.3b). From both FST (Table1) and FCA (Fig.4a), a hierarchical structure becomes apparent, such that ecotype clusters were more strongly identified than the differences among populations within ecotypes (Table1, Fig.3a). However, FCA could still discriminate population structure within ecotypes when they were analysed on their own (Fig. S1, Supporting information). This pattern is reinforced by comparisons based on pairwise allelic differences (Fig.5). Figure5 provides a heat map representation of this metric for all pairwise population comparisons and shows the distinction between comparisons among populations based on neutral loci (above diagonal) and those potentially under selection (below diagonal).
Figure 2.
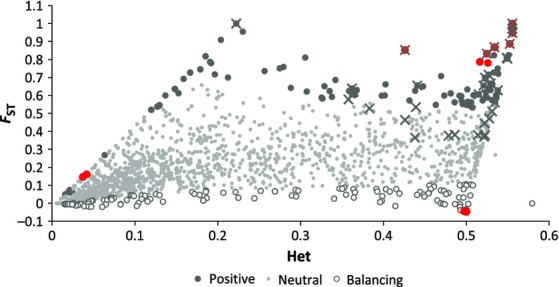
lositan plot identifying outlier SNPs based on neutral expectations. X's represent loci with fixed differences between two or more populations. Black dots (red online) indicate the best supported outlier loci (used for the gene ontology analyses). Het stands for heterozygosity.
Figure 3.
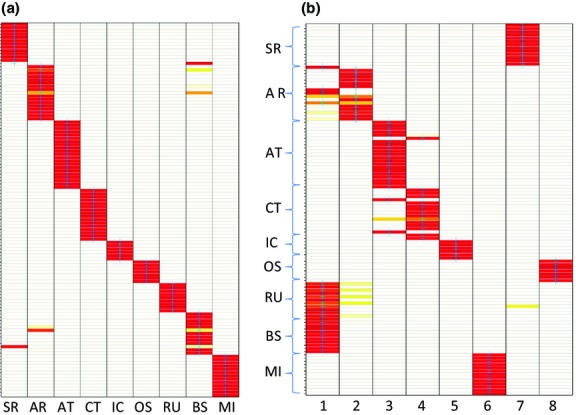
Discriminant analysis of principal components for neutral loci with (a) population identity assigned and (b) when the programme assigns clusters (see text for detailed parameters). Each bar represents a different individual, and darker grey (red online) indicates stronger assignment. Location abbreviations are as defined in Table2.
Table 1.
FST comparisons among populations where N > 10 for positive outlier loci (upper diagonal) and neutral loci (lower diagonal)
| SR | AR | BS | AT | CT | MI | |
|---|---|---|---|---|---|---|
| SR | 0 | 0.2475 | 0.21784 | 0.72847 | 0.73832 | 0.79715 |
| AR | 0.1632 | 0 | 0.05128 | 0.67336 | 0.6764 | 0.73618 |
| BS | 0.1363 | 0.04735 | 0 | 0.64762 | 0.64937 | 0.71197 |
| AT | 0.29719 | 0.26584 | 0.23356 | 0 | 0.05099 | 0.31034 |
| CT | 0.29339 | 0.25936 | 0.22429 | 0.0346 | 0 | 0.25045 |
| MI | 0.33442 | 0.30703 | 0.27442 | 0.17709 | 0.15502 | 0 |
All comparisons are highly significant (P < 0.001). Abbreviations are as defined in Table2.
Figure 4.
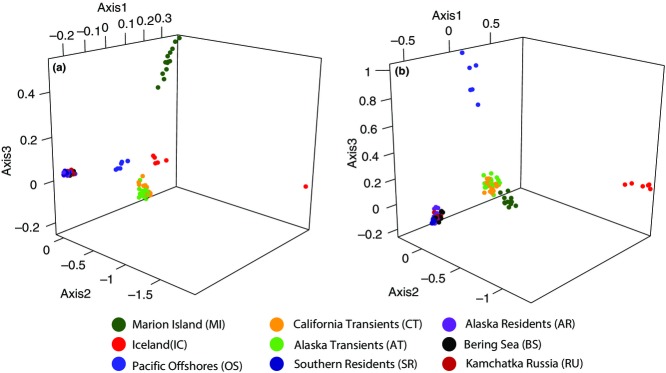
Factorial correspondence analysis of (a) neutral loci and (b) positive outliers. See online for a colour-coded version of the figure.
Figure 5.
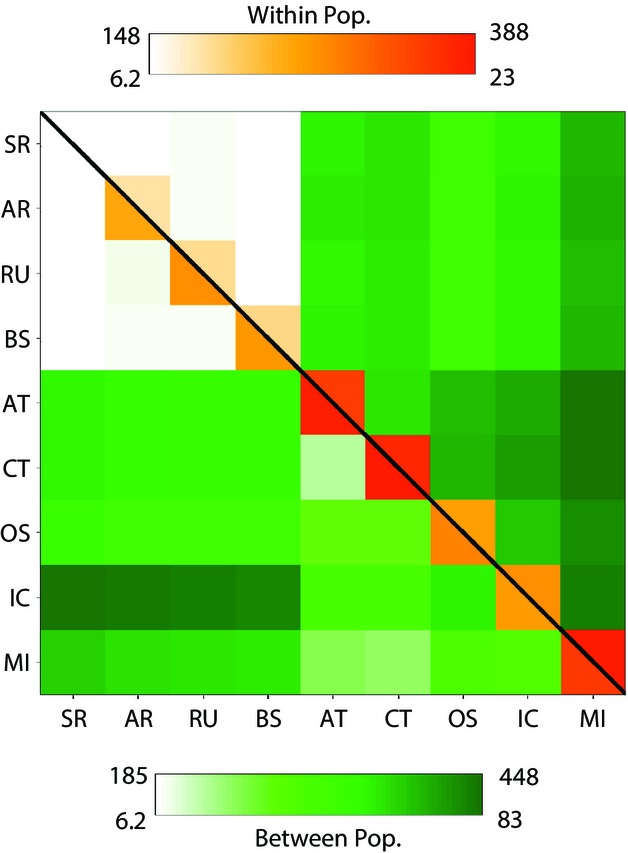
Heat map comparison of the number of allelic differences between neutral (above diagonal) and positively selected SNPs (below diagonal) within (along diagonal) and between populations identified in Fig.1. The grey-scale bars (colour online) indicate the range of values for neutral (above the scale bars) and outlier (below) SNPs.
Demographic inference
We assessed demographic history using neutral loci to better understand the process of differentiation among these populations. Our model testing in ∂a∂i (Gutenkunst et al. 2009) compared two trios of populations, MI, Alaskan transients (AT) and OS; and AT, OS and AR (see Methodology). MI was the ancestral population associated with the maximum likelihood for the first trio compared, and AT for the second (Tables S4 and S5, Supporting information; consistent with Moura et al. 2014a,b). Demographic analyses suggest that the common ancestor of MI, AT and OS was initially small and then grew before the MI population split. Both lineages then continued to grow until later declining, with the AT/OS lineages also declining (Fig.6a; see Table S2, Supporting information for Ne values and confidence limits). Migration during the two population period was relatively high and then declined after the split into three populations (Table S2, Supporting information).
Figure 6.
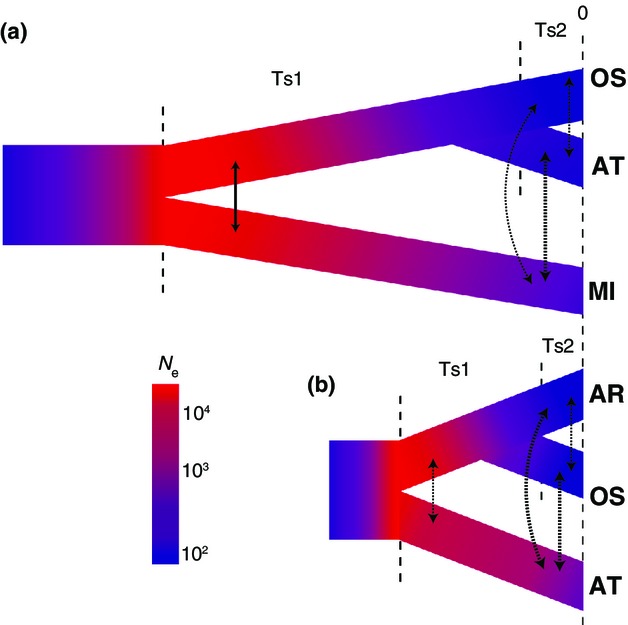
Analysis of demographic history of killer whales. (a) Analysis including Southern Ocean Marion Island (MI) population, Alaska transients (AT) and Offshores (OS). (b) Analysis including AT, OS and Alaska residents (AR). Grey-scale (colour online) approximately represents population size according to the key. Solid lines indicate migration rate >1 individual per generation, and stippled lines indicate rates <1, with thickness approximately representing migration rate. See Tables S4 and S5 (Supporting information) for parameter estimates. Ts stands for time segment, and Ne stands for effective population size.
In the second trio (Fig.6b; Table S3, Supporting information), the ancestral population grew until the split between AT and OS/AR, then AT declined (similar to the result from the first trio comparison). The OS/AR lineage grew until the split when both OS and AR declined. Migration was again higher during the 2-population phase, declining after that. The time frame of all modelled population divisions is estimated to be within the late Pleistocene or the Holocene (Tables S2 and S3, Supporting information), with the most recent period reflecting population decline and reduced migration. Details of all parameter estimates are given in Tables S2 and S3 (Supporting information), allele frequency spectra for maximum-likelihood (ML) runs are shown in Figs S2 and S3 (Supporting information), and the model fit is shown in illustrations in Figs S2 and S3 (Supporting information), with the residuals (rows 3 and 4) indicating a good fit.
Patterns of differentiation comparing neutral and outlier SNPs
SNPs identified as being under positive selection (showing high FST for a given level of diversity) generated distinct patterns of population structure compared to neutral markers. The FCAs of neutral loci suggest shared kinship between OS, the Icelandic population and transients, as suggested in earlier studies (Pilot et al. 2010), with the MI population being most differentiated. For the positive outlier loci, OS and Iceland become more differentiated and MI and transients more similar (Fig.4). We tested for quantitative evidence of distinct differentiation patterns comparing neutral and outlier loci, with respect to the two main ecotypes in the North Pacific, residents and transients. For measures of FST, we consider the following ratio for all possible pairwise combinations: the value of FST for population comparisons between resident and transient ecotypes/the value of FST for population comparisons within resident or transient ecotypes. For neutral loci, this average ratio is 4.15 (range = 1.34–8.59, N = 24), significantly lower than when only outlier loci are included (8.18, range = 2.61–14.48, N = 24, Z = −2.96, P = 0.003; Mann–Whitney U-test).
This same pattern was evident based on pairwise nucleotide differences (as illustrated in Fig.5) such that the magnitude of the ratio between ecotypes compared to within ecotypes was greater for the outlier loci (3.6-fold compared to 1.6-fold; χ2 = 51.06, P < 0.0001, d.f. = 1; Yate's correction applied). Comparing residents and transients against the other three groups combined (OS, IC and MI) for pairwise nucleotide differences also showed a distinct pattern for neutral compared to outlier loci. There was greater similarity between residents and the outgroups for neutral markers, but greater similarity between transients and the outgroups for outlier loci (Fig.5; χ2 = 75.4, P < 0.0001, d.f. = 1).
Fixed differences (marked with an ‘X’ in Fig.2) were found for both neutral and positive outlier loci in pairwise comparisons between putative populations, but were much more common for outlier loci (Table2). This will likely include outliers due to both selection and drift (see SNP mapping and genotyping). Overall, there were 33 SNPs showing fixed differences for one or more population comparisons; however, most sample sizes were small, and so only some showed this more often than may occur by chance (Tables2 and S6, Supporting information). From FCA of these SNPs, a pattern of four population clusters emerged: the North Pacific resident populations, the North Pacific transients together with the MI whales, the OS and the Icelandic sample (Fig. S4, Supporting information). There were more fixed difference loci than expected by chance (Table2) for comparisons between populations from each of these clusters; however, the number between residents and transients was relatively low and poorly supported. Among resident populations, SR (the ‘southern residents’ from Washington State waters) was most differentiated (Table2) and also showed the lowest level of within-population differentiation for both neutral and outlier loci (Fig.5).
Table 2.
Number of fixed differences between populations
| SR | AR | BS | RU | OS | AT | CT | IC | MI | |
|---|---|---|---|---|---|---|---|---|---|
| SR (13) | 0 | 0 | 0 | 8* | 7* | 5* | 15* | 9* | |
| AR (17) | 0 | 0 | 0 | 5* | 3 | 2 | 12* | 6* | |
| BS (13) | 0 | 0 | 0 | 5* | 3 | 2 | 9* | 5* | |
| RU (9) | 0 | 0 | 0 | 4* | 3 | 2 | 7* | 4* | |
| OS (7) | 5* | 1 | 0 | 0 | 1 | 1 | 7* | 2 | |
| AT (21) | 0 | 0 | 0 | 0 | 0 | 0 | 1 | 0 | |
| CT (16) | 0 | 0 | 0 | 0 | 0 | 0 | 0 | 0 | |
| IC (6) | 6* | 4* | 3 | 3 | 2 | 0 | 0 | 0 | |
| MI (13) | 2 | 0 | 0 | 0 | 0 | 0 | 0 | 0 |
Sample size given as (N). Neutral loci on lower diagonal, outliers (for positive selection) on upper diagonal. Comparisons that show a significant number of fixed differences beyond that expected from sampling effects by chance are shown with an asterisk. SR, southern (Washington State) residents; AR, Alaskan residents; BS, the Bering Sea residents; RU, the Kamchatka, Russia residents; AT, Alaskan transients; CT, Californian transients; IC, Iceland; MI, Marion Island; OS, Offshore.
Functional annotation of outlier and fixed difference SNPs
We considered possible linkage to known genes for the most extreme outliers (red dots in Fig.2; assigned as an outlier with a probability of 1; see Methodology) for loci under putative positive or balancing selection. Of 21 SNPs identified for balancing selection, only 3 loci were closely linked (defined here as within 5 kb, see Methodology) to a known gene, and these were associated especially with cell signalling (RAB43, BHLHB9, GRM7). Among those identified for positive selection, a higher proportion (11/19) were linked to genes associated with functions relevant to reproduction, growth and metabolism, among others (see Table S7, Supporting information). The genes linked to fixed difference SNPs again represented loci relevant to aspects of physiology, growth and reproduction (Table S8, Supporting information). There was just one locus where the fixed difference represented a nonsynonymous change within an exon. This was for GATA4 (at residue 187 changing a proline to a glutamine), a transcription factor involved in various functions including the development of cardiac tissue (Hu et al. 2010) and testes size/reproductive function (Kyrönlahti et al. 2011). The fixed difference at this locus was between the resident populations and all others.
We then considered the GO of these loci (all 24 unique loci identified as under strong positive selection or reflecting fixed differences as identified above) in the context of the proportional representation of GO terms compared to what may be expected by chance from a fully annotated reference genome (using the human genome due to the high-quality annotation; Table S9, Supporting information). The results show that 30 terms are significantly enriched compared to what would be expected by chance, including terms associated with the digestive and circulatory systems. Significantly enriched functions and the associated genes are listed in Table S9 (Supporting information), and the relevant genes marked in bold text in Tables S7 and S8 (Supporting information). Two transcription factor genes were associated with multiple enriched functional terms, GATA4 and MZF1.
Our tests for overrepresentation of GO terms in 10 random lists of genes linked to neutral loci (each of the same length as the list of genes putatively under selection) found no evidence of overrepresentation for a P-value after correction for false discovery of either 0.05 or 0.10. When we used genes associated with all SNP loci identified from our RAD analysis as the background instead of the full human genome, only four terms were overrepresented at a P-value of 0.05, but 32 at a P-value of 0.10, indicating that this comparison provided reduced power. GATA4 and MZF1 remained associated with multiple enriched terms.
Discussion
Population structure and demographic analyses
Summary statistics (FST and pairwise differences) and ordination analyses (DAPC and FCA) show strong differentiation both among ecotypes and among geographic populations within ecotypes at neutral loci, providing a finer level of resolution to the patterns found earlier in microsatellite DNA studies (Hoelzel et al. 2007; Parsons et al. 2013). In particular, in contrast to the earlier microsatellite DNA studies, all putative populations, including four parapatric resident populations within the North Pacific, can be genetically distinguished.
There was also evidence for hierarchical clusters that had not been clearly defined using microsatellite DNA data and that sometimes differ from inference previously gained from mtDNA genetic lineages (Hoelzel et al. 2002; Morin et al. 2010; Moura et al. 2014b). This inconsistency between inference from mtDNA and nuclear markers (e.g. a level of mtDNA similarity between residents and OS not seen for nuclear markers) had been noted in earlier studies using alternative methods (Pilot et al. 2010; Moura et al. 2014b), and is likely due to stochastic factors affecting the mtDNA lineages. The most coherent ordination clusters grouped populations by resident or transient ecotype in the North Pacific. Offshores, Iceland and MI were all clearly differentiated from the resident and transient clusters based on neutral loci. Demographic analyses concurred with the ordination analyses, as well as previous studies, indicating low migration rates between the sympatric transient and resident ecotypes.
Our temporal estimates of population differentiation (Tables S2 and S3, Supporting information) are broadly consistent with earlier microsatellite DNA estimates, suggesting that populations in the North Pacific differentiated during the relatively recent past (during the late Pleistocene and Holocene, Hoelzel et al. 2007). They support previous studies suggesting a higher mutation rate (3%/MY for the mitogenome; Ho & Lanfear 2010; Moura et al. 2013b) than used in published estimates of the time of initial division between transients in the North Pacific and other lineages worldwide (702 ka based on 0.3%/MY; Morin et al. 2010; Foote et al. 2011). Our calculation of divergence times is based on a published estimate for the average substitution rate in the Odontocete nuclear genome (see Methodology) and is more consistent with inference using the faster mtDNA mutation rate estimate. The timing is consistent with a signal for a population bottleneck during the last glacial period, as indicated from whole-genome analyses for individual killer whales from the North Pacific and North Atlantic (Moura et al. 2014a).
The demographic data presented in Fig.6 suggest a smaller ancestral population (possibly postbottleneck; Moura et al. 2014a) that was expanding at the time of the division between the Southern Ocean and North Pacific transient populations. If new habitat was being released (as would be the case following a glacial period) at the time of the establishment of the nearshore (resident) piscivorous ecotype, then this would be consistent with the evident later reduction in effective population size as founder populations were established. Low gene flow, kin associations in social groups, and the expansion of these new populations along matrilines would reinforce and exaggerate the degree of differentiation between the source and the newly established populations. The relatively high estimated level of gene flow after the initial split between MI and AT, and the subsequent reduction in gene flow, are consistent with this scenario and also consistent with recent divergence within the North Pacific. Inference from allele frequency spectra (as implemented in ∂a∂i) has known limitations (Myers et al. 2008), but also empirical support in comparison with known geologic or historical events (Gutenkunst et al. 2009; Zhao et al. 2013). In our case, comparable values are similar to those obtained by different methods in earlier studies (e.g. Hoelzel et al. 2007; Moura et al. 2014a).
Differentiation at putative selected SNPs
The pattern of differentiation among putative populations changes when positive outlier loci are considered on their own. For example, there is increased similarity among separate populations within each of the resident and transient ecotypes, and significantly greater differentiation between these two ecotypes (see Table1 and Fig.5). A similar pattern was seen for genotypes associated with freshwater or marine habitat in sticklebacks, such that loci under selection were more similar within ecotypes (Hohenlohe et al. 2010). However, the method chosen to identify outlier loci (lositan) has a high false discovery rate (Antao et al. 2008), which means that there are likely neutral loci among those identified as being under selection (while the identification of neutral loci should be relatively free of loci under selection). Therefore, the observed pattern could be expected either when loci under selection reflect genes that are associated with adaptation by ecotype, or if strong drift generates differentiation between ecotypes more than among other populations, or by some combination of both factors.
Because ecotype populations are among those used in identifying the outliers, an exaggerated pattern of drift could be seen in the outliers, although this effect should be similar for neutral loci. However, the comparison of each North Pacific ecotype (residents and transients) against outgroups (MI, Iceland and the OS) provided additional inference that there was exaggerated differentiation for outliers which more likely reflects differential selection among ecotypes. In this case, the outliers showed the opposite relationship to the outgroups compared to the neutral markers (Fig.5). It is also the case that strong outliers and fixed differences were associated with genes that have ecologically relevant functions (Tables S7–S9, Supporting information). Because of the potential for neutral loci being grouped with the outliers, we considered GO terms only for those outliers that were strongly supported (as identified by the program lositan, see Methodology), or associated with fixed differences between populations.
Killer whale ecotypes forage on different resources (although some populations may prey on multiple resource types; see Best et al. 2010; Foote et al. 2013), may have different metabolic requirements as a consequence and have different social structure (e.g. Ford et al. 1998; Beck et al. 2012), which may have implications for reproductive strategy including the potential for sperm competition. A total of 24 loci potentially under positive selection linked to SNPs were identified, and some of these did have functions consistent with relevant aspects of digestive physiology and reproductive biology (see Tables S7 and S8, Supporting information). Because this species has a demographic history involving population bottlenecks (see Hoelzel et al. 2002; Moura et al. 2014a), and a social structure that promotes kin association (although mating is typically outside of the social group, and kinship within social groups not substantially different than among regional social groups; Pilot et al. 2010; Ford et al. 2011), linkage blocks may be long. However, as an assessment of enrichment showed that some GO terms associated with genes from our list were significantly overrepresented (Table S9, Supporting information), the implication is that we are identifying loci that are relevant to selection. This is reinforced by the fact that random lists of genes linked to neutral SNPs showed no evidence for enrichment of GO terms. For the list of genes putatively under selection, there was significantly stronger overrepresentation than expected by chance for 30 GO terms, including terms associated with digestion (consistent with one key distinction among ecotypes).
We used the human genome as a reference as it is the best annotated mammalian genome and GO terms should be mostly species neutral (see Primmer et al. 2013). At the same time, the choice of an appropriate background reference list is important (Primmer et al. 2013), and in this case we contend that the full set of mammalian genes is appropriate, even though the outliers and fixed difference SNPs were chosen from among the loci identified from a subsample of sites provided by the RAD data. This subset provides a list that is expected to be representative, but is an order of magnitude smaller, and therefore only an approximate representation. When we compared against the RAD list, we found that there is lower power as expected, and although some GO terms associated with the same subset of genes are identified as potentially overrepresented, the resolution is too low for strong inference. When using the full human reference, there is a risk that enrichment would represent false positives, but that would imply finding enriched terms for our sets of random neutral loci, which we did not observe.
In general, differential patterns for positive outliers compared to neutral loci imply selection (for at least some loci among the outliers), although it was not possible to fully determine the nature of the adaptive differences. Distinct structure at outlier loci included MI being more similar to the transient populations, and Iceland (and to some extent OS) being more distinct from the residents. These are in each case comparisons within broad ecotype categories (as MI whales take pinnipeds as part of their diet as do transients, while OS, Icelandic and resident whales all feed on fish, see review in de Bruyn et al. 2013). While the implication from the increased similarity between transients and MI is consistent with shared ecotype, increased differentiation among the three fish-eating groups implies that there are additional factors beyond prey choice involved in the adaptation of these various populations to their different habitats (although phenotypic variation among these populations is not strong, and we do not know enough about the relevant genes to speculate further). The possibility of changing specializations over time in the North Atlantic would potentially be relevant (Foote et al. 2013). More generally, it is clear that it will be important to learn more about the characteristics that may reflect ecotype adaptation. Increasingly, studies have found that key differences in phenotype are likely to be related to gene regulation (Carroll 2005), and some of our results (e.g. with respect to GATA4 and MZF1) could be consistent with that.
Fixed differences and the question of taxonomy
Some further insight can be gained through the analysis of fixed differences among populations. These are differences that could be sustained either through an extended period of isolation and drift, by inbreeding, by strong selection or by sampling effects from small sample sizes. From our data, there is much stronger evidence for fixed differences at outlier than neutral loci, but these will likely include loci that are outliers due to drift as well as selection. The pattern of differentiation at the 33 fixed loci (based on FCA) emphasizes the clusters defined by the outlier loci in general. Transients cluster with MI, residents group together, and both OS and Iceland form independent clusters (Fig. S4, Supporting information, Table2). Among the fixed differences, 20 were within 5 kb of a functional locus with 16 being within or just outside the gene. The GO terms indicate functions associated with digestion, nutrient metabolism, protein metabolism, body development and reproduction (among other potentially relevant functions; see Table S8, Supporting information).
Just one locus showed a fixed difference at a nonsynonymous change within an exon, the transcription factor GATA4, and this reflected a fixed difference between the residents and all other groups. Among its various functions, GATA4 is involved in testis development in mice (Kyrönlahti et al. 2011). The highly stable social groups and apparent strategy for mating in temporary assemblages (Pilot et al. 2010) within the resident populations may be consistent with sperm competition, possibly promoted by changes at this locus. However, there are few relevant data on sperm competition in this species, and among 31 cetacean species the killer whale was ranked 13th for residual testes size (used as an index for the potential for sperm competition; MacLeod 2010). More work is needed to further explore the potential role of sperm competition.
The presence of fixed differences can raise questions about alpha taxonomy, although there is at present no clear expectation for what the proportion of fixed differences that defines a species-level difference might be, and the range of observed values is broad. Empirical observations for allozyme markers suggested that distinct species can be expected to exhibit fixed differences at approximately 15% of loci analysed (O'Donnell et al. 2004). However, a genomic study comparing two closely related flycatcher species of the genus Ficedula (with a 2 Ma most common recent ancestor, but still exhibiting limited hybridization) found that only 1.8% of all segregating sites identified were fixed between the two species (Ellegren et al. 2012). The percentages of fixed differences between killer whale populations were typically much smaller (e.g. average values for resident populations vs. Iceland = 0.328%; residents vs. all others = 0.177%; residents vs. transients = 0.103%). There is only one SNP showing a fixed difference between all individuals of one ecotype (residents) and all others, and that was GATA4 (which also shows a nonsynonymous change). The SR show more pronounced fixed differences (Table2) and less differentiation within the population compared to other putative populations (Pilot et al. 2010; Fig.5). Earlier studies using nonequilibrium models showed support for gene flow between residents and transients following a point of division (Hoelzel et al. 2007); however, our RAD data suggest that this may have been mostly during the period soon after division (consistent with the temporal data about migration shown in Table S3, Supporting information).
Conclusions
As discussed in earlier studies (Hoelzel et al. 2007), regional killer whale populations can be small and evidently composed of an extended matriline, likely founded by one or a few stable social groups. The SR are an extreme example of this. For this reason, it is appropriate to be cautious about the interpretation of fixed differences, as these could be promoted relatively quickly by drift when Ne is small. Earlier studies have proposed everything from relatively recent (Holocene) population differentiation (e.g. Hoelzel et al. 2007) to species-level differences established in the middle Pleistocene (Morin et al. 2010), and we do not propose to fully resolve the question of alpha taxonomy here. However, the time frame implied from our RAD data and from the demographic profiles generated from nuclear genomes (Moura et al. 2014a) suggests relatively recent events. The data on population structure based on outlier loci and the significant overrepresentation of biologically relevant GO terms suggest that natural selection has contributed to the degree of differentiation among populations of different ecotypes in the North Pacific. Taken together, these data suggest that differentiation in sympatry is based in part on ecological processes, but that differentiation is likely being facilitated by the life history of killer whales, founder events and differentiation by drift. Both the demographic analyses and the small proportion of fixed differences suggest that if incipient speciation is the correct interpretation, it began very recently and is ongoing.
Acknowledgments
This study was funded by the Natural Environment Research Council UK (Grant Number NE/014443/1). The Department of Environmental Affairs supplied logistic support within the South African National Antarctic Programme for work done at Marion Island. Financial support for field assistance was provided by the South African Department of Science and Technology, through the National Research Foundation (NRF), in support of the Marine Mammal Programme of the MRI. We thank the Baylor College of Medicine and the Centre for GeoGenetics in Copenhagen for provision through NCBI of the ANOL00000000 genome sequence for reference prior to its publication. We thank Ken Balcomb, Mike Bigg, Nancy Black, Vladimir Burkanov, Andy Dizon, Dave Ellifrit, Mike Ford, Jeff Foster, Rich Osborne, Jen Schorr and Jóhann Sigurjónsson for earlier contributions to our killer whale DNA archive.
A.R.H. designed the study, A.E.M. and A.R.H. carried out the analyses, interpreted the results and wrote the manuscript, J.G.K., R.C., M.A.H. and N.H. produce the genomic data used in the study, A.W. contributed to the analyses and writing, R.R.R., P.J.N.B. and M.E.D. contributed with biological material and killer whale expertise, and all authors read draft versions of the manuscript.
Data accessibility
DNA sequences: Genbank accessions: SAMN03020306–SAMN03020378; SAMN02820869–SAMN02820892; SAMN02820894–SAMN02820911. VCF files for SNP data: Dryad doi: 10.5061/dryad.qk22t.
Supporting Information
Additional supporting information may be found in the online version of this article.
Number of samples used in this study by predefined population.
Table S2 Demographic estimates from ∂a∂i for the MI/AT/OS analysis.
Table S3 Demographic estimates from ∂a∂i for the AT/OS/AR analysis.
Table S4 Model comparisons for order of population splitting for the MI, AT, OS analysis.
Table S5 Model comparisons for order of population splitting for the AT, OS, AR analysis.
Table S6 Probability that observed fixed differences between population pairs were significant (bold and italics).
Table S7 Genes listed by putative functions based on GO terms linked to strong outlier SNPs for positive selection (genes in bold show significant over-representation compared to reference GO terms; see Table S9).
Table S8 Genes listed by putative functions based on GO terms linked to SNPs associated with fixed differences among putative populations (genes in bold show significant over-representation compared to reference GO terms; see Table S9).
Table S9 List of significantly enriched GO terms as compared to the proportions in the human reference genome.
Fig. S1 (a) FCA of resident populations on their own using neutral markers and (b) the same for transient populations.
Fig. S2 Pairwise comparisons of the allele frequency spectrum of the observed data (top row) versus the model (second row) and plots of the residuals (third and fourth rows) from ∂a∂i for the MI, AT, OS analysis.
Fig. S3 Pairwise comparisons of the allele frequency spectrum of the observed data (top row) versus the model (second row) and plots of the residuals (third and fourth rows) from ∂a∂i for the AT, OS, AR analysis.
Fig. S4 Individual FCA plot using the 33 SNPs that were fixed for a single allele in at least one a priori population.
References
- Al-Shahrour F, Minguez P, Tarraga J, et al. FatiGO+: a functional profiling tool for genomic data. Integration of functional annotation, regulatory motifs and interaction data with microarray experiments. Nucleic Acids Research. 2007;35:W91–W96. doi: 10.1093/nar/gkm260. [DOI] [PMC free article] [PubMed] [Google Scholar]
- Alvarado Bremer JR, Viñas J, Mejuto J, Ely B, Pla C. Comparative phylogeography of Atlantic bluefin tuna and swordfish: the combined effects of vicariance, secondary contact, introgression, and population expansion on the regional phylogenies of two highly migratory pelagic fishes. Molecular Phylogenetics and Evolution. 2005;36:169–187. doi: 10.1016/j.ympev.2004.12.011. [DOI] [PubMed] [Google Scholar]
- Amaral AR, Beheregaray LB, Bilgmann K, et al. Seascape genetics of a globally distributed, highly mobile marine mammal: the short-beaked common dolphin (genus Delphinus) PLoS ONE. 2012;7:e31482. doi: 10.1371/journal.pone.0031482. [DOI] [PMC free article] [PubMed] [Google Scholar]
- Antao T, Lopes A, Lopes RJ, Beja-Pereira A, Luikart G. LOSITAN: a workbench to detect molecular adaptation based on a Fst-outlier method. BMC Bioinformatics. 2008;9:323. doi: 10.1186/1471-2105-9-323. [DOI] [PMC free article] [PubMed] [Google Scholar]
- Atarhouch T, Rami M, Naciri M, Dakkak A. Genetic population structure of sardine (Sardina pilchardus) off Morocco detected with intron polymorphism (EPIC-PCR) Marine Biology. 2007;V150:521–528. [Google Scholar]
- Baird NA, Etter PD, Atwood TS, et al. Rapid SNP Discovery and Genetic Mapping Using Sequenced RAD Markers. PLoS ONE. 2008;3:e3376. doi: 10.1371/journal.pone.0003376. [DOI] [PMC free article] [PubMed] [Google Scholar]
- Beck S, Kuningas S, Esteban R, Foote AD. The influence of ecology on sociality in the killer whale. Behavioral Ecology. 2012;23:246–253. [Google Scholar]
- Beheregaray LB, Sunnucks P. Fine-scale genetic structure, estuarine colonization and incipient speciation in the marine silverside fish Odontesthes argentinensis. Molecular Ecology. 2001;10:2849–2866. doi: 10.1046/j.1365-294x.2001.t01-1-01406.x. [DOI] [PubMed] [Google Scholar]
- Best PB, Me er MA, Lockyer C. Killer whales in South African waters–a review of their biology. African Journal of Marine Science. 2010;32:171–186. [Google Scholar]
- Bierne N, Bonhomme F, David P. Habitat preference and the marine-speciation paradox. Proceedings of the Royal Society of London. Series B, Biological Sciences. 2003;270:1399–1406. doi: 10.1098/rspb.2003.2404. [DOI] [PMC free article] [PubMed] [Google Scholar]
- Bowen BW, Rocha LA, Toonen RJ, Karl SA. The origins of tropical marine biodiversity. Trends in Ecology & Evolution. 2013;28:359–366. doi: 10.1016/j.tree.2013.01.018. [DOI] [PubMed] [Google Scholar]
- de Bruyn M, Nugroho E, Hossain MM, Wilson JC, Mather PB. Phylogeographic evidence for the existence of an ancient biogeographic barrier: the Isthmus of Kra Seaway. Heredity. 2005;94:370–378. doi: 10.1038/sj.hdy.6800613. [DOI] [PubMed] [Google Scholar]
- de Bruyn PJN, Tosh CA, Terauds A. Killer whale ecotypes: is there a global model? Biological Reviews. 2013;88:62–80. doi: 10.1111/j.1469-185X.2012.00239.x. [DOI] [PubMed] [Google Scholar]
- Carroll SB. Evolution at two levels: on genes and form. PLoS Biology. 2005;3:e245. doi: 10.1371/journal.pbio.0030245. [DOI] [PMC free article] [PubMed] [Google Scholar]
- Danecek P, Auton A, Abecasis G, et al. The variant call format and VCFtools. Bioinformatics. 2011;27:2156–2158. doi: 10.1093/bioinformatics/btr330. [DOI] [PMC free article] [PubMed] [Google Scholar]
- Deecke VB, Ford JKB, Slater PJB. The vocal behaviour of mammal-eating killer whales: communicating with costly calls. Animal Behaviour. 2005;69:395–405. [Google Scholar]
- DePristo MA, Banks E, Poplin R, et al. A framework for variation discovery and genotyping using next-generation DNA sequencing data. Nature Genetics. 2011;43:491–498. doi: 10.1038/ng.806. [DOI] [PMC free article] [PubMed] [Google Scholar]
- Domingues VS, Santos RS, Brito A, Alexandrou M, Almada VC. Mitochondrial and nuclear markers reveal isolation by distance and effects of Pleistocene glaciations in the northeastern Atlantic and Mediterranean populations of the white seabream (Diplodus sargus, L.) Journal of Experimental Marine Biology and Ecology. 2007;346:102–113. [Google Scholar]
- Domingues VS, Stefanni S, Brito A, Santos RS, Almada VC. Phylogeography and demography of the Blenniid Parablennius parvicornis and its sister species P. sanguinolentus from the northeastern Atlantic Ocean and the western Mediterranean Sea. Molecular Phylogenetics and Evolution. 2008;46:397–402. doi: 10.1016/j.ympev.2007.05.022. [DOI] [PubMed] [Google Scholar]
- Dornburg A, Brandley MC, McGowen MR, Near TJ. Relaxed clocks and inferences of heterogeneous patterns of nucleotide substitution and divergence time estimates across whales and dolphins (Mammalia: Cetacea) Molecular Biology and Evolution. 2012;29:721–736. doi: 10.1093/molbev/msr228. [DOI] [PubMed] [Google Scholar]
- Ellegren H, Smeds L, Burri R, et al. The genomic landscape of species divergence in Ficedula flycatchers. Nature. 2012;491:756–760. doi: 10.1038/nature11584. [DOI] [PubMed] [Google Scholar]
- Excoffier L, Laval G, Schneider S. Arlequin ver. 3.0: an integrated software package for population genetics data analysis. Evolutionary Bioinformatics Online. 2005;1:47–50. [PMC free article] [PubMed] [Google Scholar]
- Excoffier L, Dupanloup I, Huerta-Sanchez E, Sousa VC, Foll M. Robust demographic inference from genomic and SNP data. PLoS Genetics. 2013;9:e1003905. doi: 10.1371/journal.pgen.1003905. [DOI] [PMC free article] [PubMed] [Google Scholar]
- Foote AD, Morin PA, Durban JW, Willerslev E, Orlando L, Gilbert MTP. Out of the Pacific and back again: insights into the matrilineal history of Pacific killer whale ecotypes. PLoS ONE. 2011;6:e24980. doi: 10.1371/journal.pone.0024980. [DOI] [PMC free article] [PubMed] [Google Scholar]
- Foote AD, Newton J, Avila-Arcos MC, et al. Tracking niche variation over millenial timescales in sympatric killer whale lineages. Proceedings. Biological sciences/The Royal Society. 2013;280:20131481. doi: 10.1098/rspb.2013.1481. [DOI] [PMC free article] [PubMed] [Google Scholar]
- Ford JKB, Ellis GM, Barrett-Lennard LG, Morton AB, Palm RS, Balcomb Iii KC. Dietary specialization in two sympatric populations of killer whales (Orcinus orca) in coastal British Columbia and adjacent waters. Canadian Journal of Zoology. 1998;76:1456–1471. [Google Scholar]
- Ford JKB, Ellis GM, Balcomb KC. Killer Whales: The Natural History and Genealogy of Orcinus orca in British Columbia and Washington State. Vancouver, British Columbia: UBC Press; 2000. [Google Scholar]
- Ford MJ, Hanson MB, Hempelmann JA, et al. Inferred paternity and male reproductive success in a killer whale (Orcinus orca) population. Journal of Heredity. 2011;102:537–553. doi: 10.1093/jhered/esr067. [DOI] [PubMed] [Google Scholar]
- Gutenkunst RN, Hernandez RD, Williamson SH, Bustamante CD. Inferring the joint demographic history of multiple populations from multidimensional SNP frequency data. PLoS Genetics. 2009;5:e1000695. doi: 10.1371/journal.pgen.1000695. [DOI] [PMC free article] [PubMed] [Google Scholar]
- Ho SY, Lanfear R. Improved characterisation of among-lineage rate variation in cetacean mitogenomes using codon-partitioned relaxed clocks. Mitochondrial DNA. 2010;21:138–146. doi: 10.3109/19401736.2010.494727. [DOI] [PubMed] [Google Scholar]
- Hoelzel AR. Evolution of population structure in marine mammals. In: Bertorelle G, Bruford MW, Hauffe HC, Rizzoli A, Vernesi C, editors. Population Genetics for Animal Conservation. Cambridge: Cambridge University Press; 2009. pp. 294–319. [Google Scholar]
- Hoelzel AR, Natoli A, Dahlheim ME, Olavarria C, Baird RW, Black NA. Low worldwide genetic diversity in the killer whale (Orcinus orca): implications for demographic history. Proceedings of the Royal Society B. Biological sciences. 2002;269:1467–1473. doi: 10.1098/rspb.2002.2033. [DOI] [PMC free article] [PubMed] [Google Scholar]
- Hoelzel AR, Hey J, Dahlheim ME, Nicholson C, Burkanov V, Black N. Evolution of population structure in a highly social top predator, the Killer Whale. Molecular Biology and Evolution. 2007;24:1407–1415. doi: 10.1093/molbev/msm063. [DOI] [PubMed] [Google Scholar]
- Hohenlohe PA, Bassham S, Etter PD, Stiffler N, Johnson EA, Cresko WA. Population genomics of parallel adaptation in threespine stickleback using sequenced RAD tags. PLoS Genetics. 2010;6:e1000862. doi: 10.1371/journal.pgen.1000862. [DOI] [PMC free article] [PubMed] [Google Scholar]
- Hu D-L, Chen F-K, Liu Y-Q, et al. GATA-4 promotes the differentiation of P19 cells into cardiac myocytes. International Journal of Molecular Medicine. 2010;26:365–372. [PubMed] [Google Scholar]
- Hwang DG, Green P. Bayesian Markov chain Monte Carlo sequence analysis reveals varying neutral substitution patterns in mammalian evolution. Proceedings of the National Academy of Sciences, USA. 2004;101:13994–14001. doi: 10.1073/pnas.0404142101. [DOI] [PMC free article] [PubMed] [Google Scholar]
- Jombart T, Ahmed I. Adegenet 1.3-1: new tools for the analysis of genome-wide SNP data. Bioinformatics. 2011;27:3070–3071. doi: 10.1093/bioinformatics/btr521. [DOI] [PMC free article] [PubMed] [Google Scholar]
- Jombart T, Devillard S, Balloux F. Discriminant analysis of principal components: a new method for the analysis of genetically structured populations. BMC Genetics. 2010;11:94. doi: 10.1186/1471-2156-11-94. [DOI] [PMC free article] [PubMed] [Google Scholar]
- Jorgensen HBH, Hansen MM, Bekkevold D, Ruzzante DE, Loeschcke V. Marine landscapes and population genetic structure of herring (Clupea harengus L.) in the Baltic Sea. Molecular Ecology. 2005;14:3219–3234. doi: 10.1111/j.1365-294X.2005.02658.x. [DOI] [PubMed] [Google Scholar]
- Krahn MM, Herman DP, Matkin CO, et al. Use of chemical tracers in assessing the diet and foraging regions of eastern North Pacific killer whales. Marine Environment Research. 2007;63:91–114. doi: 10.1016/j.marenvres.2006.07.002. [DOI] [PubMed] [Google Scholar]
- Kyrönlahti A, Euler R, Bielinska M, et al. GATA4 regulates Sertoli cell function and fertility in adult male mice. Molecular and Cellular Endocrinology. 2011;333:85–95. doi: 10.1016/j.mce.2010.12.019. [DOI] [PMC free article] [PubMed] [Google Scholar]
- Li H, Durbin R. Fast and accurate short read alignment with Burrows-Wheeler transform. Bioinformatics. 2009;25:1754–1760. doi: 10.1093/bioinformatics/btp324. [DOI] [PMC free article] [PubMed] [Google Scholar]
- MacLeod CD. The relationship between body mass and relative investment in testes mass in cetaceans: implications for inferring interspecfic variations in the extent of sperm competition. Marine Mammal Science. 2010;26:370–380. [Google Scholar]
- McGowen MR, Spaulding M, Gatesy J. Divergence date estimation and a comprehensive molecular tree of extant cetaceans. Molecular Phylogenetics and Evolution. 2009;53:891–906. doi: 10.1016/j.ympev.2009.08.018. [DOI] [PubMed] [Google Scholar]
- McKenna A, Hanna M, Banks E, et al. The Genome Analysis Toolkit: a MapReduce framework for analyzing next-generation DNA sequencing data. Genome Research. 2010;20:1297–1303. doi: 10.1101/gr.107524.110. [DOI] [PMC free article] [PubMed] [Google Scholar]
- Medina I, Carbonell J, Pulido L, et al. Babelomics: an integrative platform for the analysis of transcriptomics, proteomics and genomic data with advanced functional profiling. Nucleic Acids Research. 2010;38:W210–W213. doi: 10.1093/nar/gkq388. [DOI] [PMC free article] [PubMed] [Google Scholar]
- Mendez M, Subramaniam A, Collins T, et al. Molecular ecology meets remote sensing: environmental drivers to population structure of humpback dolphins in the Western Indian Ocean. Heredity. 2011;107:349–361. doi: 10.1038/hdy.2011.21. [DOI] [PMC free article] [PubMed] [Google Scholar]
- Möller L, Valdez FP, Allen S, Bilgmann K, Corrigan S, Beheregaray LB. Fine-scale genetic structure in short-beaked common dolphins (Delphinus delphis) along the East Australian Current. Marine Biology. 2010;158:113–126. [Google Scholar]
- Morin PA, Archer FI, Foote AD, et al. Complete mitochondrial genome phylogeographic analysis of killer whales (Orcinus orca) indicates multiple species. Genome Research. 2010;20:908–916. doi: 10.1101/gr.102954.109. [DOI] [PMC free article] [PubMed] [Google Scholar]
- Moura AE, Natoli A, Rogan E, Hoelzel AR. Atypical panmixia in a European dolphin species (Delphinus delphis): implications for the evolution of diversity across oceanic boundaries. Journal of Evolutionary Biology. 2013a;26:63–75. doi: 10.1111/jeb.12032. [DOI] [PubMed] [Google Scholar]
- Moura AE, Nielsen SCA, Vilstrup JT, et al. Recent diversification of a marine genus (Tursiops spp.) tracks habitat preference and environmental change. Systematic Biology. 2013b;62:865–877. doi: 10.1093/sysbio/syt051. [DOI] [PubMed] [Google Scholar]
- Moura AE, Janse van Rensburg C, Pilot M, et al. Killer whale nuclear genome and mtDNA reveals widespread population bottleneck during the last glacial maximum. Molecular Biology and Evolution. 2014a;31:1121–1131. doi: 10.1093/molbev/msu058. [DOI] [PMC free article] [PubMed] [Google Scholar]
- Moura AE, Kenny JG, Chaudhuri R, et al. Phylogenomics of the killer whale indicates ecotype divergence in sympatry. Heredity. 2014b doi: 10.1038/hdy.2014.67. doi:10.1038/hdy.2014.67. [DOI] [PMC free article] [PubMed] [Google Scholar]
- Myers S, Fefferman C, Patterson N. Can one learn history from the allelic spectrum? Theoretical Population Biology. 2008;73:342–348. doi: 10.1016/j.tpb.2008.01.001. [DOI] [PubMed] [Google Scholar]
- Naciri M, Lemaire C, Borsa P, Bonhomme F. Genetic study of the Atlantic/Mediterranean transition in sea bass (Dicentrarchus labrax) Journal of Heredity. 1999;90:591–596. [Google Scholar]
- Nash D, Nair S, Mayxay M, et al. Selection strength and hitchhiking around two anti-malarial resistance genes. Proceedings of the Royal Society B: Biological Sciences. 2005;272:1153–1161. doi: 10.1098/rspb.2004.3026. [DOI] [PMC free article] [PubMed] [Google Scholar]
- Natoli A, Birkun A, Aguilar A, Lopez A, Hoelzel AR. Habitat structure and the dispersal of male and female bottlenose dolphins (Tursiops truncatus) Proceedings of the Royal Society B. Biological sciences. 2005;272:1217–1226. doi: 10.1098/rspb.2005.3076. [DOI] [PMC free article] [PubMed] [Google Scholar]
- Natoli A, Cañadas A, Peddemors VM, et al. Phylogeography and alpha taxonomy of the common dolphin (Delphinus sp.) Journal of Evolutionary Biology. 2006;19:943–954. doi: 10.1111/j.1420-9101.2005.01033.x. [DOI] [PubMed] [Google Scholar]
- O'Donnell K, Ward TJ, Geiser DM, Corby Kistler H, Aoki T. Genealogical concordance between the mating type locus and seven other nuclear genes supports formal recognition of nine phylogenetically distinct species within the Fusarium graminearum clade. Fungal Genetics and Biology. 2004;41:600–623. doi: 10.1016/j.fgb.2004.03.003. [DOI] [PubMed] [Google Scholar]
- Palumbi SR, Lessios HA. Evolutionary animation: how do molecular phylogenies compare to Mayr's reconstruction of speciation patterns in the sea? Proceedings of the National Academy of Sciences, USA. 2005;102:6566–6572. doi: 10.1073/pnas.0501806102. [DOI] [PMC free article] [PubMed] [Google Scholar]
- Parsons KM, Durban JW, Burdin AM, et al. Geographic patterns of genetic differentiation among killer whales in the northern North Pacific. Journal of Heredity. 2013;104:737–754. doi: 10.1093/jhered/est037. [DOI] [PubMed] [Google Scholar]
- Pilot M, Dahlheim ME, Hoelzel AR. Social cohesion among kin, gene flow without dispersal and the evolution of population genetic structure in the killer whale (Orcinus orca) Journal of Evolutionary Biology. 2010;23:20–31. doi: 10.1111/j.1420-9101.2009.01887.x. [DOI] [PubMed] [Google Scholar]
- Primmer CR, Papakostas S, Leder EH, Davis MJ, Ragan MA. Annotated genes and nonannotated genomes: cross-species use of gene ontology in ecology and evolution research. Molecular Ecology. 2013;22:3216–3241. doi: 10.1111/mec.12309. [DOI] [PubMed] [Google Scholar]
- Puckridge M, Last PR, White WT, Andreakis N. Phylogeography of the Indo-West Pacific maskrays (Dasyatidae,Neotrygon): a complex example of chondrichthyan radiation in the Cenozoic. Ecology and Evolution. 2012;3:217–232. doi: 10.1002/ece3.448. [DOI] [PMC free article] [PubMed] [Google Scholar]
- Ruzzante DE, Taggart CT, Cook C, Goddard S. Genetic differentiation between inshore and offshore Atlantic cod (Gadus morhua) off Newfoundland: microsatellite DNA variation and antifreeze level. Canadian Journal of Fisheries and Aquatic Sciences. 1996;53:634–645. [Google Scholar]
- Sherman BT, Huang D, Tan Q, et al. DAVID Knowledgebase: a gene-centered database integrating heterogeneous gene annotation resources to facilitate high-throughput gene functional analysis. BMC Bioinformatics. 2007;8:426. doi: 10.1186/1471-2105-8-426. [DOI] [PMC free article] [PubMed] [Google Scholar]
- Shimada Y, Shikano T, Merila J. A high incidence of selection on physiologically important genes in the three-spined stickleback, Gasterosteus aculeatus. Molecular Biology and Evolution. 2011;28:181–193. doi: 10.1093/molbev/msq181. [DOI] [PubMed] [Google Scholar]
- Taylor BL, Chivers SJ, Larese JP, Perrin WF. Generation length and percent mature estimates for IUCN assessments of cetaceans. NOAA, NMFS, Southwest Fisheries Science Center Administrative Report LJ-07-01. 2007. p. 21.
- Tringali M. Molecular Phylogenetics and Ecological diversification of the transisthmian fish genus Centropomus (Perciformes: Centropomidae) Molecular Phylogenetics and Evolution. 1999;13:193–207. doi: 10.1006/mpev.1999.0624. [DOI] [PubMed] [Google Scholar]
- White TA, Stamford J, Rus Hoelzel A. Local selection and population structure in a deep-sea fish, the roundnose grenadier (Coryphaenoides rupestris) Molecular Ecology. 2010;19:216–226. doi: 10.1111/j.1365-294X.2009.04446.x. [DOI] [PubMed] [Google Scholar]
- Yoshida H, Yoshioka M, Shirakihara M, Chow S. Population structure of finless porpoises (Neophocaena phocaenoides) in coastal waters of Japan based on mitochondrial DNA sequences. Journal of Mammalogy. 2001;82:123–130. [Google Scholar]
- Yurk H, Barrett-Lennard L, Ford JK, Matkin CO. Cultural transmission within maternal lineages: vocal clans in resident killer whales in southern Alaska. Animal Behaviour. 2002;63:1103–1119. [Google Scholar]
- Zhao S, Zheng P, Dong S, et al. Whole-genome sequencing of giant pandas provides insights into demographic history and local adaptation. Nature Genetics. 2013;45:67–71. doi: 10.1038/ng.2494. [DOI] [PubMed] [Google Scholar]
Associated Data
This section collects any data citations, data availability statements, or supplementary materials included in this article.
Supplementary Materials
Number of samples used in this study by predefined population.
Table S2 Demographic estimates from ∂a∂i for the MI/AT/OS analysis.
Table S3 Demographic estimates from ∂a∂i for the AT/OS/AR analysis.
Table S4 Model comparisons for order of population splitting for the MI, AT, OS analysis.
Table S5 Model comparisons for order of population splitting for the AT, OS, AR analysis.
Table S6 Probability that observed fixed differences between population pairs were significant (bold and italics).
Table S7 Genes listed by putative functions based on GO terms linked to strong outlier SNPs for positive selection (genes in bold show significant over-representation compared to reference GO terms; see Table S9).
Table S8 Genes listed by putative functions based on GO terms linked to SNPs associated with fixed differences among putative populations (genes in bold show significant over-representation compared to reference GO terms; see Table S9).
Table S9 List of significantly enriched GO terms as compared to the proportions in the human reference genome.
Fig. S1 (a) FCA of resident populations on their own using neutral markers and (b) the same for transient populations.
Fig. S2 Pairwise comparisons of the allele frequency spectrum of the observed data (top row) versus the model (second row) and plots of the residuals (third and fourth rows) from ∂a∂i for the MI, AT, OS analysis.
Fig. S3 Pairwise comparisons of the allele frequency spectrum of the observed data (top row) versus the model (second row) and plots of the residuals (third and fourth rows) from ∂a∂i for the AT, OS, AR analysis.
Fig. S4 Individual FCA plot using the 33 SNPs that were fixed for a single allele in at least one a priori population.
Data Availability Statement
DNA sequences: Genbank accessions: SAMN03020306–SAMN03020378; SAMN02820869–SAMN02820892; SAMN02820894–SAMN02820911. VCF files for SNP data: Dryad doi: 10.5061/dryad.qk22t.