Abstract
Cancer cell line studies have long been used to test efficacy of therapeutic agents and to explore genomic factors predictive of response1,2. Two large-scale pharmacogenomic studies were published recently3,4; each assayed a panel of several hundred cancer cell lines for gene expression, copy number, genome sequence, and pharmacological response to multiple anti-cancer drugs. The resulting datasets present a unique opportunity to characterize mechanisms associated with drug response, with 471 cell lines and 15 drugs assayed in both. However, while gene expression is well correlated between studies, the measured pharmacologic drugs response is highly discordant. This poor correspondence is surprising as both studies assessed drug response using common estimators: the IC50 (concentration at which the drug inhibited 50% of the maximal cellular growth), and the AUC (area under the activity curve measuring dose response)5. For drugs screened in both studies, only one had a Spearman correlation coefficient in measured response greater than 0.6. Importantly these results are also reflected in inconsistent associations between genomic features and drug response. Although the source of inconsistencies in drug response measures between these two well-controlled studies remains uncertain, it makes drawing firm conclusions about response very difficult and has potential implications for using these outcome measures to assess gene-drug relationships or select potential anti-cancer drugs based on their reported results. Our findings suggest standardization of response measurement protocols in pharmacogenomic studies is essential before such studies can live up to their promise.
Patients with cancer often exhibit heterogeneous responses to anticancer treatments and evidence suggests response is determined in part by patient-specific alterations in the somatic cancer genome and changes in gene expression6. A number of studies have searched for gene expression signatures predictive of response, however most only tested a limited number of genes, a small panel of drugs, or assayed drug response in a small number of cell lines1,7,8.
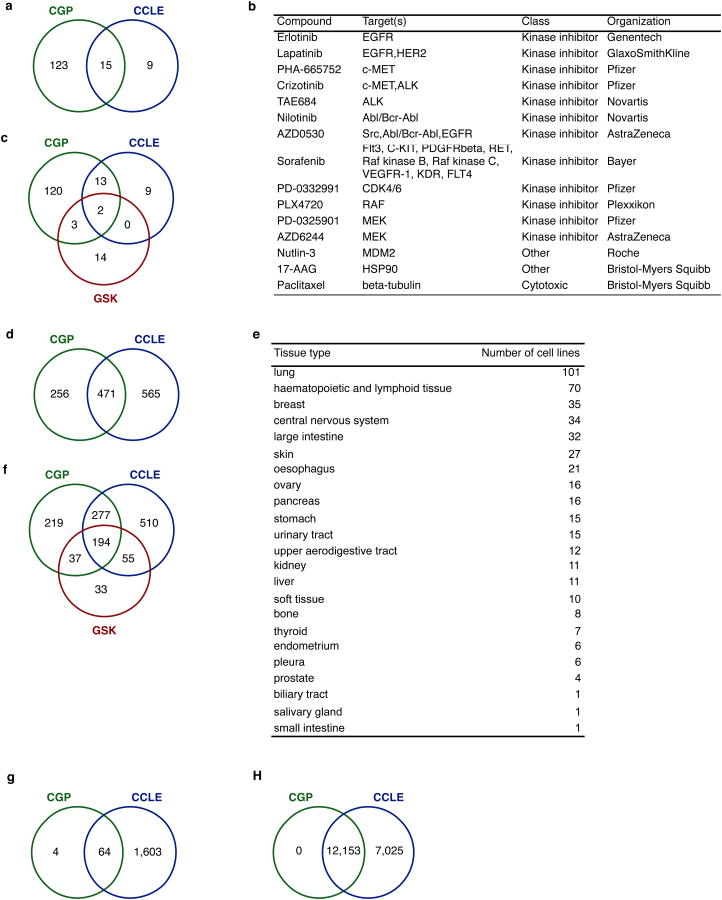
Results from two large-scale pharmacogenomic studies, the Cancer Genome Project (CGP)4 and the Cancer Cell line Encyclopedia (CCLE)3, were recently reported in this journal. The CGP tested 138 anti-cancer drugs against 727 cell lines while the CCLE tested response of 24 drugs against 1036 cell lines (Extended Data Figure 1); of these, 15 drugs (Extended Data Figure 1a,b) and 471 cell lines were tested in both (Extended Data Figure 1d,e). Both groups tested mutations in 64 genes (Extended Data Figure 1g) and expression of 12,153 genes (Extended Data Figure 1h) genes. The overlap allows assessment of consistency between these independent datasets and the potential to infer genomic models predictive of drug response.
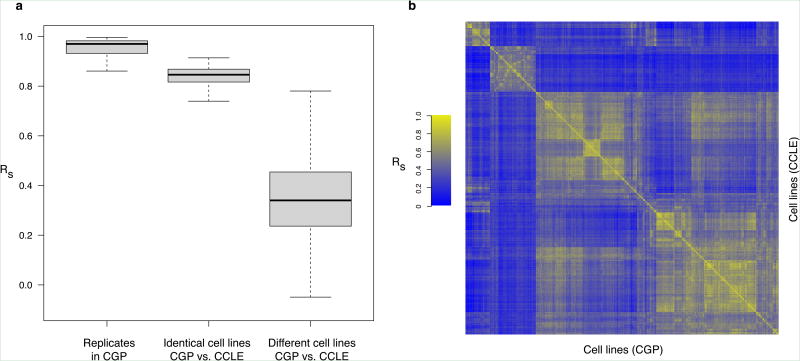
We downloaded, curated, and annotated the genomic and pharmacological data from the CGP and CCLE studies(Methods). We first compared expression profiles between the 61 biological replicates in CGP and observed very high correlation (median Spearman correlation of 0.97; Figure 1a) indicating excellent reproducibility within the same study.
Figure 1.
Consistency between gene expression profiles of cell lines in CGP and CCLE studies.(a) Box plot representing the correlation coefficients of the biological replicates in CGP, identical and between different cell lines from CGP and CCLE datasets; (b)heatmap representing the correlations between gene expression profiles of cell lines; the order of cell lines is identical in rows (CCLE) and columns (CGP).
We then compared gene expression profiles of the 471 cell lines shared between studies. Despite the use of different array platforms (Affymetrix GeneChip HG-U133Ain CGP andHG-U133PLUS2in CCLE), the expression profiles of identical cell lines were significantly better correlated than between different cell lines (median correlation of 0.85 vs. 0.34 for identical and different cell lines, respectively; two-sided Wilcoxon Rank Sum test p-value < 1×10⁻¹⁶). For 467cell lines, the mosthighly correlated gene expression profile was with the same cell line; only four (MOG-G-CCM, SNB19, SW1990, and SW403)were more highly correlated with another cell line (Figure 1b). This small discordance between the CGP and CCLE is likely due to experimental artifacts, measurement error, or divergence of the four cell lines. We tested consistency based on the tissue from which the cell line was derived (Supplementary Figure 1). We found the highest correlation, with cell lines from the urinary tract (median correlation of 0.87) and the lowest for those the upper aerodigestive tract (median correlation of 0.79),
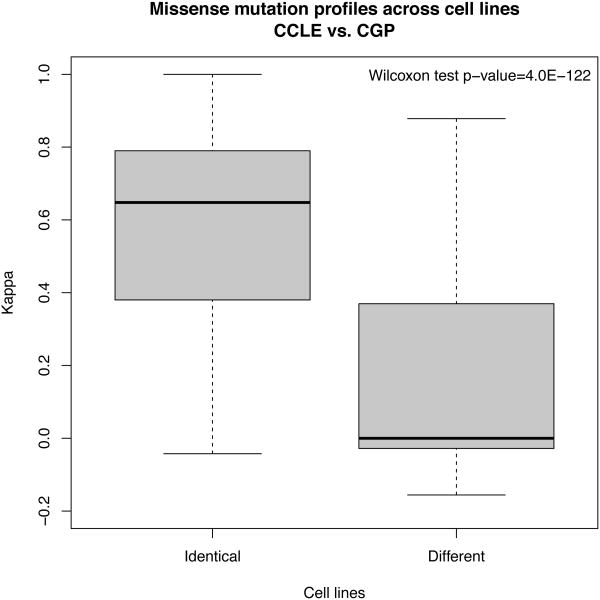
We compared the reported presence of mutations for 64 genes in the shared 471 cell lines and found better agreement between identical cell lines than between different cell lines (two-sided Wilcoxon Rank Sum test p-value < 1×10⁻¹⁶; Extended Data Figure 2), although not perfect agreement(median Cohen's Kappa [κ] of 0.65), which might be due to the different sequencing platforms and software used to call genomic variants in the two studies. Agreement in mutation profiles was higher in pancreas cell lines although the difference was not significant (Supplementary Figure 2).
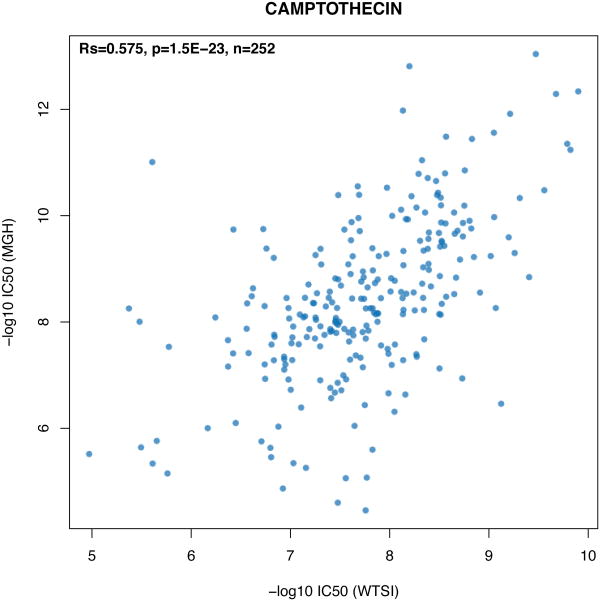
We then compared drug sensitivity phenotype measurements. In the CGP drug screening was performed at two sites, the Massachusetts General Hospital (MGH)and the Wellcome Trust Sanger Institute (WTSI). As a control, Camptothecin, an inhibitor of DNA enzyme topoisomerase I, was screened at both sites using the same experimental protocol in 252 cell lines. The IC50 (concentration in micro molar [μM] at which the drug inhibited 50% of the maximum cellular growth)for Camptothecin had significant but only fair correlation (rs=0.58. p-value=1.5×10⁻²³, Extended Data Figure 3).
We compared drug sensitivity measures between CGP and CCLE in fifteen drugs (Extended Data Figure 1a,b) tested on the 471 shared cell lines (Extended Data Figure 1d,e). Both CGP and CCLE measured cell line drug sensitivity usingIC50 and AUC (area under the activity curve measuring dose response), also referred to as Activity Area5; however the two studies used different experimental protocols (summarized in Supplementary Information). Differences include the pharmacological assay used, the range of drug concentrations tested, and choice of an estimator for summarizing the drug dose-response curve.
In both studies, the IC50 could not be estimated in many cases, as drug concentration necessary to inhibit 50% of growth was not reached. In CGP, IC50 was estimated using a Bayesian sigmoid model for drug response. In contrast, CCLE reported the maximum concentration for inactive compounds (referred to as placeholder values) rather than the extrapolated IC50. AUC measures do not require extrapolation and can always be estimated from the dose response curve.
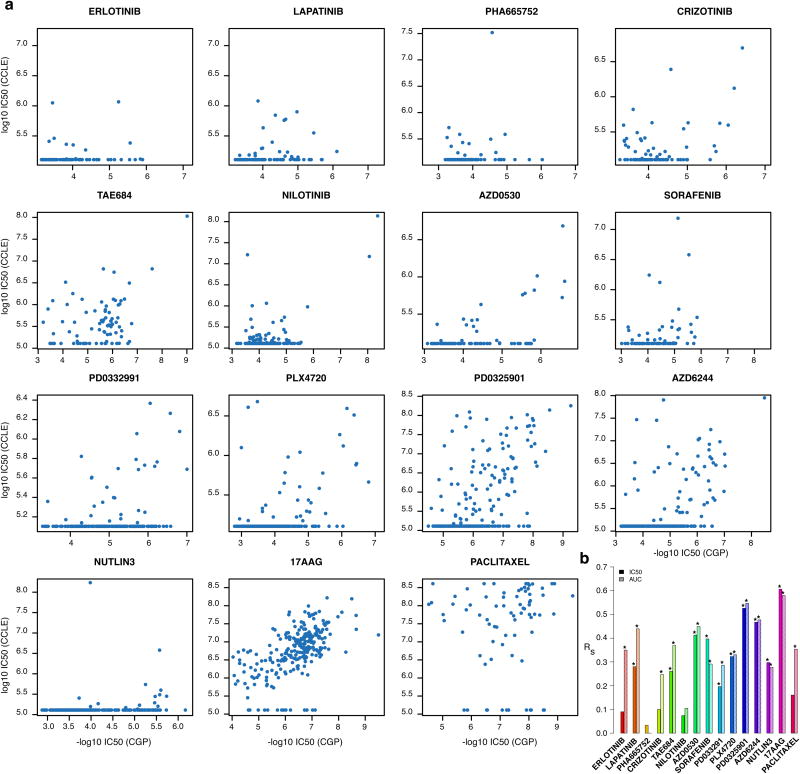
For each of the 15 drugs assayed by both CGP and CCLE we ranked the response of the 471 shared cell lines(Figure 2a) and computed the Spearman correlation coefficient (see Methods) for the reportedIC50 (Figure 2b). We found a single drug, 17AAG (an HSP90 inhibitor), with moderate correlation (rs=0.61; Extended Data Table 1a) and another, PD0325901 (a MEK inhibitor), with fair correlation (rs=0.53; Extended Data Table 1a) between studies.
Figure 2.
Consistency between drug sensitivity data published in CGP and CCLE studies. (a) Scatter plots reporting the drug sensitivity (IC50) measured in the 471 cell lines and for the 15 drugs investigated both in CGP and CCLE. (b) Bar plot representing the Spearman correlation coefficient for IC50 and AUC drug sensitivity measures; significance is reported using the symbol ‘*’ if two-sided p-value < 0.05.
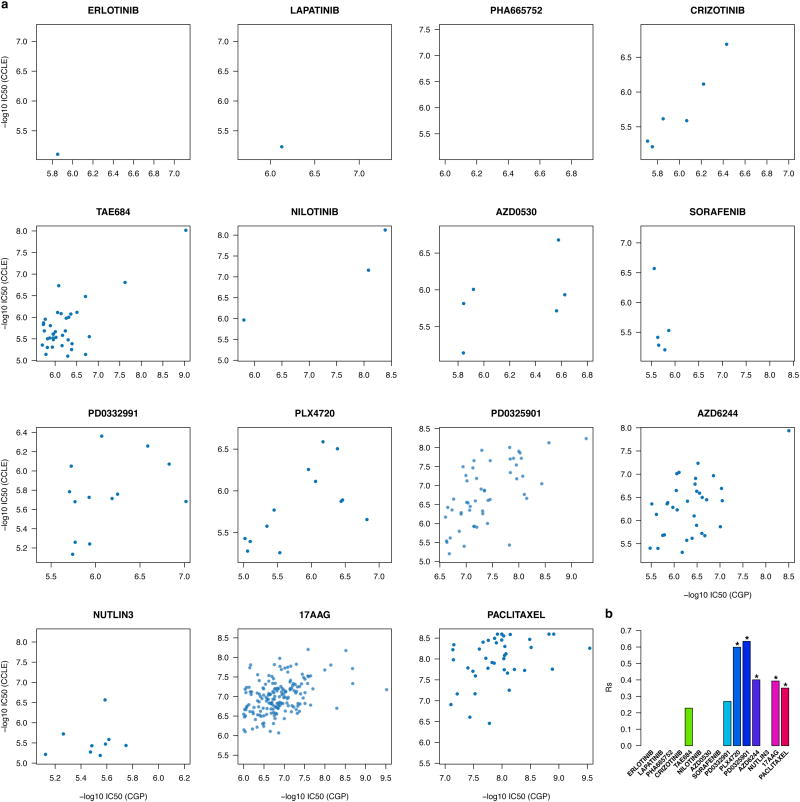
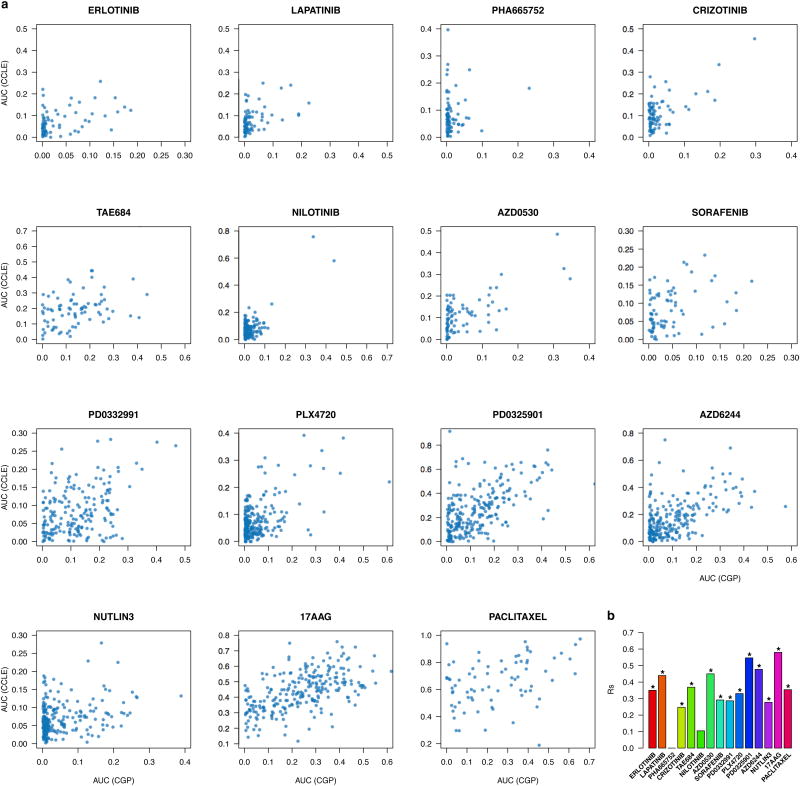
To test whether extrapolation decreased the correlations between studies we filtered out all IC50 values exceeding the maximum tested drug concentrations. We observed only small increases in correlation for PLX4720, PD0325901 and Paclitaxel and decreases for 17AAG and AZD6244, although the number of measurements was small(Extended data figure 4). We also compared reported AUC measures (Figure 2b, Extended Data Table 1b, Extended data figure 5) and found that only two drugs yielded fair correlations (17AAG with rs=0.58 and PD0325901 with rs=0.55).
We compared correlations computed from AUC and IC50(Figure 2b) and found AUC is more concordant between CGP and CCLE (median correlation of 0.35and 0.28 for IC50 and AUC, respectively) but that the difference was not significant (two-sided Wilcoxon signed rank test p-value=0.3). The vast majority of drugs yielded poor concordance (rs<0.5) for both IC50 and AUC, which suggests that the lack of consistency of the drug response cannot be solely explained by the choice of the estimator of drug sensitivity.
We tested whether drug response correlation depended on tissue source. We found bothIC50 and AUC measures tend to be more consistent in cell lines originating from urinary tract (Supplementary Figure 3); this difference is significant for AUC (two-sided Kruskal-Wallis test p-value=0.024; Supplementary Figure 3b). However, due to the small number of urinary tract cell lines (10), only three drugs (PD0325901, Nutlin-3 and 17AAG) had statistically significant moderate correlation (Supplementary Figure 4).
In addition to IC50 and AUC, we also compared sensitivity using the waterfall method described in the CCLE study3. Drug sensitivity calls (resistant, intermediate and sensitive) were estimated from IC50 and AUC values and compared using Cohen's κ (see Methods). Again, the drug sensitivity calls for both IC50 and AUC estimates(Supplementary Tables 1 and 2) had a poor agreement between studies (κ< 0.5; Supplementary Figure 5).
Despite the discordance in drug sensitivity measures between CGP and CCLE, we tested whether the association between drug response and genomic features might be consistent across datasets. This is important because the identification of genomic predictors of drug response was the primary goal of both the CGP and CCLE studies.
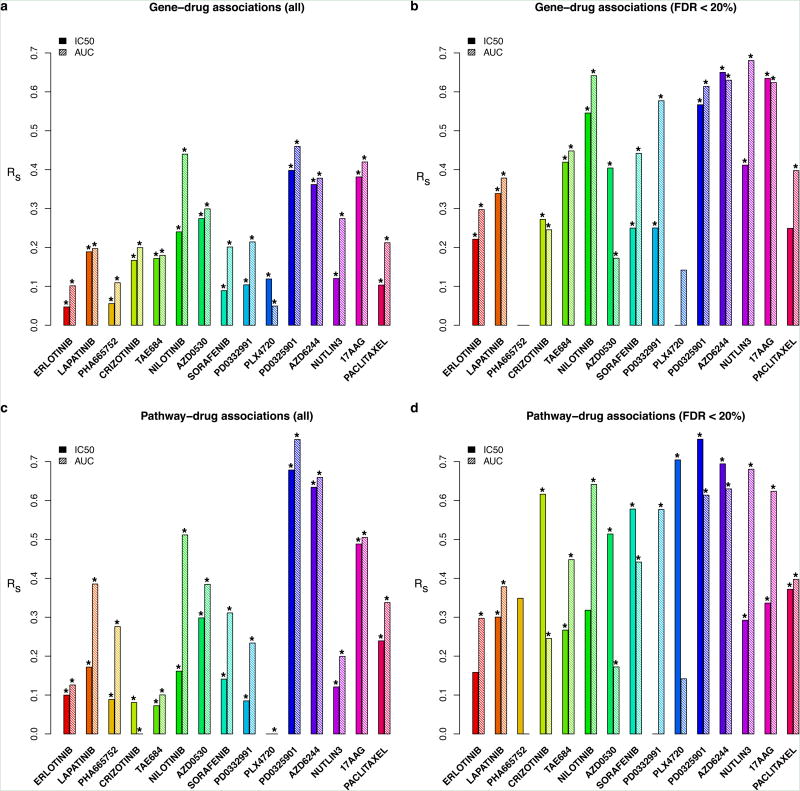
We estimated gene-drug associations by fitting, for each gene, a linear regression model including gene expression as predictor of drug sensitivity, controlled for tissue source (see Methods). Linear models were fitted using both IC50 and AUC measures (Supplementary Files 2-5). Here too, we observed poor correspondence between studies, the best correlation with IC50 data was observed for 17AAG (rs=0.38; Figure 3a, Supplementary Figure 6 and Extended Data Table 1a); for the vast majority of drugs correlations were slightly better when AUC measures were used to estimate gene-drug associations but the best correlation was still poor (rs=0.46 for PD0325901; Figure 3a, Extended Data Table 1b and Extended data figure 6). Although correlations significantly depended on tissue sources(tow-sided Kruskal-Wallis test p-value < 0.006), only drugs screened in hematopoietic/lymphoma tissue and urinary tract yielded slightly higher correlation than all tissues combined for both IC50 and AUC (Supplementary Figures 7 and 8).
Figure 3.
Consistency of associations of genomics features with drug sensitivity. The bars represent the Spearman correlation coefficients computed from: (a) all and (b) significant (FDR<20%) gene-drug associations; (c) all and (d) significant (FDR<20%) pathway-drug associations, as estimated in CGP and CCLE datasets. Significance is reported using the symbol ‘*’ if two-sided p-value < 0.05.
We tested whether these poor correlations could be due to genes unrelated to drug sensitivity by focusing on genes statistically associated with drug sensitivity (false discovery rate, FDR<20%) in at least one dataset. Overall, while the correlations were better than those computed using all genes, they were still low. For IC50, only AZD6244 and 17AAG yielded a moderate correlation (rs=0.65 and rs=0.63, respectively; Extended Data Table 1a, Supplementary Figure 9). Using AUC and this subset of genes, we found that PD0332991 had fair correlation, and five drugs had moderate correlation between studies (PD0325901, AZD6244, Nilotinib, 17AAG, and Nutlin-3; Extended Data Table 1b; Supplementary Figure 10). However the correlations for the remaining drugs remained poor (Extended Data Table 1, Supplementary Figures 8 and 9) and did not significantly depend on tissue source(two-sided Kruskal-Wallis test p-value>0.064; Supplementary Figures 11 and 12).
We recognize that activation of drug-response through specific gene functional classes may be more predictive than individual genes. We therefore used the previously computed gene-drug associations to rank genes by the significance of their association with drug sensitivity and searched for over-represented Gene Ontology (GO) terms using pre-ranked gene set enrichment analysis (GSEA)9. We compared the normalized enrichment scores computed for CGP and CCLE for the 15 drugs screened in both studies (see Methods).
ForIC50, there was poor correlation of GSEA enrichment scores for drugs, except for AZD6244 and PD0325901, which yielded fair correlation (rs=0.63 for AZD6244 and rs=0.68 for PD0325901; Figure 3c, Extended Data Table 1a, Supplementary Figure 13, Supplementary Files 6 and 7). When using AUC, two drugs yielded fair correlations (Nilotinib, 17AAG), AZD6244 yielded moderate correlation and PD0325901 yielded substantial correlation (rs=0.76; Figure 3c, Extended Data Table 1b, Extended data figure 7, Supplementary Files 8 and 9). These correlations significantly depended on tissue source(tow-sided Kruskal-Wallis test p-value < 7×10⁻⁴; Supplementary Figure 14) where median drug correlations computed from IC50 were higher in breast, urinary tract, hematopoietic/lymphoma and lung cell lines compared to all tissues combined (Supplementary Figures 14 and 15).
We repeated the analyses, this time focused on the GO classes that are statistically significantly enriched (FDR<20% for normalized enrichment score) among genes associated with drug response in at least one of the two studies. Using IC50, most correlations increased slightly, except for 17AAG and PD0332991, with PLX4720 and PD0325901 yielding moderate correlation (Figure 3c and 3d, Extended Data Table 1a, Supplementary Figure 16). For AUC, we observed fair correlation for Paclitaxel and Sorafenib, moderate correlation only for Lapatnib, and substantial correlation for PD0325901 and AZD6244 (Figure 3d, Extended Data Table 1b, Supplementary Figure 17).
These pathway-based correlations are the best observed in our analysis as almost half of the drugs exhibited a correlation greater than 0.5, although they are still quite poor. When stratifying by tissue source, only drugs screened in lung cancer cell lines yielded slightly higher median correlation compared to all tissues combined (Supplementary Figures 18 and 19).
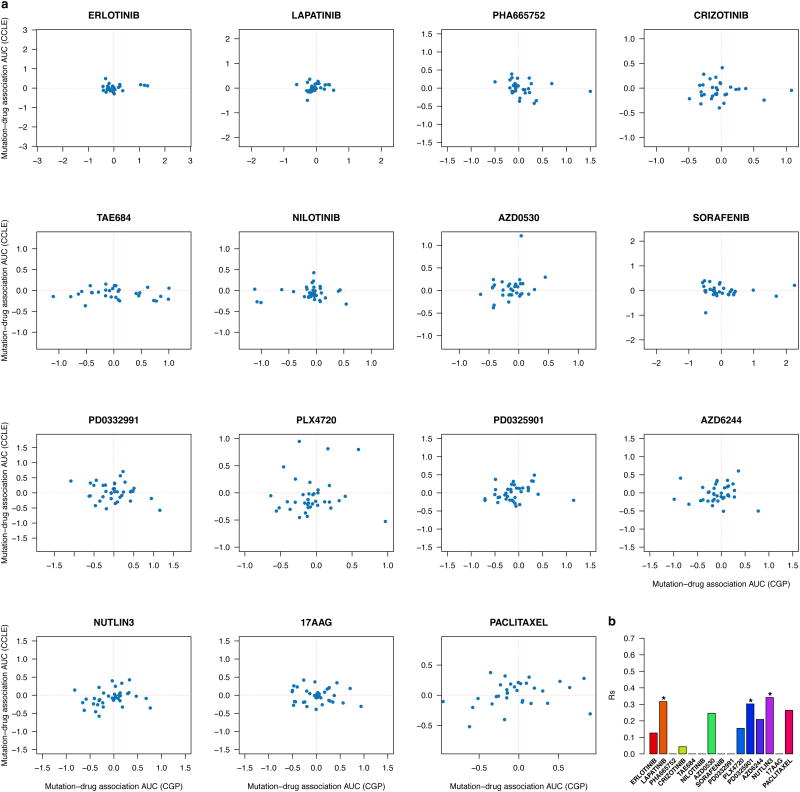
We then performed similar analyses using mutation data of the 64 genes sequenced both CGP and CCLE (Extended Data Figure 1g). We observed that few mutations were significantly associated with drug response (Supplementary Files 11-13), which partly explains the poor correlation between mutation-drug associations (rs< 0.5; Extended data figure 8, Supplementary Figures 20 and 21).
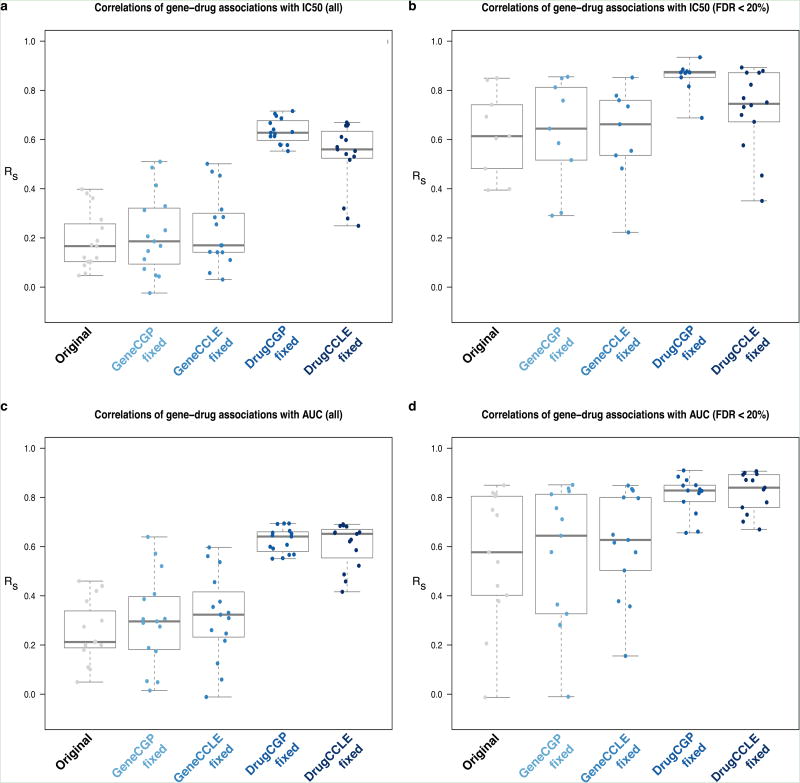
To test whether genomic data or drug response measures are the likely source of the poor correlations, we used identical (therefore perfectly correlated) gene expression data for the 471 cell lines while keeping the original drug sensitivity measures in each study, but did not find improved correlations for (significant) gene-drug associations (see ‘Gene CGP fixed’ and ‘Gene CCLE fixed’ in Figure 4). However when using identical drug phenotypes with the original gene expression data, correlations significantly increased in all cases (two-sided Kruskal-Wallis test p-value < 0.01, see ‘Drug CGP fixed’ and ‘Drug CCLE fixed’ in Figure 4) and yielded almost perfect correlation for significant gene-drug associations with AUC (median correlation> 0.83). Results were similar for pathway-drug associations (Supplementary Figure 22). These results clearly demonstrate that the discordance between studies stems from the drug sensitivity measurements.
Figure 4.
Effects on consistency by intermixing CCLE and CGP data. The box plots report the correlations between: (a) all and (b) significant (FDR < 20%) gene-drug associations with IC50; (c) all and (d) significant (FDR < 20%) gene-drug associations with AUC. Each box represent the datasets used to compute correlations:‘Original’ refers to the original datasets; ‘GeneCGP.fixed’ refers to [CGPg+CGPd] vs. [CGPg+CCLEd]; ‘GeneCCLE.fixed’ refers to [CCLEg+CGPd] vs. [CCLEg+CCLEd]; ‘DrugCGP.fixed’ refers to [CGPg+CGPd] vs. [CCLEg+ CGPd]; ‘DrugCCLE.fixed’ refers to [CGPg+CCLEd] vs. [CCLEg+CCLEd] where gand d stand for gene expression and drug sensitivity data, respectively.
We also investigated the impact of the choice of pharmacological assay across study and compared CGP and CCLE drug sensitivity data with those published by Greshock and colleagues in a panel of 319 cell lines10; the GlaxoSmithKline (GSK) data set. The GSK authors used the same pharmacological assay used by the CCLE (Cell Titer Glo Luminescent Cell Viability Assay kit from Promega), but other parameters in the experimental protocols differ from those in either CGP or CCLE and they used yet another model to estimate IC50 values (model 205 in XL fit in Microsoft Excel).
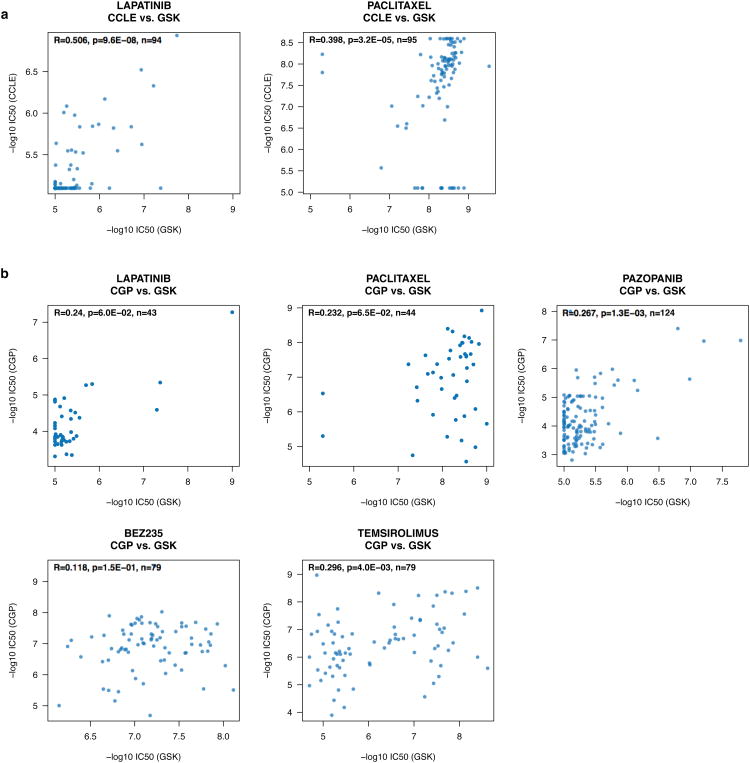
Among the fifteen drugs shared between CGP and CCLE, only two, Lapatinib and Paclitaxel, were tested by GSK on a common set of 194 cell lines. As might be expected based on the assay used, GSK IC50 measurements were more consistent with those of CCLE IC50 (rs=0.42 and 0.36 for Lapatinib and Paclitaxel, respectively; Supplementary Figure 23a) than CGP (rs=0.24 and 0.10 for Lapatinib and Paclitaxel, respectively; Supplementary Figure 23b), but here too the overall consistency was rather poor (and similar to the observed consistency between CCLE and CGP).
We then performed the same analysis but focusing on drugs and cell lines shared only by two studies. For Lapatinib and Paclitaxel, screened by CCLE and GSK in 249 common cell lines, we observed fair to poor correlations (Extended data figure 9a). Five drugs and 231 cell lines were screened both in CGP and GSK (Extended Data Figure 1c); for these we observed poor correlation (rs ranging from 0.12 to 0.30; Extended data figure 9b).
These results add further evidence that the inconsistency between studies stems from the use of different pharmacological assays, but there is no clear evidence to conclude which of the three approaches is more accurate. Indeed, even if we observed perfect correlation between GSK and either the CGP or CCLE drug response assays, all that would indicate is a consistency in measurement, but not necessarily which provided the most meaningful assay of drug response or which could best be translated to in vivo response.
Our analysis of these three large-scale pharmacogenomic studies points to a fundamental problem in assessment of pharmacologic drug response. While gene expression analysis has long been seen as a source of “noisy” data, extensive work has led to standardized approaches to data collection and analysis and the development of robust platforms for measuring expression levels. This standardization has led to substantially higher quality, more reproducible expression data sets, and this is evident in the CCLE and CGP data where we found excellent correlation between expression profiles in cell lines profiled in both studies.
The poor correlation between drug response phenotypes is troubling and may represent a lack of standardization in experimental assays and data analysis methods. However, there may be other factors driving the discrepancy. As reported by the CGP, there was only a fair correlation (rs< 0.6) between Camptothecin IC50 measurements generated at two sites using matched cell line collections and identical experimental protocols. While this might lead to speculation that the cell lines could be the source of the observed phenotypic differences, this is highly unlikely as the gene expression profiles are well correlated between studies.
While our analysis has been limited to common cell lines and drugs between studies, it is not unreasonable to assume that the measured pharmacogenomic response for other drugs and cell lines assayed are also questionable. Ultimately, the poor correlation in these published studies presents an obstacle to using the associated resources to build or validate predictive models of drug response. Because there is no clear concordance, predictive models of response developed using the data from one study are almost guaranteed to fail when validated on data from the other11 and there is no way with available data to determine which study is more accurate. This suggests that users of both datasets should be cautious in their interpretation of results derived from their analyses.
Clearly the investment in these projects warrants additional work to resolve the discrepancies in drug response phenotype so that the wealth of data that has been generated can be used to its fullest advantage. Our findings support the need for standardization of drug-response measurements or development of new, robust drug sensitivity assays; without such assays, it will not be possible to reliably identify genomic predictors of drug response or effectively a drug's mechanism of action.
Methods
To ensure reproducibility of our analysis, we developed an automated pipeline in R that can generate all the results, figures and tables of the paper (Supplementary data).
Data retrieval and curation
We retrieved and curated data from three large pharmacogenomic studies, namely the Cancer Genome Project (CGP), the Cancer Cell Line Encyclopedia (CCLE) and the GlaxoSmithKline cell line collection.
For CGP, gene expression data (raw Affymetrix CEL files) were downloaded from Array Express (http://www.ebi.ac.uk/arrayexpress/experiments/E-MTAB-783/). Drug sensitivity measurements, mutation data and cell lines annotations were downloaded from the CGP website(http://www.cancerrxgene.org/downloads/). Drug information was collected from Supplementary Information of Garnett et al.4. Minimum and maximum screening concentrations (μM) for each drug/cell line were extracted from gdsc_compounds_conc_w2.csv available on the CGP website. The natural logarithm of IC50 measurements were retrieved from column “*_IC_50” of gdsc_manova_input_w2.csvavailable on the CGP website. The AUC measurements were retrieved from gdsc_manova_input_w2.csv in column “*_AUC”. Coding variants in 68 genes were also extracted from gdsc_manova_input_w2.csv.
For CCLE, gene expression, mutation data cell line annotations and drug information were downloaded from the CCLE website (http://www.broadinstitute.org/ccle) Drug sensitivity data were downloaded from the addendum published by Barretina et al.13. Screening concentrations (μM) for each drug/cell line were extracted from Supplementary Table 11 in column “Doses (μM)”. IC50 measurements were retrieved from Supplementary Table 11 in column “IC50 μM (norm)”. AUC measurements were retrieved from Supplementary Table 11 in column “Act Area(norm)”. Coding variants in 1667 genes (column ‘Protein Change’) measured using the Oncomap3 and hybrid capture platforms were extracted from CCLE_Oncomap3_2012-04-09.maf and CCLE_hybrid_capture1650_hg19_NoCommonSNPs_NoNeutralVariants_CDS_2012.05.07.maf, respectively.
For GSK, gene expression data and cell line annotations were downloaded from the National Cancer Informatics Program website (http://cbiit.nci.nih.gov/ncip). IC50measurements and drug information were downloaded from Supplementary Table 2 (stab_2.xls) of Greshock et al.10.
Cell line annotations
Cell line names were harmonized in CGP, CCLE and GSK to match identical cell lines; this was done through manual search over alternative names of cell lines, as reported in the corresponding cell line annotation files and online databases such as hyper CLDB (http://bioinformatics.istge.it/hypercldb/) and BioInformation Web (http://bioinfoweb.com). We identified 471 cancer cell lines being investigated both in CGP and CCLE, 231 cell lines shared between CGP and GSK, 249 cell lines shared between CCLE and GSK, and 194 cell lines shared by all three studies (Extended Data Figure 1c). To annotate the tissue of origin of each cell lines we chose the nomenclature used in CGP; CCLE and GSK tissue type information was therefore updated to follow this nomenclature, which resulted in 24 tissue types.
Drug sensitivity data
Drug sensitivity measures, which are IC50 and AUC values, were set to common scale (−log10 (M) for IC50 and [0,1] for AUC) across studies so that high values are representative of cell line sensitivity to drugs. For CGP, extracted IC50 measures (x) were transformed using −log10 (exp(x)/106) , and AUC measures were left untransformed. For CCLE, extracted IC50 measures (x) were transformed into logarithmic scale, −log10 (x/106) , and AUC measures were divided by the number of drug concentrations tested (8). For GSK, extracted IC50 measures (x) were transformed using −log10 (x/103).
We also discretized the drug sensitivity measures into three categories (resistant, intermediate and sensitive) using the waterfall method described in the CCLE study3. The full procedure, as provided by Dr. Kavitha Venkatesan (personal communication) is described below:
Extract the drug sensitivity measurements, either IC50 or AUC.
Sort increasing log IC50 values (or AUC) of the cell lines to generate a waterfall distribution.
If the waterfall distribution is non-linear (Pearson correlation coefficient to the linear fit ≤ 0.95), estimate the major inflection point of the log IC50 curve as the point on the curve with the maximal distance to a line drawn between the start and end points of the distribution.
If the waterfall distribution appears linear (Pearson correlation coefficient to the linear fit > 0.95), then use the median IC50 instead.
Cell lines within a 4-fold IC50 (or within a 1.2-fold AUC) difference centered around this inflection point are classified as being intermediate, cell lines with lower IC50 (or AUC) values than this range are defined as sensitive, and those with IC50 (or AUC) values higher than this range are called resistant.
Require at least x=5 sensitive and x=5 resistant cell lines after applying these criteria.
Using this approach we generated drug sensitivity calls for all drugs in CGP and CCLE (Supplementary Tables 1 and 2).
Gene expression data
Raw gene expression profiles (Affymetrix CEL format) for 789 CGP, 1036 CCLE and950 cell lines were downloaded, respectively, from ArrayExpress14 (E-MTAB-783), CCLE (www.broadinstitute.org/ccle/) and NCIP (http://cbiit.nci.nih.gov/ncip) websites. Gene expression data were normalized with frozen RMA15 using the Bioconductor Chip Description File (CDF) definitions (hthgu133a fro CGP, and hgu133plus2 for CCLE and GSK, respectively). We then used the R package jetset16, which maps Affymetrix probe sets to unique Entrez gene ids by selecting the best probe set for each gene; subsequent analyses were restricted to the 12,187 probe sets common to the CGP, CCLE and GSK arrays. For replicates in CGP and GSK, the CEL files were ordered by hybridization date and the first experiment was selected.
Mutation data
Missense mutations in 64 protein-coding genes sequenced in 431 cell lines both in CGP and CCLE were downloaded from their respective website. Similarly to CGP and CCLE studies3,4, mutation data were discretized to represent the presence or absence of missense mutation in a given gene in a given cell line.
Gene-drug associations
We assessed the association between gene expression and drug response, referred to as gene-drug association, using a linear regression model controlled for tissue source:
where Y denote the drug sensitivity variable, Gi and T denote the expression of gene i and the tissue type respectively, and βs are the regression coefficients. The strength of gene-drug association is quantified by βi, above and beyond the relationship between drug sensitivity and tissue source. The variables Y and G are scaled (standard deviation equals to 1) to estimates tandardized coefficients from the linear model. Significance of the gene-drug association is estimated by the statistical significance of βi (two-sided t test).
Pathway-drug associations
For each drug, genes were ranked according to the statistical significance of their gene-drug association (Student t statistic). We then used this drug-specific gene ranking to perform pre-ranked geneset enrichment analyses (GSEA9 version 2.0.13) in order to assess enrichment of gene ontology terms17 curated in MSigDB9 (c5.all.v4.0.entrez.gmt). Only pathways whose corresponding gene sets contained between 15 genes and 250 genes, were considered for further analysis (913 genesets). We used the resulting normalized enrichment (NES9) scores to quantify the strength of pathway-drug associations.
Measures of consistency
We computed Spearman rank-ordered correlation coefficients (rs)12 to assess the consistency between CGP and CCLE drug phenotypes (IC50 and AUC measures), gene/mutation-drug associations (coefficient β) and pathway-drug associations (normalized enrichment scores). We used Cohen's Kappa (κ) coefficient18 to assess consistency between CGP and CCLE drug sensitivity calls (resistant, intermediate, sensitive) and mutation data. We used the following qualitative descriptions of correlation coefficient (rs) values associated with intervals: rs< 0.5, poor consistency; 0.5 ≤rs< 0.6, fair consistency; 0.6 ≤rs< 0.7, moderate consistency; 0.7 ≤rs< 0.8, substantial consistency; and rs≤ 0.8, almost perfect consistency. Same qualitative descriptions were used for Cohen's Kappa (κ) coefficient.
Extended Data
Extended Data Figure 1.
Intersection between the pharmacogenomic studies in terms of drugs, cell lines and genes. (a) Venn diagram reporting the number of drugs shared between CGP and CCLE studies; (b) Description of the 15 anticancer drugs screened both in CGP and CCLE studies; (c) Venn diagram reporting the number of drugs shared between CGP, CCLE and GSK studies; (d) Venn diagram reporting the number of cell lines shared by CGP and CCLE studies; (e) Number of cell lines for each tissue types among the 471 common to CGP and CCLE studies; (f) Venn diagram reporting the number of cell lines shared between CGP, CCLE and GSK studies; (g) Venn diagram reporting the number of genes whose presence of mutations was assessed both in CGP and CCLE studies; (h) Venn diagram reporting the number of genes whose expression was assessed both in CGP and CCLE studies.
Extended Data Figure 2.
Box plot of the correlations of missense mutation profiles between identical cell lines in CGP and CCLE. Two-sided Wilcoxon rank sum test was used to test whether agreement was significantly higher in identical cell lines compared to different cell lines (upper right corner).
Extended Data Figure 3.
Scatter plot reporting the IC50 values of Camptothecin for 252 cell lines screened within the CGP project, as measured at the facilities of the Massachusetts General Hospital (MGH) and the Wellcome Trust Sanger Institute (WTSI). Spearman correlation coefficient (Rs) is reported in the upper left corner.
Extended Data Figure 4.
Scatter plots reporting the drug sensitivity measurements, which are the IC50 values within the range of tested concentration (thus excluding extrapolated IC50 in CGP and placeholder values in CCLE) in the 471 cell lines and for each the 15 drugs investigated both in CGP and CCLE. The last bar plot (bottom right corner) reports the Spearman correlation coefficient (Rs) for each drug where significance of each correlation coefficient is reported using the symbol ‘*’ if two-sided p-value < 0.05.
Extended Data Figure 5.
Scatter plots reporting the drug sensitivity (AUC) measured in the 471 cell lines and for each the 15 drugs investigated both in CGP and CCLE. The last bar plot (bottom right corner) reports the Spearman correlation coefficient (Rs) for each drug where significance of each correlation coefficient is reported using the symbol ‘*’ if two-sided p-value < 0.05.
Extended Data Figure 6.
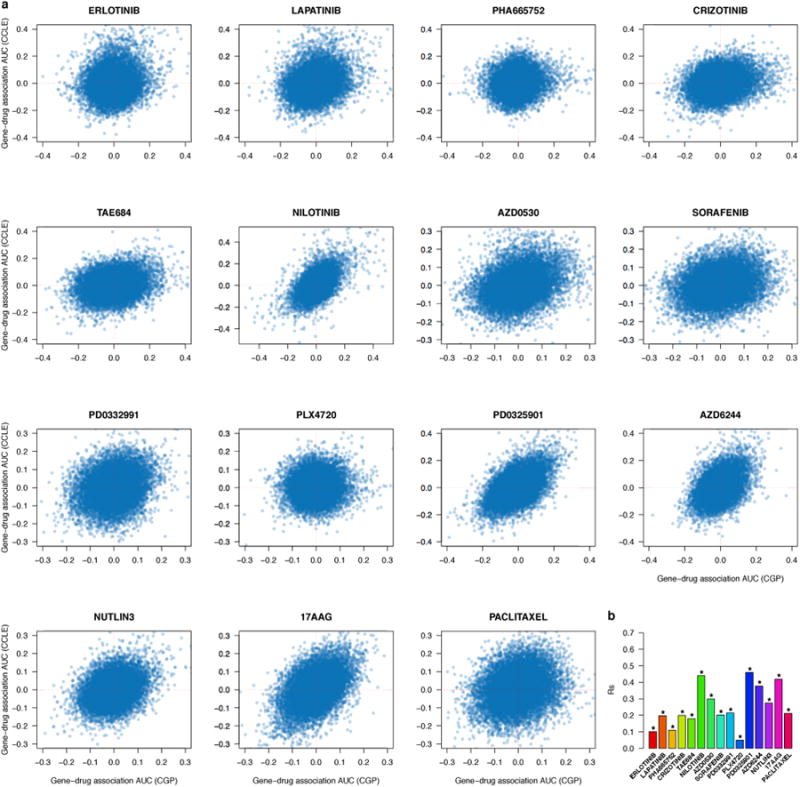
Scatter plots reporting the gene-drug associations computed with AUC, as quantified by the standardized coefficient of the gene of interest in a linear model controlled for tissue type, in the 471 cell lines and for each the 15 drugs investigated both in CGP and CCLE. The last bar plot (bottom right corner) reports the Spearman correlation coefficient (Rs) for each drug where significance of each correlation coefficient is reported using the symbol ‘*’ if two-sided p-value < 0.05.
Extended Data Figure 7.
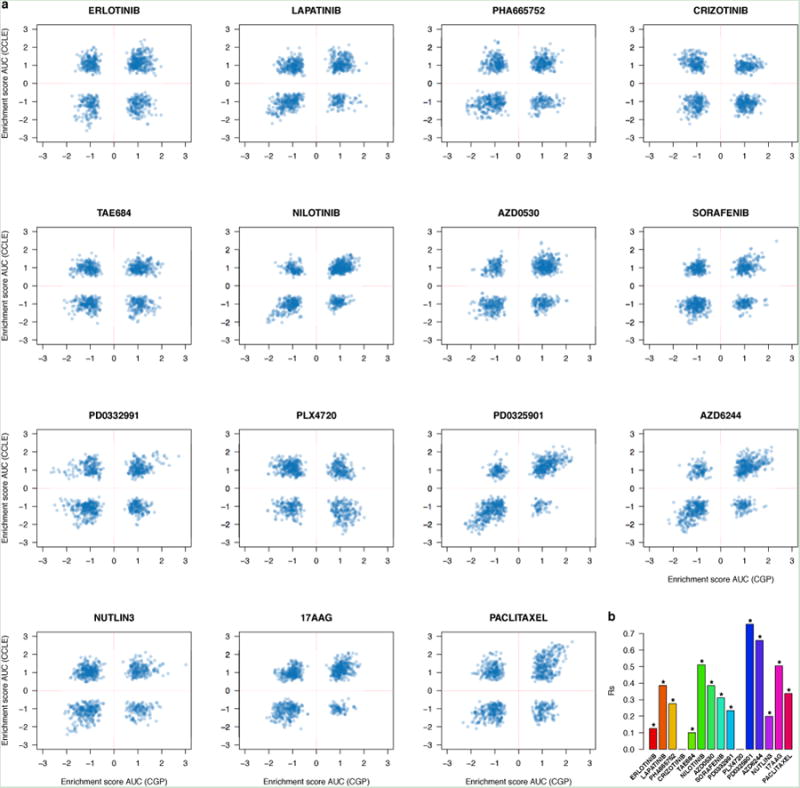
Scatter plots reporting the pathway-drug associations computed with AUC, as quantified by the standardized coefficient of the gene of interest in a linear model controlled for tissue type, in the 471 cell lines and for each the 15 drugs investigated both in CGP and CCLE. The last bar plot (bottom right corner) reports the Spearman correlation coefficient (Rs) for each drug where significance of each correlation coefficient is reported using the symbol ‘*’ if two-sided p-value < 0.05.
Extended Data Figure 8.
Scatter plots reporting the mutation-drug associations computed with AUC, as quantified by the standardized coefficient of the gene of interest in a linear model controlled for tissue type, in the 471 cell lines and for each the 15 drugs investigated both in CGP and CCLE. The last bar plot (bottom right corner) reports the Spearman correlation coefficient (Rs) for each drug where significance of each correlation coefficient is reported using the symbol ‘*’ if two-sided p-value < 0.05.
Extended Data Figure 9.
Comparison of drug sensitivity measured in CGP and CCLE with GSK. (a) Scatter plots reporting the drug sensitivity measurements (IC50) of all drugs and cell lines screened both in CCLE and GSK datasets (2 drugs in 249 cell lines). (b) Scatter plots reporting the drug sensitivity measurements (IC50) of all drugs and cell lines screened both in CCLE and GSK datasets (5 drugs in 231 cell lines).
Extended Data Table 1.
Spearman correlation coefficients and significance for consistency of drug sensitivity, gene-drug and pathway-drug associations for (a) IC50 and (b) AUC.
| a | |||||
|---|---|---|---|---|---|
|
| |||||
| Drug | IC50 measures | Gene-drug associations | Significant (FDR < 20%) gene-drug associations | Pathway-drug associations | Significant (FDR < 20%) pathway-drug associations |
| ERLOTINIB | 0.09 [NS] | 0.05 *** | 0.22 *** | 0.1 ** | 0.16 * |
| LAPATINIB | 0.28 ** | 0.19 *** | 0.34 *** | 0.17 *** | 0.3 *** |
| PHA665752 | 0.03 [NS] | 0.06 *** | -1 [NS] | 0.09 ** | 0.35 [NS] |
| CRIZOTINIB | 0.1 [NS] | 0.17 *** | 0.27 ** | 0.08 ** | 0.62 *** |
| TAE684 | 0.26 ** | 0.17 *** | 0.42 *** | 0.07 * | 0.27 * |
| NILOTINIB | 0.07 [NS] | 0.24 *** | 0.55 *** | 0.16 *** | 0.32 [NS] |
| AZD0530 | 0.41 *** | 0.27 *** | 0.4 *** | 0.3 *** | 0.51 *** |
| SORAFENIB | 0.4*** | 0.09 *** | 0.25 * | 0.14 *** | 0.58 *** |
| PD0332991 | 0.2 ** | 0.1 *** | 0.25 *** | 0.08 ** | -0.12 [NS] |
| PLX4720 | 0.32 *** | 0.12 *** | -0.01 [NS] | -0.05 [NS] | 0.7 *** |
| PD0325901 | 0.53 *** | 0.4*** | 0.57 *** | 0.68 *** | 0.76 *** |
| AZD6244 | 0.47 *** | 0.36 *** | 0.65 *** | 0.63 *** | 0.69 *** |
| NUTLIN3 | 0.3 *** | 0.12 *** | 0.41 *** | 0.12 *** | 0.29 *** |
| 17AAG | 0.61 *** | 0.38 *** | 0.63 *** | 0.49 *** | 0.34 *** |
| PACLITAXEL | 0.16 [NS] | 0.1 *** | 0.25 [NS] | 0.24 *** | 0.37 *** |
| b | |||||
|---|---|---|---|---|---|
|
| |||||
| Drug | AUC measures | Gene-drug associations | Significant (FDR < 20%) gene-drug associations | Pathway-drug associations | Significant (FDR < 20%) pathway-drug associations |
| ERLOTINIB | 0.35 ** | 0.1 *** | 0.3 *** | 0.13 *** | 0.36 *** |
| LAPATINIB | 0.44 *** | 0.2 *** | 0.38 *** | 0.39 *** | 0.66 *** |
| PHA665752 | -0.09 [NS] | 0.11 *** | -0.12 [NS] | 0.28 *** | 0.39 *** |
| CRIZOTINIB | 0.25 * | 0.2 *** | 0.25 *** | -0.11 [NS] | 0.21 [NS] |
| TAE684 | 0.37 *** | 0.18 *** | 0.45 *** | 0.1 ** | 0.26 * |
| NILOTINIB | 0.1 [NS] | 0.44 *** | 0.64 *** | 0.51 *** | 0.44 * |
| AZD0530 | 0.45 *** | 0.3 *** | 0.17 ** | 0.38 *** | 0.39 * |
| SORAFENIB | 0.29 ** | 0.2 *** | 0.44 *** | 0.31 *** | 0.54 ** |
| PD0332991 | 0.29 *** | 0.21 *** | 0.58 *** | 0.23 *** | 0.41 *** |
| PLX4720 | 0.33 *** | 0.05 *** | 0.14 * | -0.24 [NS] | -0.49 [NS] |
| PD0325901 | 0.55 *** | 0.46 *** | 0.61 *** | 0.76 *** | 0.78 *** |
| AZD6244 | 0.48 *** | 0.38 *** | 0.63 *** | 0.66 *** | 0.71 *** |
| NUTLIN3 | 0.28 *** | 0.27 *** | 0.68 *** | 0.2 *** | 0.28 *** |
| 17AAG | 0.58 *** | 0.42 *** | 0.62 *** | 0.51 *** | 0.46 *** |
| PACLITAXEL | 0.35 *** | 0.21 *** | 0.4*** | 0.34 *** | 0.56 *** |
Significance of positive correlation coefficient is reported using the following convention:
for p-value <0.001
for p-value <0.01
for p-value <0.05, ‘NS’ for p-value ≥0.05; all p-values are two-sided. When less than ten IC50 values were available, correlation coefficient was not computed and was therefore represented by empty cells in the table.
Supplementary Material
Acknowledgments
We thank Jacques Archambault for his insightful comments on the comparative study between experimental protocols used in the large pharmacogenomic studies investigated in this work. The authors would like to thank the investigators of the Cancer Genome Project, the Cancer Cell Line Encyclopedia and the GlaxoSmithKline cell line study who have made their invaluable data available to the scientific community.
NEH was supported by an IRCM doctoral fellowship. AHB was supported by an award from the Klarman Family Foundation and by support from NIH grant CA087969. NJB was funded The VillumKann Rasmussen Foundation. JQ was supported grants from the Dr. Miriam and Sheldon G. Adelson Medical Research Foundation and from the NCI GAME-ON Cancer Post-GWAS initiative (U19 CA148065-01).
Footnotes
Supplementary Information is linked to the online version of the paper at www.nature.com/nature.
Author Contributions BHK conceived the study with major contributions from NJB, HJWLA and JQ. BHK, and NEH collected and curated the gene expression profiles and drug phenotypic data. AJC and AHB collected and curated the mutation data. BHK performed all the analyses and wrote the code with contributions from NEH and ACJ. NEH, AJC and AHB compared the experimental protocols of the pharmacogenomic studies. BHK, AHB, HJWLA and JQ supervised the study. BHK, AHB, HJWLA and JQ wrote the manuscript with contributions from NEH and NJB. All authors discussed the results and commented on the manuscript.
Author Information The R code enables to download and process the pharmacogenomic data and to generate all the results presented in the paper and its supplementary information. Reprints and permissions information is available at www.nature.com/reprints.
The authors declare no competing financial interests.
References
- 1.Shoemaker RH. The NCI60 human tumour cell line anticancer drug screen. Nature Reviews Cancer. 2006;6:813–823. doi: 10.1038/nrc1951. [DOI] [PubMed] [Google Scholar]
- 2.Weinstein JN. Drug discovery: Cell lines battle cancer. Nature. 2012;483:544–545. doi: 10.1038/483544a. [DOI] [PubMed] [Google Scholar]
- 3.Barretina J, et al. The Cancer Cell Line Encyclopedia enables predictive modelling of anticancer drug sensitivity. Nature. 2012;483:603–607. doi: 10.1038/nature11003. [DOI] [PMC free article] [PubMed] [Google Scholar]
- 4.Garnett MJ, et al. Systematic identification of genomic markers of drug sensitivity in cancer cells. Nature. 2012;483:570–575. doi: 10.1038/nature11005. [DOI] [PMC free article] [PubMed] [Google Scholar]
- 5.Wu R, Lin M. Statistical and Computational Pharmacogenomics. Chapman and Hall/CRC; 2010. [Google Scholar]
- 6.Roden DM, George AL., Jr The genetic basis of drug response. Nature. 2002;1:37–44. doi: 10.1038/nrd705. [DOI] [PubMed] [Google Scholar]
- 7.Heiser LM, et al. Subtype and pathway specific responses to anticancer compounds in breast cancer. Proceedings of the National Academy of Sciences. 2012;109:2724–2729. doi: 10.1073/pnas.1018854108. [DOI] [PMC free article] [PubMed] [Google Scholar]
- 8.Yamori T. Panel of human cancer cell lines provides valuable database for drug discovery and bioinformatics. Cancer Chemother Pharmacol. 2003;52 Suppl 1:S74–9. doi: 10.1007/s00280-003-0649-1. [DOI] [PubMed] [Google Scholar]
- 9.Subramanian A, et al. Gene set enrichment analysis: A knowledge-based approach for interpreting genome-wide expression profiles. Proc Natl Acad Sci USA. 2005;102:15545–15550. doi: 10.1073/pnas.0506580102. [DOI] [PMC free article] [PubMed] [Google Scholar]
- 10.Greshock J, et al. Molecular Target Class Is Predictive of In vitro Response Profile. Cancer Research. 2010;70:3677–3686. doi: 10.1158/0008-5472.CAN-09-3788. [DOI] [PubMed] [Google Scholar]
- 11.Papillon-Cavanagh S, et al. Comparison and validation of genomic predictors for anticancer drug sensitivity. J Am Med Inform Assoc. 2013 doi: 10.1136/amiajnl-2012-001442. [DOI] [PMC free article] [PubMed] [Google Scholar]
- 12.Spearman C. The proof and measurement of association between two things. Int J Epidemiol. 2010;39:1137–1150. doi: 10.1093/ije/dyq191. [DOI] [PubMed] [Google Scholar]
- 13.Barretina J, et al. Addendum: The Cancer Cell Line Encyclopedia enables predictive modelling of anticancer drug sensitivity. Nature. 2012;492:290–290. doi: 10.1038/nature11003. [DOI] [PMC free article] [PubMed] [Google Scholar]
- 14.Parkinson H, et al. ArrayExpress--a public database of microarray experiments and gene expression profiles. Nucleic Acids Res. 2007;35:D747–50. doi: 10.1093/nar/gkl995. [DOI] [PMC free article] [PubMed] [Google Scholar]
- 15.McCall MN, Bolstad BM, Irizarry RA. Frozen robust multiarray analysis (fRMA) Biostatistics. 2010;11:242–253. doi: 10.1093/biostatistics/kxp059. [DOI] [PMC free article] [PubMed] [Google Scholar]
- 16.Li Q, Birkbak NJ, Györffy B, Szallasi Z, Eklund AC. Jetset: selecting the optimal microarray probe set to represent a gene. BMC Bioinformatics. 2011;12:474. doi: 10.1186/1471-2105-12-474. [DOI] [PMC free article] [PubMed] [Google Scholar]
- 17.Ashburner M, et al. Gene ontology: tool for the unfication of biology. The Gene Ontology Consortium. Nat Genet. 2000;25:25–29. doi: 10.1038/75556. [DOI] [PMC free article] [PubMed] [Google Scholar]
- 18.Sim J, Wright CC. The kappa statistic in reliability studies: use, interpretation, and sample size requirements. Phys Ther. 2005;85:257–268. [PubMed] [Google Scholar]
Associated Data
This section collects any data citations, data availability statements, or supplementary materials included in this article.


