

Abstract
Receptive fields of midget ganglion cells and parvocellular lateral geniculate nucleus (LGN) neurons show color-opponent responses because they receive antagonistic input from the middle- and long-wavelength sensitive cones. It has been controversial as to whether this opponency can derive from random connectivity; if receptive field centers of cells near the fovea are cone-specific due to midget morphology, this would confer some degree of color opponency even with random cone input to the surround. A simple test of this mixed surround hypothesis is to compare spatial frequency tuning curves for luminance gratings and gratings isolating cone input to the receptive field center. If tuning curves for luminance gratings were bandpass, then with the mixed surround hypothesis tuning curves for gratings isolating the receptive field center cone class should also be bandpass, but to a lesser extent than for luminance. Tuning curves for luminance, chromatic, and cone-isolating gratings were measured in macaque retinal ganglion cells and LGN cells. We defined and measured a bandpass index to compare luminance and center cone-isolating tuning curves. Midget retinal ganglion cells and parvocellular LGN cells had bandpass indices between 0.1 and 1 with luminance gratings, but the index was usually near 1 (meaning low-pass tuning) when the receptive field center cone class alone was modulated. This is strong evidence for a considerable degree of cone-specific input to the surround. A fraction of midget and parvocellular cells showed evidence of incomplete specificity. Fitting the data with receptive field models revealed considerable intercell variability, with indications in some cells of a more complex receptive structure than a simple difference of Gaussians model.
1. INTRODUCTION
Excitation of one color and inhibition of another color is called color opponency [1] and is a characteristic feature of the visual responses of neurons in the parvocellular pathway of macaque monkeys. Color opponency underlies many important properties of human color perception. Therefore, understanding the neuronal basis of color opponency in neurons of the parvocellular pathway is a necessity for a full description of the neural mechanisms of color perception. In this paper we provide new evidence about the mechanisms of color opponency in midget (P) ganglion cells and in parvocellular lateral geniculate nucleus (LGN) neurons in macaque monkeys.
To summarize prior results, color opponency in macaque midget and parvocellular cells appears to be a consequence of cone opponency: the subtraction of signals of long-wavelength (L) and middle-wavelength (M) sensitive cones [2–4]. The M- and L-cone inputs to the receptive field of macaque parvocellular LGN cells were first examined by Wiesel and Hubel [5], who proposed that the cone-opponent inputs were arranged spatially either in a center-surround (Type I cells) or coextensive (Type II cells) organization. Wiesel and Hubel [5] implied that the opponent inputs to parvocellular color-opponent cells’ receptive field subunits were cone-specific: one cone excitatory, the other inhibitory. There has been much subsequent research on determining how much cone specificity is required to explain color opponency in midget ganglion cells and parvocellular LGN neurons.
Anatomical descriptions [6,7] implied that the receptive field centers of midget ganglion cells near the macaque monkey’s fovea were derived from a single cone; the cone was the only input to a midget bipolar cell, which was the direct input to a midget ganglion cell. However, physiological estimates of the midget ganglion cell’s receptive field center diameter are larger than a single cone (reviewed in [2]). The reason is likely to be physiological optics: the point spread function of the eye exceeds the size of a single cone in the fovea. Because the functional connection of midget ganglion cells to parvocellular LGN neurons is often 1:1 [8,9], the same cone specificity of the receptive field center mechanism should also apply to macaque parvocellular LGN cells.
Several independent groups proposed that mixed cone input to the receptive field surround could suffice to generate a cone-opponent signal, by virtue of the cone specificity of the receptive field center in macaque midget and parvocellular LGN cells [10]. For example, if a midget ganglion cell received excitatory L-cone input to its receptive field center from a single L cone (say of magnitude L), it could receive mixed input to its surround [of magnitude (−0.5(L + M))], and the net result summing over the entire receptive field would be L − 0.5(L + M) = 0.5(L − M), i.e., cone opponency. The mixed surround hypothesis received some quantitative support from computer simulations [11]. However, direct physiological evidence about midget ganglion cell and parvocellular LGN cell responses to stimuli with different spatial configurations of cone-isolating stimuli did not confirm the mixed surround hypothesis [3,4,12–14]. The mixed surround hypothesis was, however, recently stressed by Crook et al. [15]. In another study of midget retinal ganglion cells, Field et al. [16] maintained that there was no cone-specific input to the receptive field surround. The receptive fields of the retinal ganglion cells in both the Crook et al [15] and Field et al. [16] studies were in the peripheral retina. Based on previous work [17], it is possible that retinal eccentricity is a factor in results on mixed versus cone-selective surrounds. This possibility is considered further in the Section 4.
We report here new measurements aimed to test the mixed surround and cone-selective surround hypotheses. The measurements were spatial frequency tuning curves from midget ganglion cells of macaque retina and parvocellular cells of the LGN, using four different kinds of grating patterns: luminance, chromatic isoluminant, and M- or L-cone-isolating gratings. Additive receptive field models were used to describe the tuning curves for all four conditions. The measurements and the modeling results imply that there is a considerable degree of cone specificity of input to the receptive field surround mechanism of cells in the macaque, P pathway, although in a fraction of the midget (P) ganglion cells and parvocellular LGN cells in our samples (<25%) cone-specificity in the receptive field surround was not complete. The results are consistent with earlier evidence against the mixed surround hypothesis, but they suggest that macaque midget ganglion cell and parvocellular cell receptive field structure may in many cases be more complex than can be explained by a simple difference of Gaussians (DOG) model. How cone selectivity to receptive field center and surround is achieved and why cone selectivity depends on retinal eccentricity [16] remain important, open questions.
2. METHODS
A. Retinal Recording
Ganglion cell responses were recorded in vivo from the retinas of macaque monkeys (M. fascicularis). The animals were initially sedated with an intramuscular injection of ketamine (10 mg/kg). Anesthesia was induced with sodium thiopental (10 mg/kg) and maintained with inhaled isoflurane (0.2%–2%) in a 70:30 N2O-O2 mixture. Local anesthetic was applied to points of surgical intervention. EEG and ECG were monitored continuously to ensure animal health and adequate depth of anesthesia. Muscle relaxation was maintained by a constant infusion of gallamine triethiodide (5 mg/kg i.v.) with accompanying dextrose Ringer solution (5 ml/kg/hr). Body temperature was kept close to 37.5°. End tidal CO2 was adjusted to close to 4% by adjusting the rate of respiration. Procedures conformed to the ARVO Statement for the Use of Animals in Ophthalmic and Vision Research and were approved by the SUNY State College of Optometry Institutional Animal Care and Use Committee.
Neuronal activity was recorded directly from retinal ganglion cells by an electrode inserted through a cannula entering the eye behind the limbus. A gas-permeable contact lens of the appropriate power was used to bring stimuli into focus on the retina.
Responses of macaque retinal ganglion cells were recorded between 4 and 15 deg eccentricity. Cell identification was achieved through standard tests [18]. These included achromatic contrast sensitivity and responses to lights modulated in different directions of cone space. For each cell, the locus of the receptive field center was determined, and the stimulus movement was centered around this point. Times of spike occurrence were recorded to an accuracy of 0.1 ms, and averaged histograms were accumulated. Fourier analysis of the histograms was carried out, and first harmonic response amplitude and phase were calculated.
To check on response phase estimates, response phase was plotted against spatial frequency. Any error in receptive field centering is reflected in a phase displacement linearly related to spatial frequency [19]. Such errors were consistent in all stimulus conditions, and phase values were appropriately corrected.
Visual stimuli were generated via a VSG series 2/3 graphic controller (Cambridge Research Systems, Rochester, UK) and presented on a CRT monitor (SONY Trinitron GDM-F500, 150 Hz frame rate) 2.28 m away from the monkey. Stimuli were horizontal gratings presented in a 5 deg ×5 deg window: luminance gratings (60% contrast), equiluminant red–green grating (29% RMS contrast), and L- or M-cone-isolating gratings (35% and 37% contrast, respectively), drifted at 2.5 Hz. About 8 s of activity were accumulated per spatial frequency per condition.
The spectrum of each phosphor was measured using a PhotoResearch spectroradiometer. The chromaticity and relative luminance (10 deg Vλ) of each phosphor were calculated for each by multiplying each spectrum with cone fundamentals [20] modified to the CIE 1964 10 deg color matching and luminosity functions [21]. The mean luminances of the red and green and phosphors were set equal to give a mean luminance of 31.34 cd/m2 and chromaticity of (0.436, 0.476) in CIE x, y coordinates.
B. LGN Experiments
We recorded extracellular responses from 64 neurons in the parvocellular layers of the left LGN of two anesthetized (sufentanil citrate, 6 μg/kg/hr) and paralyzed (pancuronium bromide, 0.1 mg/kg/hr or vecuronium bromide, 0.1 mg/kg/hr) adult Old World monkeys (Macaca fascicularis). ECG, EEG, expired CO2, and noninvasively measured blood pressure were monitored continuously. All procedures were approved by the New York University Animal Welfare Committee. Unit recordings were made with glass-coated tungsten microelectrodes with 5–15 μm tips [22]. Spikes were detected using a Bak (Maryland, USA) DDIS-I dual window discriminator, and times of occurrence were stored in the computer. Cells were identified as parvocellular by visual response properties and location along the recording track.
Visual stimuli were generated on a Tektronix 690SR color CRT monitor as described in Reid and Shapley [4]. The white point and mean luminance were respectively (X = 0.33, Y = 0.35) and luminance = 75 cd/m2.
Spatial tuning was measured in five color directions (luminance, isoluminance, and L-, M-, and S-cone isolating) with drifting sinusoidal gratings of varying spatial frequency. The temporal frequency of the drift was 4.2 Hz, chosen to be near optimal for P cell responses. Each stimulus was presented for 4 s on a background of mean luminance (75 cd/m2), followed by a blank of mean luminance of the same duration to determine the spontaneous firing rate and to avoid response adaptation. Spatial frequencies from full-field modulation to approximately 16 cycles per degree (cpd) were presented in equal logarithmic intervals. Each type of grating was roughly equated for cone contrast, set to approximately 20%. The three cone-isolating directions (L-, M- and S-cone) were obtained by adjusting the modulation of the three CRT guns according to the spectral sensitivity of each cone type, and the spectrophotometric calibrations of the CRT gun primaries were measured with a Photo Research Spectrascan Spectroradiometer PR 703A (cf. Reid and Shapley [4]). Equiluminance monitor calibrations were based on the human spectral sensitivity function (10 deg Vλ).
The LGN cell responses were compiled and averaged relative to the temporal period of the grating to form poststimulus time histograms. These histograms were Fourier analyzed to calculate the mean response rate as well as the amplitude and phase of the fundamental stimulus frequency (F1). We used the amplitude of the F1 response as the response measure in this paper.
3. RESULTS
The primary goal of these experiments was to examine center-surround receptive field structure of midget ganglion cells of the parvocellular (P) pathway, with specific reference to the degree of mixed cone input to the surround of such cells.
A. Selectivity of Surround Antagonism
Figure 1A shows a sketch of the standard models of P-pathway receptive fields. The receptive field center derives from a single L- or M-cone class, whereas the surround may derive solely from the opponent class (L or M) or from a mixture of the two. The simplest model assumption is that both receptive field center and surround have Gaussian spatial profiles, so that the receptive field spatial sensitivity profile is a DOG. For luminance-modulated gratings, such a center-surround organization would yield a spatial frequency tuning curve with some degree of bandpass shape [23] (Fig. 1B). If there was a cone-selective receptive field surround, the spatial frequency tuning curve measured with cone-isolating grating stimuli that isolate the receptive field center cone class should be low-pass in shape (Fig. 1C). If there was a random, mixed cone surround, some degree of bandpass character should be present in the spatial frequency tuning curve measured with grating stimuli that isolate the receptive field center cone class. For example, if there were a 1:1 L:M cone ratio across a random photoreceptor mosaic, there should be half as much low spatial frequency attenuation with grating stimuli that isolate the receptive field center cone class (Fig. 1D) as with the luminance condition (Fig. 1B), since with these assumptions the center cone class would contribute half the receptive field surround strength.
Fig. 1.

A, Sketches of receptive field structure. The receptive field center mechanism is thought to derive from a single cone, but the surround may derive from a single cone type or from a mixture of both cone types. The spatial profile is usually considered as a DOG. B, Hypothetical spatial frequency curves for a DOG profile for luminance modulation. The BPI is defined as R0/Rmax. C, With a cone-selective surround, the spatial frequency tuning curve for a cone-isolating grating targeting the center cone class alone is expected to be low-pass in shape. D, With a mixed surround, a bandpass tuning curve is expected for a cone-isolating grating targeting the center cone class, but with a lesser degree of low spatial frequency roll-off compared to a luminance grating.
To quantify the shape of the spatial frequency tuning curves, we define a bandpass index (BPI) as R0/RMAX (Fig. 1B); the BPI is the ratio of the response at the lowest spatial frequency to the response at the peak spatial frequency. BPI lies between 0 and 1; BPI = 1 indicates a low-pass shape of the spatial frequency response, while BPI = 0 means a total absence of response at low spatial frequencies, or, in other words, the spatial frequency response is completely bandpass, caused by complete surround antagonism of the center’s response at low spatial frequencies. We can calculate the BPI for models like those in Fig. 1. R0 = C − S, where C is the total response of the receptive field center mechanism and S is the integrated response of the surround. If the center mechanism is much smaller than the surround, RMAX = C. Therefore, BPI = (C − S)/C, or equivalently BPI = 1 − S/C and 1 − BPI = S/C. Thus, the BPI is inversely related to spatial antagonism in the receptive field; the lower the BPI, the greater the strength of the surround compared to that of the center. For the model example of a moderately spatially tuned receptive field in Fig. 1B, the BPI = 0.33.
Examples of measured ganglion and LGN cell spatial frequency tuning curves are shown in Fig. 2. The cell responses in Fig. 2 were representative of the midget and parvocellular populations we sampled. Figure 2A shows tuning data from retinal ganglion cells, and Fig. 2B shows data from LGN cells, for luminance gratings and for cone-isolating grating patterns that isolate responses of the receptive field center cone class. The BPIlum for cell responses to luminance gratings varied substantially from cell to cell. For example, the cell in the upper panel of Fig. 2A showed weak luminance responses together with little sign of low spatial frequency attenuation for luminance and, therefore, had a high BPI of 0.8. Examples of such behavior in parvocellular LGN cells can be found in published works (e.g., Derrington and Lennie [24]). Other midget retinal ganglion cells, such as the cell in the lower panel of Fig. 2A and the two parvocellular LGN cells in Fig. 2B, had lower BPIlum values for luminance gratings, meaning that for luminance patterns there was significant surround antagonism of the center.
Fig. 2.

Spatial frequency tuning curves for luminance gratings and gratings isolating the receptive field center cone class for A, two midget ganglion cells and B, two LGN parvocellular cells. Responses for the retinal ganglion cells have been scaled relative to 30% cone contrast. Responses of the parvocellular cells were for ~20% contrast. The degree of bandpass shape for luminance varies from cell to cell, but for the gratings isolating the center cone class the curves have a low-pass shape.
The spatial frequency tuning curves for responses to gratings isolating the receptive field center cone class showed no indication of low spatial frequency attenuation for the example cells in Fig. 2. This was not always the case but was typical in both midget ganglion cells and parvocellular datasets (see Fig. 3). The four example cells in Fig. 2 had a BPIcc near 1, as for most cells in our datasets. In other words, in response to gratings that isolated the receptive field center cone class, these cells had very weak surround antagonism.
Fig. 3.
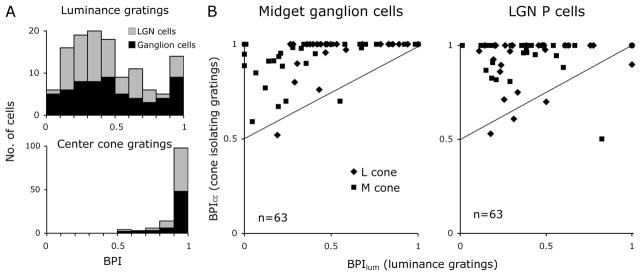
A, Distributions of BPIlum for luminance gratings and for the gratings isolating the receptive field center cone class (BPIcc) for populations of midget ganglion cells and of parvocellular LGN cells show considerable similarity. For luminance there is much variability of BPIlum, with some cells showing little low-spatial-frequency roll-off (BPIlum = 1). B, Comparisons of BPIlum and BPIcc for the two cell samples on a cell-by-cell basis. The solid curves represent the relationship between the BPI for luminance and the center cone expected if the M:L ratio were 1:1. See the text for the derivation.
The BPI distributions for populations of midget ganglion cells and parvocellular LGN cells are shown in Fig. 3A, which compares the distributions for luminance gratings and gratings isolating the receptive field center cone class. Most cells’ spatial frequency tuning shows some degree of bandpass character for luminance gratings, but the distribution collapses toward a value of 1 for gratings isolating the receptive field center cone class both for midget retinal ganglion cells and parvocellular LGN cells.
Across the populations studied, average BPIlum values for retinal and LGN responses to luminance gratings did not differ significantly from each other. The average BPIlum for midget ganglion cells in response to luminance gratings was 〈BPIlum〉 = 0.49, S.D. 0.30, n = 63; for parvocellular LGN cells in response to luminance gratings, 〈BPIlum〉 = 0.44, S.D. 0.26, n = 63; p = 0.12 (t test). These values of BPI near 0.4–0.5 indicate moderate surround antagonism for luminance patterns.
We also calculated the BPIcc for responses to gratings that isolated the receptive field center cone class of midget retinal ganglion cells and parvocellular LGN cells. The population averages did not differ significantly for the retina and LGN samples. For midget ganglion cells the receptive field center cone class isolating grating 〈BPIcc〉 = 0.94, S.D. 0.11, n = 63; for parvocellular LGN cells, 〈BPIcc〉 = 0.94, S.D. 0.12, n = 63; p = 0.42 (t test). It was highly statistically significant that the BPI for gratings that isolated the receptive field center cone class had values near 1 (see below); this implies that the receptive field center cone class generally had weak input to the receptive field surround.
It should be noted that in the retinal ganglion cell experiments the cone contrast for luminance gratings was set higher (60%) than for the other grating types (~ 35%), whereas in the LGN experiments the cone contrast was matched under all conditions (20%). The similarity of results in the two sets of experiments suggests that the BPI values measured were not heavily dependent on contrast.
In Fig. 3B, the BPIs for luminance gratings and for gratings isolating the receptive field center cone class are compared on a cell-by-cell basis, with retinal ganglion and LGN cells plotted separately. The straight lines indicate the predicted BPIcc if the receptive field surround were to receive mixed cone input in a retina with a 1:1 L:M cone ratio. The calculation was based on an assumed 1:1 L:M ratio because the L:M cone ratio in the macaque may be close to 1:1, rather than the 2:1 ratio in humans [25]. The assumptions of randomness and 1:1 cone ratio means that half the surround’s input should be derived from the M cone and half from the L cone. Use of a cone-isolating grating driving the receptive field center cone class should reduce the surround strength by half. Therefore, using the approximation introduced above, that BPI = 1 − S/C, one calculates BPIcc = 1−Scc/C = 1 − 1/2 (Slum/C) = 1 − 1/2(1 − BPIlum) = 1/2(1 + BPIlum). This equation describes the prediction lines in Fig. 3B. For example, consider a neuron for which the BPIlum was 0.2; the predicted BPIcc = 0.6 for a randomly connected surround.
The data of 95% of cells tested are above the predicted line based on the assumptions of random cone input to the receptive field surround and 1:1 cone ratio (Fig. 3B). The predicted BPIcc was significantly smaller than the measured BPIcc for cone-isolating gratings: both the retinal and LGN distributions were analyzed separately (p < 10−15 for each data set, paired t test).
If the surround were completely selective, the BPIcc for gratings isolating the receptive field center cone class should be close to unity. Most of the BPIcc values for center cone class isolating gratings in Fig. 3B are near 1. Taking the two data sets from midget ganglion cells and from parvocellular LGN cells together, 78% of parvocellular pathway cells had a BPI > 0.95 for the center cone class, that is, they were consistent with a very high degree of cone specificity of the receptive field surround. However, the remaining 22% showed some indication of bandpass character, consistent with some mixed L- and M-cone input to the receptive field surround, as in earlier reports of a small fraction of parvocellular LGN cells with mixed surrounds [3]. Members of this group were usually cells that had a low BPIlum for luminance gratings (i.e., strong center-surround organization). But we emphasize that many cells with low BPIlum (BPI < 0.5, strong surrounds with luminance stimuli) still had a BPIcc near 1.0 (almost no surround antagonism) for gratings isolating the center cone class. Taking the retinal and LGN data sets together, there was no systematic difference between cells with M- and L-cone centers; both had BPIcc values for the center cone class mostly near 1.0.
B. Midget Ganglion Cell Receptive Field Structure
Some spatial frequency tuning curves generated with cone-isolating stimuli showed unexpected features. Examples of spatial frequency tuning curves for the four conditions tested (luminance, chromatic, L- and M-cone isolating) for two midget ganglion cells are shown in Figs. 4A and B. One cell has BPIlum near 1.0 for luminance (Fig. 4A) and the other a BPIlum of 0.53. It should be noted that a contrast of 60% was used for luminance in the midget ganglion cell experiments, while for the other conditions in the ganglion cell experiments the cone contrast was ~30%. For comparison across conditions, luminance grating response amplitudes were scaled down by a factor of 2 to take the contrast difference into account.
Fig. 4.

Tuning curves for the two ganglion cells of Fig. 2 for luminance and chromatic modulation (upper panels) and the cone-isolating conditions (middle panels). As in Fig. 2, the data have been contrast normalized. The phase plots in the the lower panels refer to the phase difference between the responses to the M and L-cone-isolating gratings and show a 180 deg phase difference. The inset figures indicate the inverse cosine transform of the response amplitude data for the different conditions. For the cell in A, the single cone transforms show sharp peaks set on a broad pedestal. For the cell in B, the curves resemble more closely those expected of a pair of Gaussian distributions. Solid curves are the fits for a model described in the text.
There was considerable variation across the parvocellular populations in the spatial frequency tuning for luminance gratings. Implicit in a BPIlum near 1.0 is a lack of clear center-surround receptive field structure, which would be termed a Type II cell [5]. The distribution of the BPIlum for luminance grating responses formed a continuum (Fig. 3A), as reported by others [24]. The shape of the spatial frequency tuning curve from individual midget cells to luminance gratings was related to the shape of the spatial frequency tuning curves for individual cone (L and M) isolating gratings. For instance, for the midget ganglion cell of Fig. 4A, the curves for L- and M-cone-isolating gratings do not differ noticeably in shape or spatial resolution, which accounts for the lack of bandpass character of the spatial frequency tuning for luminance gratings in this cell’s receptive field. Different behavior is shown for the receptive field of the cell of Fig. 4B, where the spatial frequency tuning curves for L- and M-cone-isolating gratings do have different high-frequency cutoffs, a feature consistent with the fact that for this cell the spatial frequency tuning curve for luminance was bandpass. For most cells, the response modulation to M- and L-cone-isolating gratings were 180 deg out of phase (see phase panels in Fig. 4). The response phases to luminance and chromatic gratings were consistent with the response phase to cone-isolating gratings. The phases of responses to luminance gratings were sometimes advanced at low spatial frequencies, as has been reported for cat ganglion cells [26]. However, some cells’ receptive fields showed more complex phase behavior (see below).
We attempted to model the data in Fig. 4 with a DOG model. Since the data of Fig. 3 strongly suggest significant cone specificity to the receptive field surround, we determined the degree to which two Gaussian mechanisms, one for the L and one for the M cone, could account for all four conditions. For >50% of ganglion cells, such as that in Fig. 4A, the DOG model was inadequate. The slopes of the L- and M-cone tuning curves were too shallow to be described by the fit of a single Gaussian profile.
In order to visualize the profiles that might generate these curves, data were subject to inverse cosine transforms, which yielded the spatial weighting profiles shown in the insets of Fig. 4. For the cell of Fig. 4A, profiles are similar for the isolated L- and M-cone inputs (inset with green and orange profiles in the lower left panel) and consist of a central sharp peak, which determines spatial resolution, and broad flanks, like a pedestal, which contribute to the shallow slope. For the cell of Fig. 4B, the spatial weighting profiles resembled more closely those expected from a simple DOG receptive field structure, a single Gaussian for each receptive field component, which in this case did provide a satisfactory fit.
To capture the shape of the profiles in the insets in Fig. 4A, we chose to sum two Gaussians for each receptive field mechanism, both Gaussians having input from the same cone class but with different space constants. The resulting summed profiles in the model resemble the data shown in Fig. 4A. The equations providing the responses of each cone-specific receptive field mechanism as a function of spatial frequency (L(f), M(f)) are
| (1) |
| (2) |
where the k values represent amplitude scaling parameters and the r values are the Gaussian radii of the respective mechanisms. Thus rL1 and rL2 are the Gaussian radii of the receptive field mechanism with L-cone-specific inputs, and similarly rM1 and rM2 are the Gaussian radii of the receptive field mechanism with M-cone-specific inputs. The smaller of rL1 or rM1 defines the receptive field center cone class. Responses to luminance, chromatic, and L- or M-cone-isolating grating stimuli are thus
| (3) |
| (4) |
| (5) |
| (6) |
where the C variables represent the cone contrasts pertaining to the different conditions. There are thus eight free parameters for the four spatial frequency tuning curves, compared to the four parameters usually used for a single luminance spatial frequency tuning curve.
Data were fitted to the four tuning curves simultaneously using a least-squares criterion. The lines drawn in Fig. 4A represent such fits and for most cells gave satisfactory fits to the data; exceptions were those cells with unusual phase behavior (see below). For 19% of ganglion cells, either or both receptive field center and surround could be described by a single Gaussian. It should be noted that a simple DOG model was usually adequate to fit the luminance data alone, as reported by others [24,27]. Mean center radius for the smaller center cone mechanism (L or M) was 0.042 deg (S.D. 0.021, n = 63), and for the smaller surround cone mechanism, 0.087 (S.D. 0.038, n = 63). Mean radii for the larger mechanisms were 0.44 and 0.38 deg for the L and M cones, respectively (S.D. 0.31 and 0.24, respectively). There was much intercell variability, and a full model of the receptive field structure would require incorporation of the response phase and consideration of the responses at different orientations and temporal frequencies. This will be described further elsewhere.
C. Models of Parvocellular LGN Data
Spatial tuning curves in the parvocellular LGN neurons for the four conditions tested (luminance, isoluminant chromatic, and L- and M-cone isolating) resembled those seen in midget ganglion cells (Fig. 5). The spatial frequency response for luminance gratings was often spatially bandpass and often of low amplitude (Figs. 5A, D). The isoluminant chromatic spatial frequency response was almost always low-pass as observed before [28,29], and L- and M-cone-isolating responses were usually low-pass as described above with respect to the BPI data (Fig. 3B). The spatial profiles of cone inputs are shown in the insets of Figs. 5B and E. These data support the original conjecture of Wiesel and Hubel [5] about cone specificity in parvocellular LGN receptive fields.
Fig. 5.

Parvocellular LGN tuning curves for two example neurons. A, D, Responses to luminance and chromatic gratings; B, E, responses to L- and M-cone-isolating gratings. All data were obtained with 20% cone contrast. C, F, These phase plots refer to the phase difference between the M- and L-cone responses for spatial frequencies where there was a response above the spontaneous for both L- and M-cone-isolating stimuli. There is a 180 deg phase difference at the low spatial frequencies, indicating opponency. The insets in B and E indicate the inverse cosine transform of Gaussian mechanisms fit to the tuning curves for the different conditions. Solid curves through the spatial frequency tuning data are the best fits of a DOG model.
D. “Notch” Cells
Crook et al. [15] measured receptive field structure using M-and L-cone-isolating stimuli in midget ganglion cells in an in vitro preparation. Receptive field eccentricity was greater (eccentricity > 10 deg) in their sample than in most members of the cell samples recorded here. Spatial properties were determined in their study either using area summation curves or spatial frequency tuning curves with sine gratings, as here. They reported (their Fig. 1) that in many cells small spots (or high spatial frequencies) yielded in-phase responses for the two cones (i.e., nonopponent behavior). As they increased spot size (or decreased spatial frequency), the phase of one cone’s response reversed so that the two cone responses became opponent (roughly a 180 deg phase shift). We found at larger retinal eccentricities some cells in our retinal ganglion cell sample (12 of 63) and LGN sample (3 of 8 LGN cells in our sample with retinal eccentricities > 10 deg) with similar behavior. A ganglion cell example is shown in Fig. 6A. In the upper plot, the L- and M-cone-isolating grating spatial frequency tuning curves are shown. The L-cone curve shows a low-pass shape, but a notch (see arrow) is present in the M-cone amplitude curve. This was always associated with a large phase change, with a variable in-phase angle, but always more than 90 deg. For this cell, the L- and M-cone curves were fit separately with a DOG model, as in Crook et al. [15], which yielded a satisfactory fit for these conditions (the L-cone only required a single Gaussian). However, the luminance and chromatic grating tuning data for this cell (Fig. 6A, lower graph) were poorly captured. Similar difficulties in fitting all four spatial frequency tuning curves with a single set of parameters were found with other cells showing phase reversals. A full model would require inclusion of response phase information and orientation parameters; however, it is also possible that there might be nonlinear interactions between the center and surround that cannot be captured with the linear theory we used. Investigating the detailed receptive field structure of notch cells goes beyond the scope of the current investigation.
Fig. 6.

A, Examples of tuning curves from a neuron with a “notch” effect for one of the cone-isolating conditions (upper panel). The L-cone tuning curve is low-pass, but the M-cone shows a tuning curve with a minimum (arrow), followed by a further peak; such notches were associated with a phase change (>90 deg). Curves indicate fits of a DOG model. However, tuning curves for luminance and chromatic gratings were poorly predicted. Further details are in the text. B, Eccentricity distribution of ganglion cells; those showing a notch feature were at eccentricities of 10 deg or above.
Figure 6B shows the distribution of our ganglion cell sample over eccentricity. The “notch” cells were found at eccentricities of 10 deg or more (p < 0.001, Kolmogorov–Smirnov test). This suggests that this notch behavior may be associated with changes in the midget parvocellular pathway with eccentricity, as discussed in Section 4.
These data together with the analyses of Fig. 4 suggest that the receptive field structure of P cells is more complex than usually supposed and, for some cells at least, it is not captured well with a Gaussian model. It also suggests that the notch behavior described by Crook et al. [15] is, as they suggest, dependent on retinal eccentricity.
4. DISCUSSION
Debate as to the organization of the cone inputs to P cells’ receptive fields has centered around whether or not the underlying cone connectivity to the surround of the center-surround receptive fields of P cells is random, as proposed first by Paulus and Kröger-Paulus [10]. The results in the present paper are consistent with earlier physiological evidence [3,4,12,30] that there is a considerable degree of cone selectivity, i.e., nonrandomness of connections, in the receptive field surround of midget ganglion cells and parvocellular LGN cells in macaque monkeys. A recent study of parvocellular neurons in the marmoset LGN confirms most of our findings and reaches similar conclusions [31]. However, the cone selectivity observed in most cells is not complete in a fraction (~20–25%) of midget and Parvocellular neurons, as noted previously [3]. It can be argued [32] that cone-selective input to the receptive field surround increases the signal-to-noise ratio of the chromatic signal in the presence of receptor noise, but complete selectivity offers little extra advantage over, say, 80% selectivity.
The major difficulty with the selective surround hypothesis is that it has proved difficult to find an anatomical substrate for the selectivity (e.g., Calkins and Sterling [33]). It could be argued that physiological measurement provides a more direct index of selectivity than anatomical inference, since it is difficult to judge, for example, synaptic efficacy from anatomical data. One recent anatomical observation of relevance is the description of a large-field bipolar cell, which may receive selective input from the L or M cone, thus providing a possible selective signal to the inner plexiform layer [34].
The wide range of BPI values for luminance modulation (Fig. 3) reflects a wide range of center-surround antagonism in P cells. Such variation has been reported previously in the literature on the parvocellular pathway in macaques (e.g., Derrington and Lennie [24]; Fig. 3) but has received little attention apart from the original observation of Wiesel and Hubel [5].
The recent results of Crook et al. [15] and those presented here indicate that additive M- and L-cone input to the receptive field center of midget cells with receptive fields located at eccentricities beyond 10 deg can be revealed by measurements at high spatial frequencies or with small stimuli. This is consistent with convergence of midget bipolar input onto midget ganglion cells in the peripheral retina, as suggested by anatomical estimates [35]. It may also be consistent with results of Field et al. [16], who showed that there is some selectivity in cone inputs to the centers of on-center peripheral midget ganglion cells but not to peripheral off-center cells.
However, even though their receptive field centers receive randomly mixed cone input, with large stimuli many peripheral retinal ganglion cells show cone-opponent properties [13,17] as Crook et al. confirm. Specifically, the notch cells discussed by Crook et al. [15] that resemble the cells we analyzed in Fig. 6 are color-opponent cells for stimuli of large size and/or low spatial frequency. This implies an unbalanced, selective cone input to the receptive field surround of such notch cells. We calculated (not shown) that given their estimates of receptive field surround diameter and known cone density [36], the imbalance of cone inputs to peripheral ganglion cells in Crook et al.’s Fig. 1F [15] would be very unlikely on a random basis. Peripheral cone opponency thus requires some cone selectivity of the input to the receptive field surround. Therefore, we suggest that although there may be random factors in midget (P) cell connectivity, the cumulative evidence suggests that cone-selective connectivity increases the signal-to-noise ratio of the red–green chromatic signal. How cone selectivity occurs in detail remains unknown. Crook et al. [15] obtained the important result that the midget-cell surround signal is unlikely to be caused by feedforward inhibition onto midget ganglion cells.
The relation of red–green opponency to retinal eccentricity remains unresolved. Psychophysically, the loss of sensitivity to |M–L| modulated stimuli as a function of eccentricity was first ascribed to the increasing convergence of midget bipolar onto ganglion cells [37]. However, the decrease in psychophysical chromatic sensitivity occurs well before the anatomical selectivity of the midget pathway is compromised [2]. Even more surprising, recordings from P cells indicate that strong M and L opponent signals can be recorded at eccentricities well beyond an eccentricity at which a degradation of cone opponency might be expected on an anatomical basis [13,17]. Thus, three sets of data (psychophysical, anatomical, and physiological) yield different rates of loss of cone opponency with eccentricity. This suggests that from a psychophysical perspective several components may contribute to the loss of peripheral color sensitivity: there may be components based in retinal anatomy and physiology as well as a cortical component. However, the cumulative physiological data [15,16] (Figs. 3 and 5, this paper) suggests that eccentricity-dependent changes in retinal circuitry and physiology do occur, and understanding the mechanisms of these changes remains an important challenge for future research.
Acknowledgments
This work was supported by NEI Grants EY13112 (B. B. Lee), EY01472 (R. M. Shapley), and EY08300 (M. J. Hawken).
References
- 1.DeValois RL. Analysis and coding of color vision in the primate visual system. Cold Spring Harb Symp Quant Biol. 1965;30:567–579. doi: 10.1101/sqb.1965.030.01.055. [DOI] [PubMed] [Google Scholar]
- 2.Lee BB, Martin PR, Grünert U. Retinal connectivity and primate vision. Prog Retin Res. 2010;29:622–639. doi: 10.1016/j.preteyeres.2010.08.004. [DOI] [PMC free article] [PubMed] [Google Scholar]
- 3.Reid RC, Shapley RM. Spatial structure of cone inputs to receptive fields in primate lateral geniculate nucleus. Nature. 1992;356:716–718. doi: 10.1038/356716a0. [DOI] [PubMed] [Google Scholar]
- 4.Reid RC, Shapley RM. Space and time maps of cone photoreceptor signals in macaque lateral geniculate nucleus. J Neurosci. 2002;22:6158–6175. doi: 10.1523/JNEUROSCI.22-14-06158.2002. [DOI] [PMC free article] [PubMed] [Google Scholar]
- 5.Wiesel T, Hubel DH. Spatial and chromatic interactions in the lateral geniculate body of the rhesus monkey. J Neurophysiol. 1966;29:1115–1156. doi: 10.1152/jn.1966.29.6.1115. [DOI] [PubMed] [Google Scholar]
- 6.Polyak SL. The Retina. University of Chicago; 1941. [Google Scholar]
- 7.Boycott BB, Dowling JE. Organization of the primate retina: light microscopy. Phil Trans R Soc Lond B. 1969;255:109–184. doi: 10.1098/rspb.1966.0086. [DOI] [PubMed] [Google Scholar]
- 8.Kaplan E, Shapley R. The origin of the S (slow) potential in the mammalian lateral geniculate nucleus. Exp Brain Res. 1984;55:111–116. doi: 10.1007/BF00240504. [DOI] [PubMed] [Google Scholar]
- 9.Lee BB, Virsu V, Creutzfeldt OD. Linear signal transmission from prepotentials to cells in the macaque lateral geniculate nucleus. Exp Brain Res. 1983;52:50–56. doi: 10.1007/BF00237148. [DOI] [PubMed] [Google Scholar]
- 10.Paulus W, Kröger-Paulus A. A new concept of retinal colour coding. Vis Res. 1983;23:529–540. doi: 10.1016/0042-6989(83)90128-1. [DOI] [PubMed] [Google Scholar]
- 11.Lennie P, Haake PW, Williams DR. The design of chromatically opponent receptive fields. In: Landy MS, Movshon JA, editors. Computational Models of Visual Processing. MIT; 1991. pp. 71–82. [Google Scholar]
- 12.Lee BB, Kremers J, Yeh T. Receptive fields of primate ganglion cells studied with a novel technique. Vis Neurosci. 1998;15:161–175. doi: 10.1017/s095252389815112x. [DOI] [PubMed] [Google Scholar]
- 13.Martin PR, Lee BB, White AJ, Solomon SG, Rüttiger L. Chromatic sensitivity of ganglion cells in peripheral primate retina. Nature. 2001;410:933–936. doi: 10.1038/35073587. [DOI] [PubMed] [Google Scholar]
- 14.Benardete EA, Kaplan E. The receptive field of the primate P retinal ganglion cell I: linear dynamics. Vis Neurosci. 1997;14:169–186. doi: 10.1017/s0952523800008853. [DOI] [PubMed] [Google Scholar]
- 15.Crook JD, Manookin MB, Packer OS, Dacey DM. Horizontal cell feedback without cone type-selective inhibition mediates “red-green” color opponency in midget ganglion cells of the primate retina. J Neurosci. 2011;31:1762–1772. doi: 10.1523/JNEUROSCI.4385-10.2011. [DOI] [PMC free article] [PubMed] [Google Scholar]
- 16.Field GD, Gauthier JL, Sher A, Greschner M, Machado TA, Jepson LH, Shlens J, Gunning DE, Mathieson K, Dabrowski W, Paninski L, Litke AM, Chichilnisky EJ. Functional connectivity in the retina at the resolution of photoreceptors. Nature. 2010;467:673–677. doi: 10.1038/nature09424. [DOI] [PMC free article] [PubMed] [Google Scholar]
- 17.Solomon SG, Lee BB, White AJ, Ruttiger L, Martin PR. Chromatic organization of ganglion cell receptive fields in the peripheral retina. J Neurosci. 2005;25:4527–4539. doi: 10.1523/JNEUROSCI.3921-04.2005. [DOI] [PMC free article] [PubMed] [Google Scholar]
- 18.Lee BB, Martin PR, Valberg A. Sensitivity of macaque retinal ganglion cells to chromatic and luminance flicker. J Physiol. 1989;414:223–243. doi: 10.1113/jphysiol.1989.sp017685. [DOI] [PMC free article] [PubMed] [Google Scholar]
- 19.Lee BB, Virsu V, Elepfandt A. Phase of responses to moving gratings in cells of the cat retina and lateral geniculate nucleus. J Neurophysiol. 1981;45:807–817. doi: 10.1152/jn.1981.45.5.807. [DOI] [PubMed] [Google Scholar]
- 20.Smith VC, Pokorny J. Spectral sensitivity of the foveal cone photopigments between 400 and 500 nm. Vis Res. 1975;15:161–171. doi: 10.1016/0042-6989(75)90203-5. [DOI] [PubMed] [Google Scholar]
- 21.Shapiro AG, Pokorny J, Smith VC. Cone-rod receptor spaces with illustrations that use CRT phosphor and light-emitting-diode spectra. J Opt Soc Am A. 1996;13:2319–2328. doi: 10.1364/josaa.13.002319. [DOI] [PubMed] [Google Scholar]
- 22.Merrill EG, Ainsworth A. Glass-coated platinum-plated tungsten microelectrodes. Med Biol Eng. 1972;10:662–672. doi: 10.1007/BF02476084. [DOI] [PubMed] [Google Scholar]
- 23.Enroth-Cugell C, Robson JG. The contrast sensitivity of retinal ganglion cells of the cat. J Physiol. 1966;187:517–552. doi: 10.1113/jphysiol.1966.sp008107. [DOI] [PMC free article] [PubMed] [Google Scholar]
- 24.Derrington AM, Lennie P. Spatial and temporal contrast sensitivities of neurons in lateral geniculate nucleus of macaque. J Physiol. 1984;357:219–240. doi: 10.1113/jphysiol.1984.sp015498. [DOI] [PMC free article] [PubMed] [Google Scholar]
- 25.Dobkins KR, Thiele A, Albright TD. Comparison of red-green equiluminance points in humans and macaques: evidence for different L:M cone ratios between species. J Opt Soc Am A. 2000;17:545–556. doi: 10.1364/josaa.17.000545. [DOI] [PubMed] [Google Scholar]
- 26.Enroth-Cugell C, Robson JG, Schweitzer-Tong DE, Watson AB. Spatiotemporal interactions in cat retinal ganglion cells showing linear spatial summation. J Physiol. 1983;341:279–307. doi: 10.1113/jphysiol.1983.sp014806. [DOI] [PMC free article] [PubMed] [Google Scholar]
- 27.Croner LJ, Kaplan E. Receptive fields of P and M ganglion cells across the primate retina. Vis Res. 1995;35:7–24. doi: 10.1016/0042-6989(94)e0066-t. [DOI] [PubMed] [Google Scholar]
- 28.Hicks TP, Lee BB, Vidyasagar TR. The responses of cells in macaque lateral geniculate nucleus to sinusoidal gratings. J Physiol. 1983;337:183–200. doi: 10.1113/jphysiol.1983.sp014619. [DOI] [PMC free article] [PubMed] [Google Scholar]
- 29.DeValois RL, DeValois KK. In: Spatial Vision. Broadbent DE, editor. Oxford University; 1988. Oxford Psychology Series. [Google Scholar]
- 30.Buzas P, Blessing EM, Szmadja BA, Martin PR. Specificity of M and L cone inputs to receptive fields in the parvocellular pathway: random wiring with functional bias. J Neurosci. 2006;26:11148–11161. doi: 10.1523/JNEUROSCI.3237-06.2006. [DOI] [PMC free article] [PubMed] [Google Scholar]
- 31.Martin PR, Blessing EM, Buzas P, Szmajda BA, Forte JD. Transmission of colour and acuity signals by parvocellular cells in marmoset monkeys. J Physiol. 2011;589:2795–2812. doi: 10.1113/jphysiol.2010.194076. [DOI] [PMC free article] [PubMed] [Google Scholar]
- 32.Lee BB. Neural models and physiological reality. Vis Neurosci. 2008;25:231–241. doi: 10.1017/S0952523808080140. [DOI] [PMC free article] [PubMed] [Google Scholar]
- 33.Calkins DJ, Sterling P. Absence of spectrally specific lateral inputs to midget ganglion cells in primate retina. Nature. 1996;381:613–615. doi: 10.1038/381613a0. [DOI] [PubMed] [Google Scholar]
- 34.Joo HR, Peterson BB, Haun TJ, Dacey DM. Characterization of a novel large-field cone bipolar cell type in the primate retina: evidence for selective cone connections. Vis Neurosci. 2011;28:29–37. doi: 10.1017/S0952523810000374. [DOI] [PMC free article] [PubMed] [Google Scholar]
- 35.Wässle H, Grünert U, Martin PR, Boycott BB. Color coding in the primate retina: predictions and constrants from anatomy. In: Albowitz B, Albus K, Kuhnt U, ChNothdurft H, Wahle P, editors. Structural and Functional Organization of the Neocortex. A Symposium in the Memory of Otto D. Creutzfeldt. Springer; 1994. pp. 94–104. [Google Scholar]
- 36.Packer O, Hendrickson AE, Curcio CA. Photoreceptor topography of the retina in the adult pigtail macaque (macaca nemestrina) J Comp Neurol. 1989;288:165–183. doi: 10.1002/cne.902880113. [DOI] [PubMed] [Google Scholar]
- 37.Mullen KT, Kingdom FA. Losses in peripheral colour sensitivity predicted from “hit or miss” post-receptoral cone connections. Vis Res. 1996;36:1995–2000. doi: 10.1016/0042-6989(95)00261-8. [DOI] [PubMed] [Google Scholar]