Abstract
A mechanism for polymerization shrinkage and stress reduction was developed for heterogeneous networks formed via ambient, photo-initiated polymerization-induced phase separation (PIPS). The material system used consists of a bulk homopolymer matrix of triethylene glycol dimethacrylate (TEGDMA) modified with one of three non-reactive, linear prepolymers (poly-methyl, ethyl and butyl methacrylate). At higher prepolymer loading levels (10–20 wt%) an enhanced reduction in both shrinkage and polymerization stress is observed. The onset of gelation in these materials is delayed to a higher degree of methacrylate conversion (~15–25%), providing more time for phase structure evolution by thermodynamically driven monomer diffusion between immiscible phases prior to network macro-gelation. The resulting phase structure was probed by introducing a fluorescently tagged prepolymer into the matrix. The phase structure evolves from a dispersion of prepolymer at low loading levels to a fully co-continuous heterogeneous network at higher loadings. The bulk modulus in phase separated networks is equivalent or greater than that of poly(TEGDMA), despite a reduced polymerization rate and cross-link density in the prepolymer-rich domains.
INTRODUCTION
Currently, a main issue in the implementation of polymeric materials is the volumetric shrinkage that occurs during cure. This shrinkage, caused by a reduction in free volume as monomer converts to polymer, leads to a build-up of polymerization stress both internally and at the interface of the substrate to which the material is applied, causing defects such as cracks within the material and delamination of a bonded surface. It is well known that volumetric shrinkage and stress development within a polymer network is a complex and dynamic process that evolves with the modulus and shrinkage strain during the polymerization. The relative magnitude is dependent on a variety of factors that are based in either the formulation chemistry or the processing conditions. Formulation factors determine the polymerization mechanism based on the monomer selection that sets the initial reactive group concentration and to some extent, the limiting overall conversion. The initiator selection and concentration, as well as any filler or additives in the matrix can also be considered formulation factors. Processing conditions that impact the development of polymerization stress include the rate of polymerization, which in a photo-initiated system is related to the irradiation intensity in combination with the initiator used, and other factors such as the cure temperature, pressure and oxygen exposure.1 In methacrylic based materials, the average volume reduction is approximately 23 cm3 per mole of converted reactive group.2 To address this issue, research has focused on the development of methods that employ both formulation and processing factors to create materials that have low volumetric shrinkage during cure, but also can maintain critical performance properties such as strength, appearance and thermal stability necessary for a specific application.1,3–8
One such approach directed toward shrinkage control has been to develop heterogeneous networks via polymerization-induced phase separation (PIPS). With this method, a heterogeneous network is formed from an initially homogeneous multi-component monomer formulation. The reaction of monomer into polymer leads to limited miscibility of the components in the formulation. This thermodynamic instability promotes phase separation during the reaction to obtain an overall lower free energy. If diffusion is possible at the onset of phase separation, partially or fully immiscible phases will form based on monomer diffusion processes. When applied to crosslinking polymerizations, the extent of phase separation is dependent on order of gelation and phase separation, and the time allowed for morphologic evolution between these two reaction benchmarks.9 For instance, if gelation precedes the onset of phase separation, diffusion may be so hindered that heterogeneous network development via phase separation is limited or even precluded despite any thermodynamic instability. This incomplete phase separation results in a network that may have a degree of heterogeneity to it, but no distinct phase structure. However if the reverse occurs and phase separation precedes gelation, a more complete diffusion of immiscible phases can occur. The longer the interval between phase separation and gelation, more phase structure evolution can occur before being locked into place by the network formation.10 Heterogeneous network formation via PIPS has many advantages, one of which being that the final network structure and material properties can be tuned based on a balance between the kinetics and thermodynamics of the polymerization reaction.11–13
As previously stated, the development of volumetric shrinkage and stress during a polymerization has been studied extensively in the context of curing method, polymerization rate, degree of conversion and the relative modulus of the polymer formed.1,3–7 Materials developed via PIPS potentially display a reduction in volumetric polymerization shrinkage.10,14–17 However, current research is limited to this observation with an incomplete understanding of how and why this physical reduction occurs. One study into PIPS in an acrylic-based copolymer system hypothesizes that the largest degree of shrinkage reduction occurs with a maximum interfacial volume between the incompatible phases.18 While another study into an epoxy-based system suggests that a continuous phase rich in a thermoplastic material is necessary for effective shrinkage control.11 Another study attributes stress reduction to micro-void formation along interfaces between continuous phases, which can be controlled through the temperature at which the polymerization is conducted.14 Unfortunately, these specific approaches and studies are not well suited for many in-situ or biomedical applications based on the curing mechanisms and conditions, monomer formulations, and curing time. Additionally, these studies rely heavily on the effect of thermal contraction working on phases fully cured at elevated temperatures. Limited work has been done to elucidate the physical process that leads to enhanced shrinkage and stress reduction, especially under ambient photopolymerization conditions,19,20 which constitutes a growth segment across a wide variety of polymer applications.
Previously, we reported a method to develop heterogeneous networks via PIPS in a photo-initiated, ambient, free-radical dimethacrylate polymerization.21 This method has many advantages including: spatial and temporal control of the photocuring process, high strength and cross-link density of the final material and fast reaction times, making it suitable for many in-situ applications. In this system, a bulk homopolymer matrix of triethylene glycol dimethacrylate (TEGDMA) was modified by the addition of three non-reactive, linear prepolymers (poly-methyl, ethyl and butyl methacrylate). In our studies, we were able to measure both the onset of gelation and phase separation as a function of conversion, and found that phase separation either coincides with, or precedes gelation, allowing some time for diffusion of incompatible phases, resulting in networks with two phases: one rich in poly(TEGDMA) and the other rich in a mixture of poly(TEGDMA)/prepolymer. At specific loadings of prepolymer an enhanced reduction in volumetric shrinkage was observed. Here, we continue our study of this system and focus on better understanding the physical mechanism of shrinkage reduction in a network formed via PIPS in an ambient photopolymerization. Additionally, we explore this mechanism in the context of polymerization stress development, which has only been studied in all-monomeric (no prepolymer present in the matrix) PIPS-based networks,22 but is at least equally important as volumetric shrinkage when applying materials to an application where one, or multiple bonded interfaces are necessary.
EXPERIMENTAL
Materials
Triethylene glycol dimethacrylate (TEGDMA, Esstech) was utilized for the bulk homopolymerizations in these studies. The matrix was modified by the addition of three commercially obtained (Aldrich) prepolymers: poly-methyl, -ethyl, and -butyl methacrylate (PMMA, PEMA, and PBMA). The weight-average molecular weights, glass transition temperatures (Tg) and densities of each are presented in Table 1. The photo-initiator in all studies was 2,2-dimethoxy-2-phenylacetophenone (DMPA), which absorbs in the UV-region. In all studies, a loading of 0.5 wt% (relative to monomer/prepolymer mass) DMPA was used, and 365 (±10) nm UV light was the irradiation source. The preparation of TEGDMA/prepolymer formulations was described in our previous work.21
TABLE 1.
Pre-polymer Properties
| Poly (methyl methacrylate) (PMMA) |
Poly (ethyl methacrylate) (PEMA) | Poly (butyl methacrylate) (PBMA) |
|---|---|---|
| MW~120,000 Da | MW~515,000 Da | MW~337,000 Da |
| Tg~117(±6.0) °C | Tg~72.5(±1.1) °C | Tg~22.4(±2.5) °C |
| ρ=1.19 g mL−1 | ρ=1.11 g mL−1 | ρ=1.07 g mL−1 |
Poly-Fluor-PMMA Synthesis
To evaluate the network structure of phase-separated materials, a fluorescently tagged prepolymer was developed. This pink-colored prepolymer was synthesized by introduction of a methacrylate-substituted fluorescent group (methacryloxyethyl thiocarbamoyl rhodamine B, Poly Fluor 570, Polysciences) into a bulk thermal polymerization of methyl methacrylate. The fluorescent group was introduced at a level of 0.02 wt% relative to methyl methacrylate. Conversion was monitored through the change in methacrylate peak area (1635 cm−1) in the mid-IR with the carbonyl absorption (1720 cm−1) used as an internal reference. Molecular weight was measured by gel permeation chromatography (Mw~52,000, PDI~1.67). The polymer structure was verified by NMR spectroscopy. The fluorescent group on this prepolymer (referred to as PF-PMMA) has an excitation maximum at 548 nm and an emission maximum at 570 nm.
Three point bending
Bar-shaped samples (~20 mm × 2 mm × 2 mm, l × w × t) were fabricated via ambient photopolymerization (Io =5mW cm−2). The samples were tested in a universal testing machine (Mini Bionix 858, MTS, Eden Prairie, MN, USA) equipped with a 10 N load cell for flexural strength and elastic modulus (n=3). All analyses were performed with a crosshead speed of 1mm min−1 and a 15 mm span between supporting rollers. The flexural modulus was calculated by extracting data from the initial linear portion of the load vs. displacement curve, and applying the formula:
Where:
C=load at fracture (N)
d=displacement (mm)
L= distance between the supports (mm)
b= width of specimen (mm)
h= height of specimen (mm).
Tensometer
Real-time polymerization stress was monitored under ambient conditions using a cantilever beam-based tensometer (Paffenberger Research Center, American Dental Association Health Foundation, Gaithersburg, MD) combined with a UV light source to facilitate cure of the material (λ=365±10nm). The setup allowed simultaneous monitoring of material conversion with a Fourier transform infrared spectrometer (FTIR) equipped with near-IR fiber optic cables (Thermo Scientific, Nicolet 6700). The degree of conversion (DC) of each sample was calculated by monitoring the dynamic change in peak area of the methacrylate (=CH2, first overtone at 6165 cm−1). All samples (n=3) were disc-shaped, with 6mm diameter and 1mm thickness. The details of this instrument and its operation are described more fully in other publications.23,24
Confocal Microscopy
A microscope (Nikon A1R) was used to image phase structure of polymerized materials. In all experiments, a 20× (Numerical aperture ~ 0.75) objective was used in the confocal imaging mode. The 4CH+DIC (four channel detector + differential interference contrast) setting was used to selectively excite at 561 nm and collect fluorescence from a 525/±25 bandpass filter (based on the fluorescent probe present in polymeric materials). All images were collected in the ‘Galvano’ mode, with a laser power of 5 % and a gain of 90. Thin-film samples for confocal analysis were prepared by photocuring monomer formulations between a glass slide and coverslip. In all experiments the irradiation intensity was measured from the top surface of the coverslip. Sample thickness was maintained between 70–100 µm. To ensure no difference in phase structure as a function of the z-dimension, z-stack images were collected. Since the domain size (discussed below) was the same order as the thickness of the samples, no variations in phase structure were observed in the z-direction. Therefore, all images presented here are 2-dimensional.
Photo-Rheometry
A parallel-plate rheometer (TA Ares) was equipped with a UV light source (λ=365±10 nm) that was coupled to an in-house designed optical attachment25 that provides measurement of the gel point (assigned as the G’/G” crossover point26) and methacrylate conversion simultaneously. The methacrylate conversion was monitored, as described previously, using an FTIR spectrometer (Thermo Scientific, Nicolet 6700) equipped with near-IR fiber optic cables. The optical attachment, constructed specifically for this set-up facilitated both the uniform irradiance of the UV curing light and the near-infrared source to be directed through the sample, which was sandwiched between two quartz plates (22 mm diameter). Sample thickness was maintained at 300 µm in all experiments. A chamber was constructed to allow for nitrogen purging. Each sample underwent 1 h of nitrogen purge before analysis, with the plates separated to approximately 1.5 mm to remove dissolved oxygen and avoid oxygen-inhibited edge effects that otherwise confound the rheologic data. Incident UV light irradiance (Io) was 300 µW cm−2 in all experiments (n=3).
Volumetric Shrinkage
Volumetric shrinkage was measured with a linometer (ACTA, The Netherlands). A drop of monomer was sandwiched between a glass slide and an aluminum disc that was placed on top of a non-contact probe. A light guide was positioned so that the monomer was irradiated from above the glass slide, and the irradiation intensity was measured from the top surface of the glass slide. As the material polymerized and contracted, the aluminum disc was lifted and the differences in potential sensed by the probe was recorded by the instrument software. The dynamic linear shrinkage results (n=3) were converted into volumetric shrinkage data as previously described.27 Methacrylate conversion was monitored simultaneously utilizing FTIR equipped with near-IR fiber optic cables.7
Optical Density during Polymerization
To measure optical properties during polymerization a UV/Vis portable spectrometer (Ocean Optics, USB2000) was used. A disc-shaped sample (thickness = 240 µm, diameter =10 mm) was secured so that a near-IR source, visible light source, and UV curing light source could transmit simultaneously through the material. The near-IR source was employed to monitor conversion under the same conditions as described above. To follow the changes in optical density of the polymerizing sample, the UV/Vis spectrometer was employed. A visible light source that emits broadband 400–800 nm wavelength light as a photo probe independent of the photoinitiator was used with the intensity of the 600 nm wavelength transmitted through the sample monitored in real time. The photoinitiator in this study (DMPA) does not absorb above 380nm,28 so the visible light source did not alter the photopolymerization kinetics.
RESULTS AND DISCUSSION
Volumetric Shrinkage
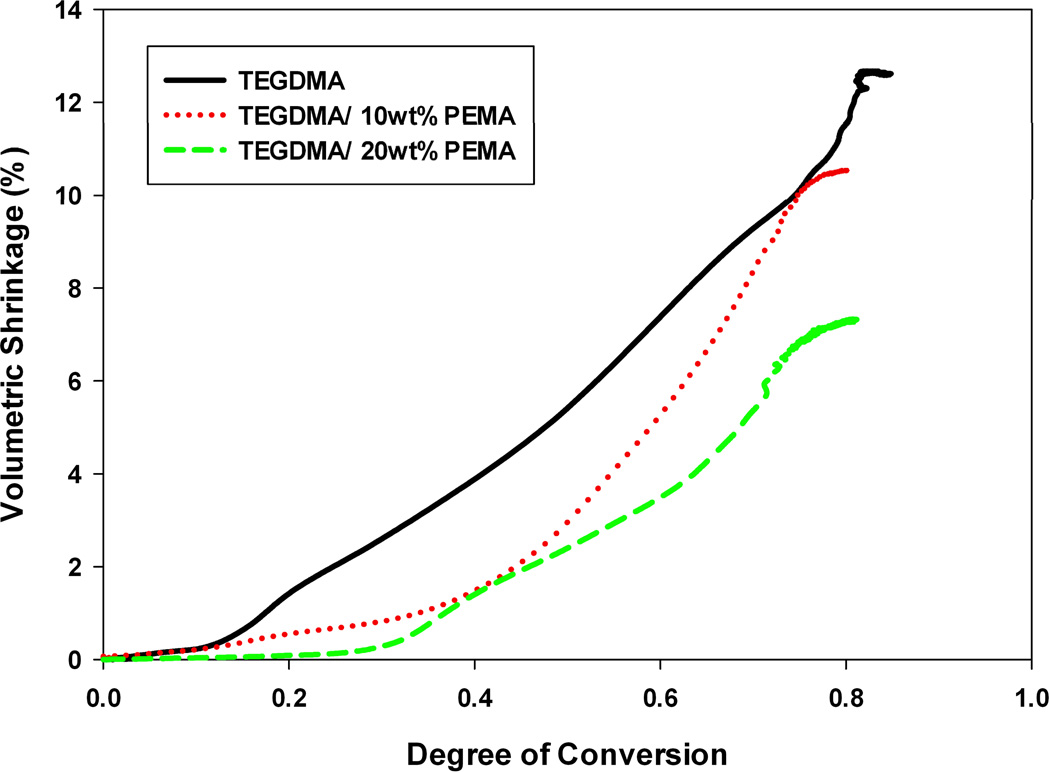
Figure 1 displays volumetric shrinkage as a function of conversion for three different material formulations: poly(TEGDMA), TEGDMA/10 wt% PEMA, and TEGDMA/20 wt% PEMA. Shrinkage measurements were conducted in triplicate, however in Figure 1, each curve denotes a single representative experiment. The two resins modified with PEMA have been shown to undergo PIPS.21 When prepolymer is introduced into the matrix, there is a decrease in the overall volumetric shrinkage experienced by the network. One would expect this result to a certain degree, as introducing the prepolymer into the monomer formulation decreases the overall double-bond concentration, which directly contributes to polymerization shrinkage.
FIGURE 1.
Real-time volumetric shrinkage of TEGDMA/PEMA materials at varying prepolymer loading levels; Io=5mW cm−2.
The extent of shrinkage reduction can be predicted in these materials, based on the double bond concentration, the final degree of conversion, and the molar volume change associated with methacrylate conversion2 through the relationship in Equation 1.
| (1) |
Where χ= degree of conversion
[C=C] = initial methacrylate concentration (mol ml−1)
ΔVSC=C = molar coefficient of shrinkage for methacrylate group (22.5 cm3 mol−1)
With this relationship, the expected volumetric shrinkage for the poly(TEGDMA) control is ~12.4 % (±0.03). The observed poly(TEGDMA) shrinkage was 13.0 % (±1.20), validating that Equation 1 is an accurate and appropriate relationship. The expected final volumetric shrinkage of the PEMA-modified materials in Figure 1 based on this equation are 10.7 and 9.5 % for the 10 wt% PEMA and 20 wt% PEMA, respectively. In the network modified with 10 wt% PEMA, this expected value is in good agreement with the observed value (10.5 %), and in the 20 wt% modification the volumetric shrinkage observed is significantly lower (7.3 %) than expected, indicating that phase-separation does result in a physically enhanced shrinkage reduction amounting to more than 20 % beyond that expected from monomer displacement by the prepolymer.
Polymerization Stress
Volumetric shrinkage often has been the property of primary interest when characterizing the benefits of phase-separated networks.14,15,29 However, also of significance is the related build-up of polymerization stress, especially when utilizing polymer networks in applications where one or multiple bonded interfaces are necessary. To understand the impact of PIPS on this property, the real-time development of polymerization stress during ambient photopolymerization was measured in situ using a cantilever beam tensometer. Methacrylate conversion was measured simultaneously utilizing an FTIR spectrometer equipped with near-IR fiber optic cables thereby permitting stress development to be monitored as a function of conversion.
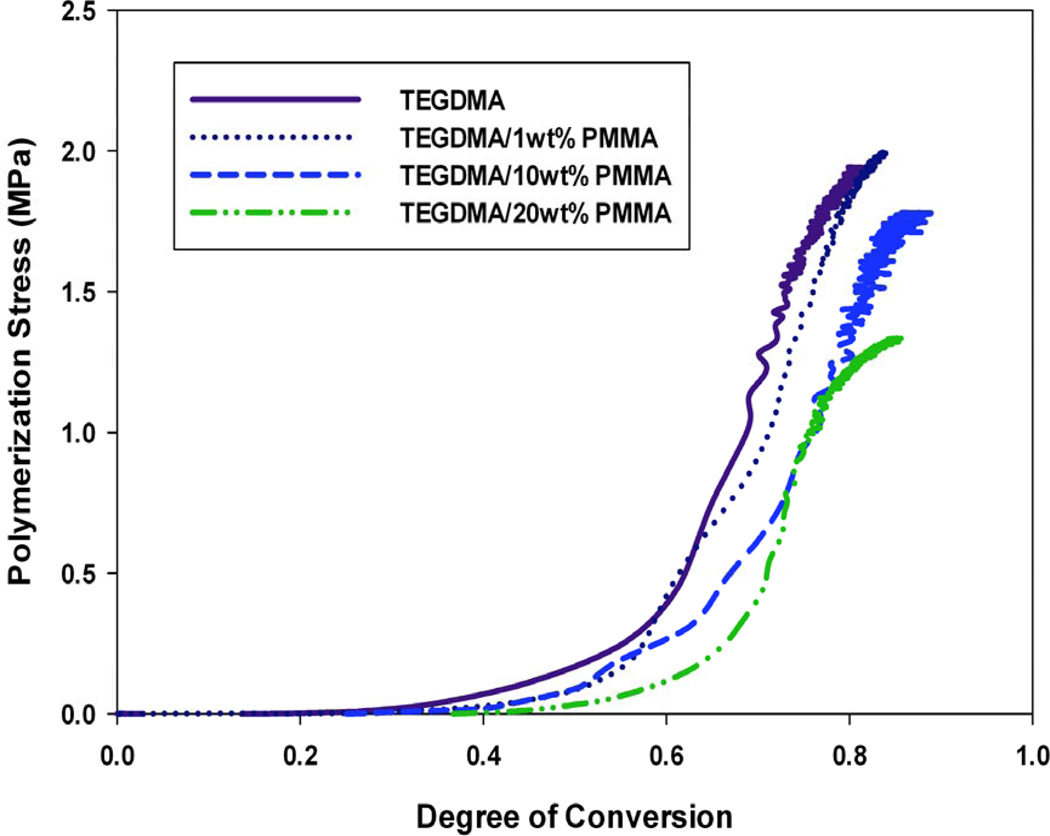
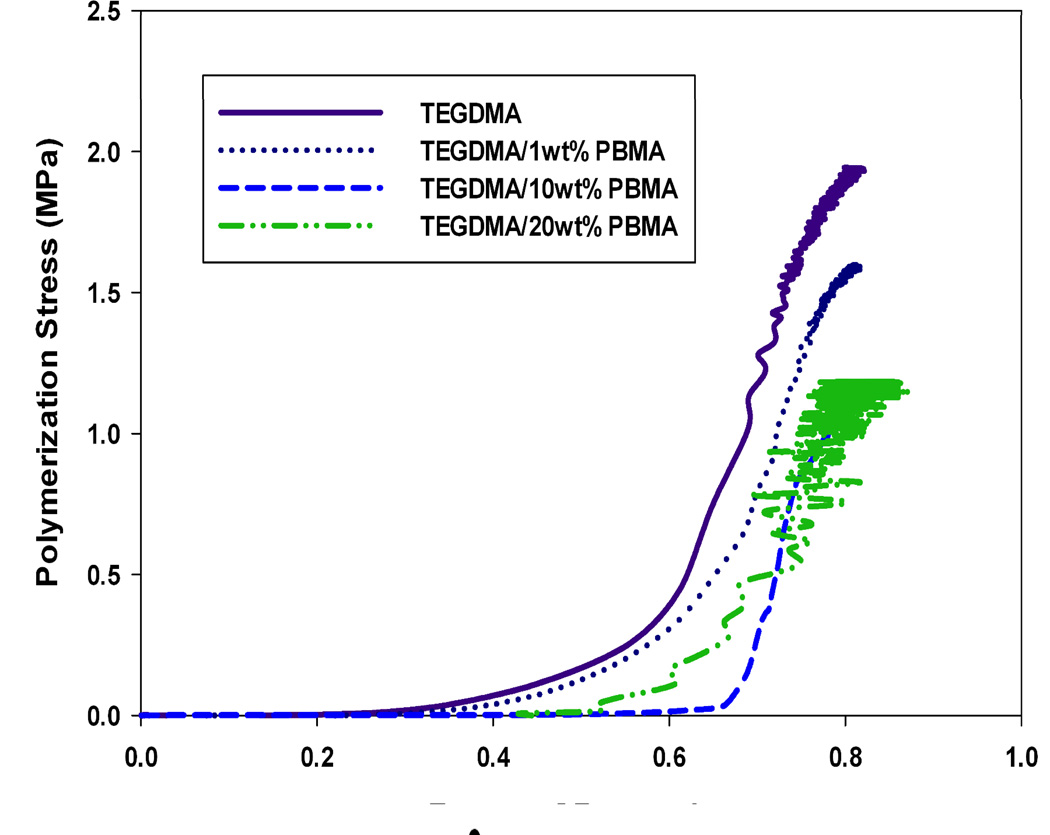
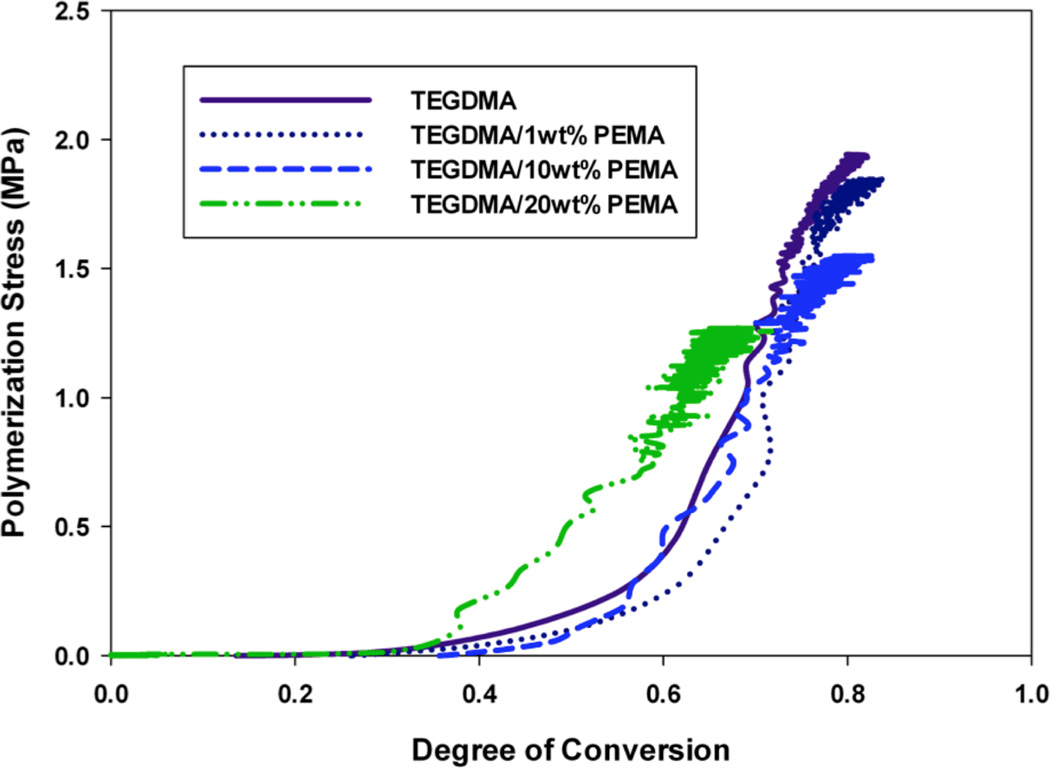
Figures 2–4 display the stress development with respect to conversion for each modifying prepolymer (PMMA, PEMA, PBMA) at loading levels of 0, 1, 10 and 20 wt%. As with the volumetric shrinkage study, each material was tested in triplicate with a single, representative profile presented. The loading levels were chosen since they promote differences in reaction kinetics and gelation behavior.21 Here, the incident light intensity is Io=5 mW cm−2. In all cases, the addition of prepolymer to the TEGDMA matrix reduces the overall polymerization stress. As with volumetric shrinkage, one would expect a reduction in stress relative to the loading level of prepolymer, since the introduction of prepolymer to the matrix reduces the concentration of reactive methacrylate groups. In all the materials with moderate to high prepolymer loading levels, with the exception of TEGDMA/10 wt% PMMA, the reduction in polymerization stress is greater than the prepolymer volume fraction, indicating that in these cases PIPS may further alleviate the effect of polymerization stress. In some material formulations, specifically, TEGDMA/20 wt% PBMA, there is a reduction in stress as great as 40 %.
FIGURE 2.
Real-time polymerization stress of TEGDMA/PMMA materials at varying prepolymer loading levels; Io=5 mW cm−2.
FIGURE 4.
Real-time polymerization stress of TEGDMA/PBMA materials at varying prepolymer loading levels; Io=5 mW cm−2.
At higher prepolymer loading levels of PMMA (20 wt%) and PBMA (10 and 20 wt%), the reduction in overall stress is accompanied by a delay (i.e. higher degree of conversion) in the onset of stress development. These materials also obtain an equivalent, or in some cases higher, degree of final conversion than the poly(TEGDMA) control, which is desirable for any type of in-situ application where diffusion of unreacted monomer out of the polymer network over time is unfavorable. These effects can be attributed to an enhanced auto-acceleration effect caused by low concentrations (1–5 wt%) prepolymer in the poly(TEGDMA)-rich domains during polymerization21, resulting in an overall higher degree of conversion. Although they also experience a reduction in overall polymerization stress (Figure 3), materials modified by PEMA experience no delay in the onset of stress development nor do they have a higher degree of final conversion. Formulations modified by PEMA, due to its relatively high molecular weight (Table 1) have a higher viscosity than the PMMA or PBMA modified counterparts at any given loading level. This increase in viscosity reduces the overall rate of polymerization significantly (compared to a poly(TEGDMA) polymerization) at loading levels as low as 5 wt%, such that a lower overall conversion is achieved.
FIGURE 3.
Real-time polymerization stress of TEGDMA/PEMA materials at varying prepolymer loading levels; Io= 5 mW cm−2.
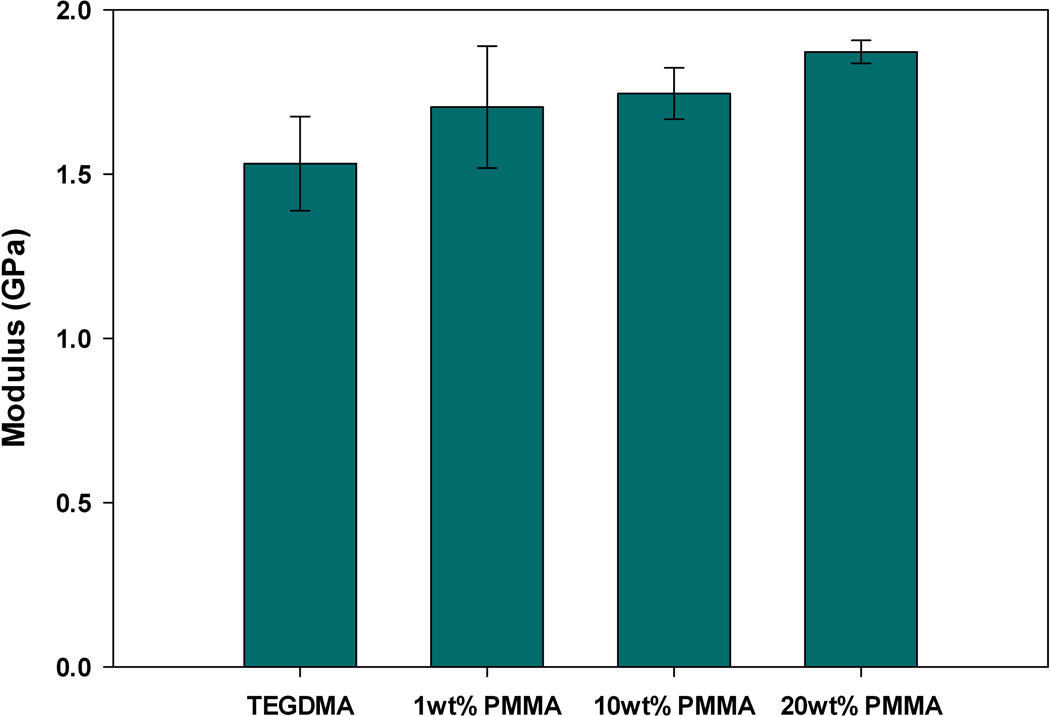
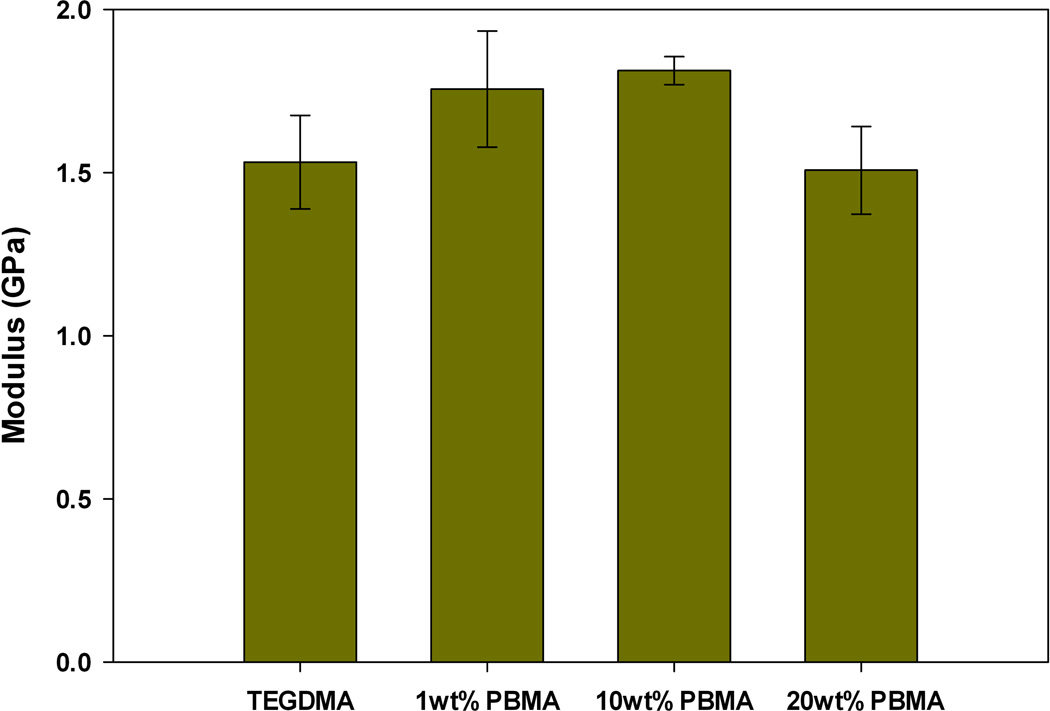
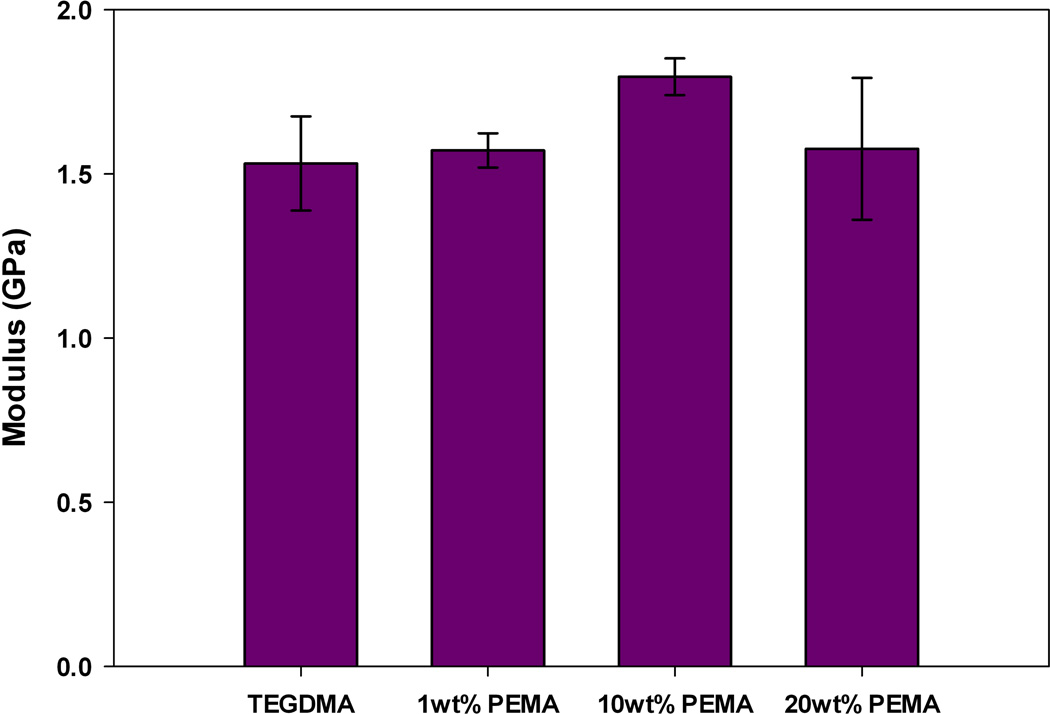
The observed reduction in polymerization stress could also occur if modification of the bulk matrix with prepolymer reduces the modulus of the network formed upon polymerization. If this is true, then it is very difficult to make a connection between stress reduction and PIPS. To probe this, the elastic modulus was measured via three-point bending. The samples utilized for three-point bending were prepared under identical ambient conditions and irradiation intensity as used in real-time stress measurements. Figures 5–7 display the bulk elastic modulus of poly(TEGDMA) compared to the networks formed when the starting matrix is modified by prepolymer at 1, 10 or 20 wt% loading.
FIGURE 5.
Elastic Modulus, post-cure, of TEGDMA/PMMA materials (n=3).
FIGURE 7.
Elastic Modulus, post-cure, TEGDMA/PBMA materials (n=3).
All prepolymer modified networks display a slight increase in modulus with initial additions (1 wt%) of prepolymer. This increase, however is not significant at the 95 % confidence interval, as a paired t-test between the poly(TEGMA) and the networks modified by 1 wt% PMMA, PEMA or PBMA all resulted in a p-value > 0.5. At this low loading level, we suspect that the prepolymer is acting as filler, and the modulus of the prepolymer adds to the modulus of the bulk matrix causing a slight, yet insignificant increase.
At moderate to high loading levels (10 and 20 wt%), the reduction in polymerization stress is accompanied by an equivalent, or in some cases increased bulk modulus compared to the poly(TEGDMA) control. When TEGDMA is modified by PEMA or PBMA the modulus of final network is significantly higher (as determined by a paired t-test with a 95% confidence interval) with 10 wt% prepolymer loading. When the loading level is increased to 20 wt% PEMA or PBMA the bulk modulus returns to a value statistically similar to that of poly(TEGDMA). In these materials, the limiting final conversion decreases at 20 wt% prepolymer loadings, thus decreasing the network modulus. PMMA-modified resins only have a statistically higher bulk modulus at the 20 wt% loading level.
These results indicate that the bulk modulus does not significantly decrease upon multi-phase, heterogeneous network formation through PIPS, and that the observed stress reduction is due to the PIPS process, and is not a result of compromised bulk network formation. In the materials tested here, PIPS results in networks with two phases: one rich in poly(TEGDMA) and the other rich in poly(TEGDMA)/prepolymer. With these differences in phase composition, we anticipate that there is local variation in modulus arising from the differences in overall cross-link density and prepolymer Tg. The phase rich in poly(TEGDMA)/prepolymer will have a reduced overall cross-link density, which could lead to a relative decrease in modulus in these regions. However, the presence of the entangled prepolymer in these more loosely cross-linked regions actually reinforces and strengthens the local network, since the bulk modulus does not decrease at higher prepolymer loadings, where the poly(TEGDMA)/prepolymer rich phase may be co-continuous with the poly(TEGDMA) phase. The absolute value of the local modulus likely varies with the Tg and molecular weight of prepolymer in use.
With these findings, there are two effects to investigate. The first being, how does phase structure evolve with increasing prepolymer loading, leading to more effective stress reduction? Secondly, what property differences amongst the three different prepolymers leads to differences in phase behavior and stress reduction efficiency? This second thrust will be explored in more detail in a future publication, and here we will focus on elucidating the stress reduction mechanism as a function of prepolymer loading level.
To investigate the impact of prepolymer loading, the overall phase structure and domain size of phase-separated networks was analyzed with confocal microscopy imaging, as discussed below.
Phase Structure Imaging via Confocal Microscopy
There exist two modes of phase separation, Spinodal Decomposition (SD) and Nucleation and Growth (N&G). The difference between the two is that SD is initiated when a multi-component system is in a highly unstable state while N&G occurs when a system is in a metastable state.10 The highly unstable state characteristic of SD is defined as where the following holds true:
Where:
ΔGmix = Gibbs Free energy of mixing
x = any natural variable (i.e. temperature, volume, etc.)
Typically, materials that undergo N&G mechanism initially have a dispersed phase structure and those undergoing SD have a co-continuous phase structure. However, if the SD mechanism persists for long enough periods of time, coalescence will occur and the phase structure will approach dispersed morphology as a means to reduce the interfacial surface area. Co-continuous phase structure formed under SD has been cited as a more appropriate and effective means of shrinkage control in polymeric systems.10
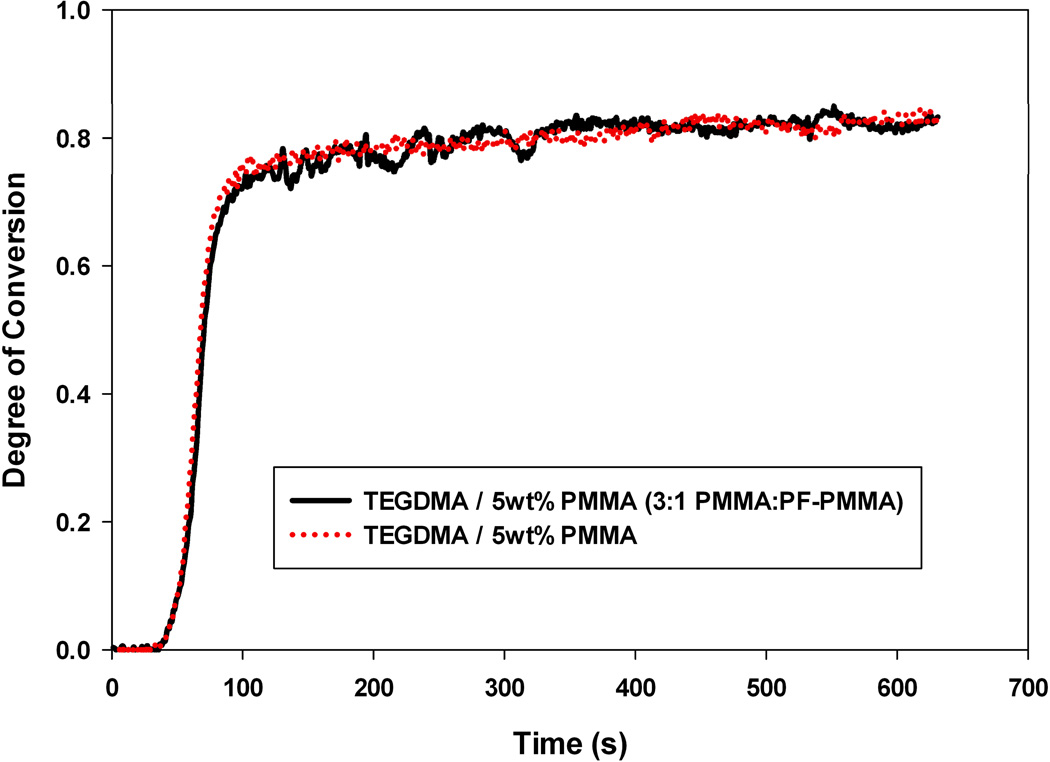
To determine what type of phase structure results from PIPS in prepolymer-modified TEGDMA materials, confocal microscopy was utilized. A prepolymer with a fluorescent probe covalently attached to the backbone was synthesized (details in the Experimental section) and blended with the conventional PMMA used here to modify the TEGDMA matrix. The fluorescently tagged material (PF-PMMA) was developed so that when substituted in small quantities to a TEGDMA/PMMA formulation, the phase separation process would proceed in the same manner as when the unmodified PMMA was present in the TEGDMA matrix. Formulations used for confocal studies varied in ratio of PMMA to PF-PMMA depending on the prepolymer loading in the monomer matrix (to maximize image resolution and to avoid saturation in images due to an overabundance of the fluorescent probe). The two numbers following the label ‘PF-PMMA’ refer to the ratio (wt%) of PMMA to fluorescent PMMA (i.e. PF-PMMA 3:1 is composed 75 wt% PMMA and 25 wt% fluorescent PMMA). To validate that PF-PMMA did not behave differently than PMMA during the TEGDMA polymerization, the kinetic profiles of TEGDMA modified materials (at the same loading level) were compared, and found to be identical (Figure 8).
FIGURE 8.
Kinetic Profile of TEGDMA polymerizations modified by 5 wt% PMMA (red) or a 3:1 (mass ratio) of PMMA: PF-PMMA; Io=5 mW cm−2.
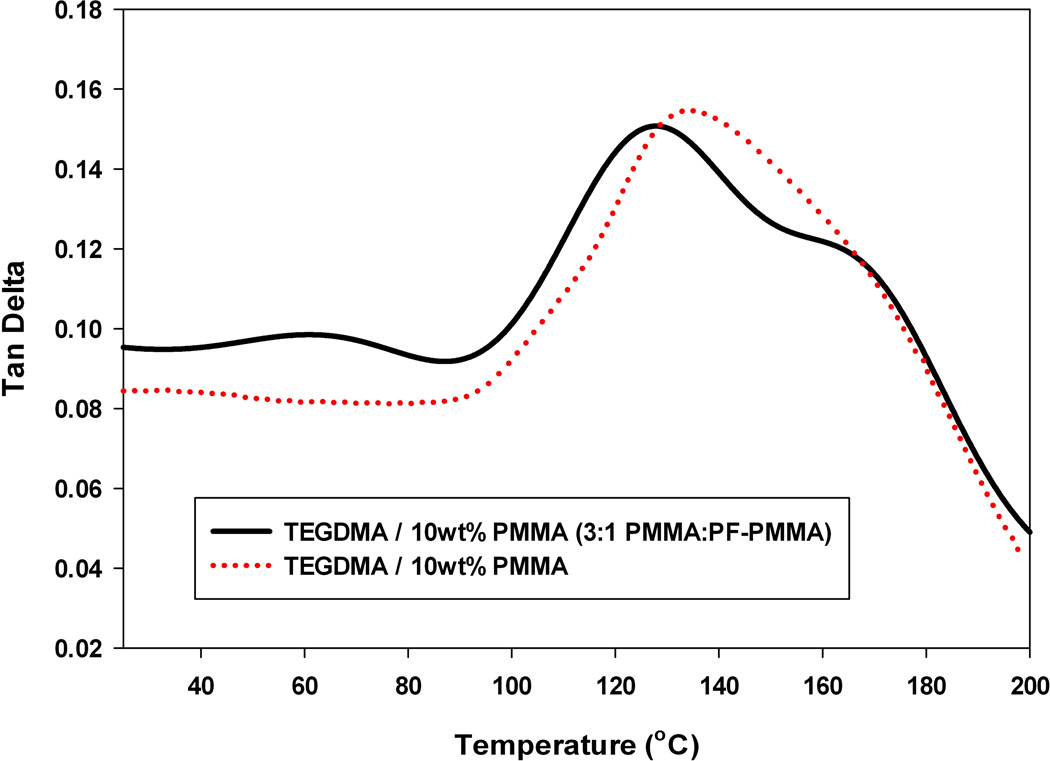
A second measure to ensure that the fluorescent prepolymer did not alter the phase separation process was to evaluate the tan delta profiles post-cure. Although slight shifts were observed (Figure 9), each peak was de-convoluted into Gaussian peaks with very similar centers. For the PMMA sample, they occur at 133 and 167 °C. The 167°C peak corresponds to a poly(TEGDMA) rich phase, and the 133 °C peak corresponds to a phase that composed of both poly(TEGDMA) and PMMA. For the fluorescent sample the peak centers occur at 127 and 167 °C, indicating that after phase separation, even when using the fluorescent prepolymer, similar phases are formed. It should be noted, that when the modifying prepolymer is PBMA or PEMA an identical peak at ~167 °C is observed, corresponding to the poly(TEGDMA)-rich phase. However, the poly(TEGDMA)/prepolymer-rich phase shifts to ~85 or ~110 °C, respectively, based on the pure prepolymer Tg (Table 1). As previously stated, there is no observed effect of prepolymer Tg on bulk properties such as modulus (Figures 5–7). However, there is an expected effect of prepolymer Tg on local property differentials, and this will be explored more thoroughly in a future publication.
FIGURE 9.
Tan Delta Profile of TEGDMA polymers modified by 5 wt% commercial PMMA (red) or a 3:1 (mass ratio) of commercial PMMA: PF-PMMA; Io=5 mW cm−2.
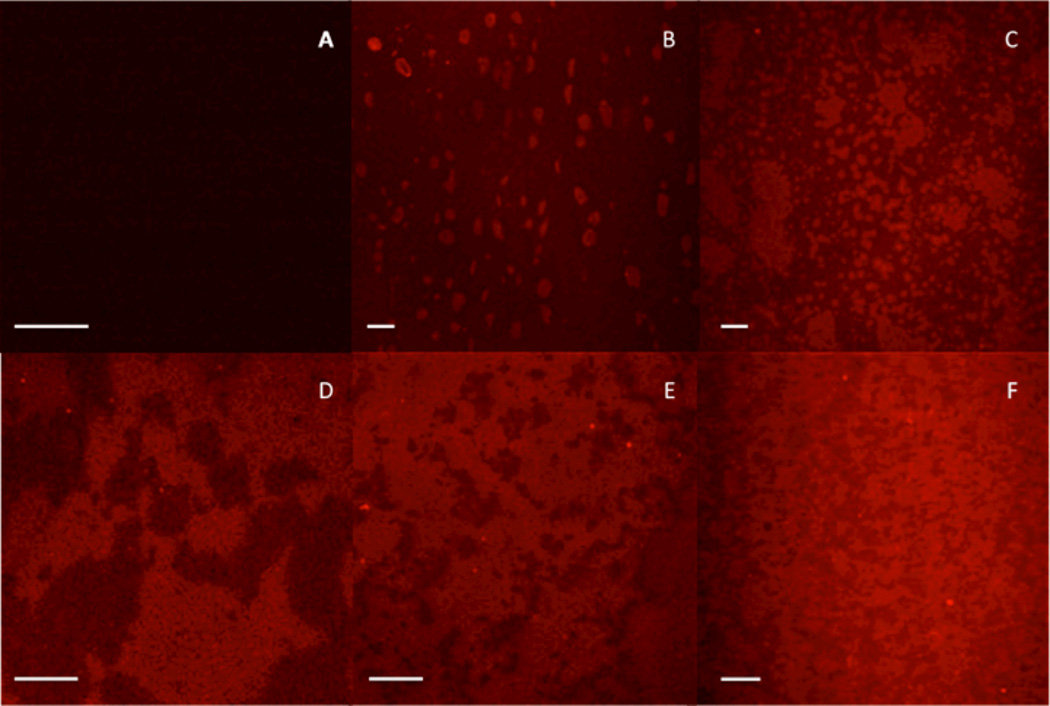
Using this fluorescent material, we aimed to determine the final overall phase structure (post-ambient cure) as a function of prepolymer loading. For this series of experiments, thin films were prepared by curing ~1 ml of monomer formulations sandwiched between an untreated glass slide and glass coverslip at Io=5 mW cm−2. The final degree of conversion (DC) of the thin film samples varied from 75–85 % depending on the loading level of prepolymer. Figure 10 shows the changes in phase structure as a function of prepolymer loading, from 0 – 20 wt% PF-PMMA.
FIGURE 10.
Confocal microscopy images of materials, post-cure, having undergone PIPS; scale bar represents 50 µm. A) TEGDMA, DC=77 %, B) TEGDMA/1 wt% PMMA (3:1), DC=82 %, C) TEGDMA/3 wt% PMMA (3:1), DC=93 %, D) TEGDMA/5 wt% PMMA (3:1), DC=85 %, E) TEGDMA/10 wt% PMMA (3:1), DC=75 %, F) TEGDMA/20 wt% PMMA (19:1), DC=70 %.
At very low prepolymer loadings (1 wt% PF-PMMA), a dispersed prepolymer-rich phase structure is observed. The dispersed phase is roughly spherical in shape, and scales anywhere from 5–25 µm in diameter. At 3 wt% PF-PMMA, the phase structure begins to transition from a dispersed to co-continuous phase structure, as there is both a mixture of spherical phase domains (~10–20 µm diameter) as well as extended phase domains on the order of 100’s of microns. At loading levels of 5, 10 and 20 wt% prepolymer, a co-continuous phase structure is observed, indicative of the SD mechanism. Here, as the loading level of prepolymer increases, the TEGDMA-rich or ‘dark’ phase decreases in volume and size. Only at 20 wt% loading does the co-continuous structure appear uniform in both size and shape in either phase.
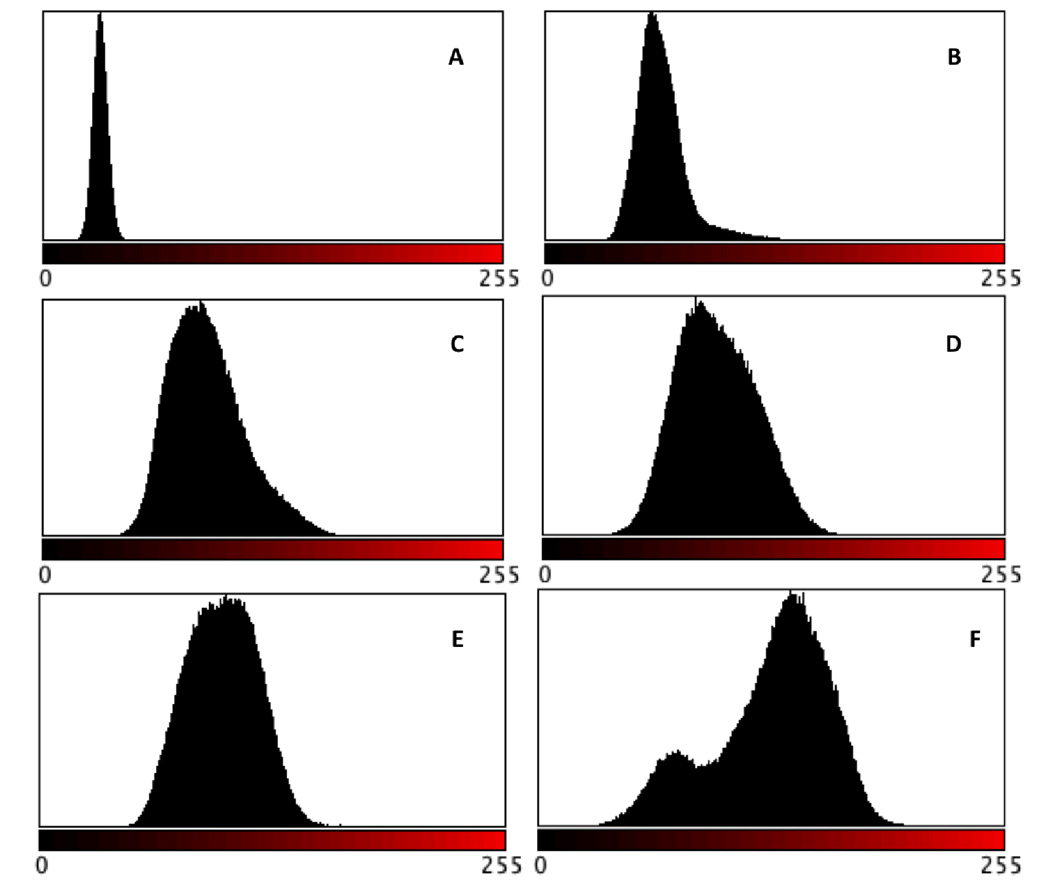
Histogram analyses of the distribution of red versus black pixels in each image were performed using ImageJ, and the results are shown in Figure 11. For the image of poly(TEGDMA), a very narrow distribution close to the value of 0 (pure black) is observed. As prepolymer is introduced, a shoulder appears on the right-hand side of the distribution, attributed to the small domains of prepolymer rich phase present. This shoulder increases in size at 5 wt% loading, and at 10 wt% loading, a shoulder no longer exists in the distribution, but it has broadened. This implies closer to equivalent volume fraction of the TEGDMA-rich and prepolymer-rich phases. At loading levels of 20 wt%, the prepolymer-rich phase dominates the histogram distribution, and the contribution from the darker, TEGDMA-rich regions is apparent in a shoulder, now on the left side.
FIGURE 11.
Histogram analysis of red versus black pixel distribution (from images presented in Figure 6): A) TEGDMA, DC=77 %, B) TEGDMA/1 wt% PMMA (3:1), DC=82 %, C) TEGDMA/3 wt% PMMA (3:1), DC=93 %, D) TEGDMA/5 wt% PMMA (3:1), DC=85 %, E) TEGDMA/10 wt% PMMA (3:1), DC=75 %, F) TEGDMA/20 wt% PMMA (19:1), DC=70 %.
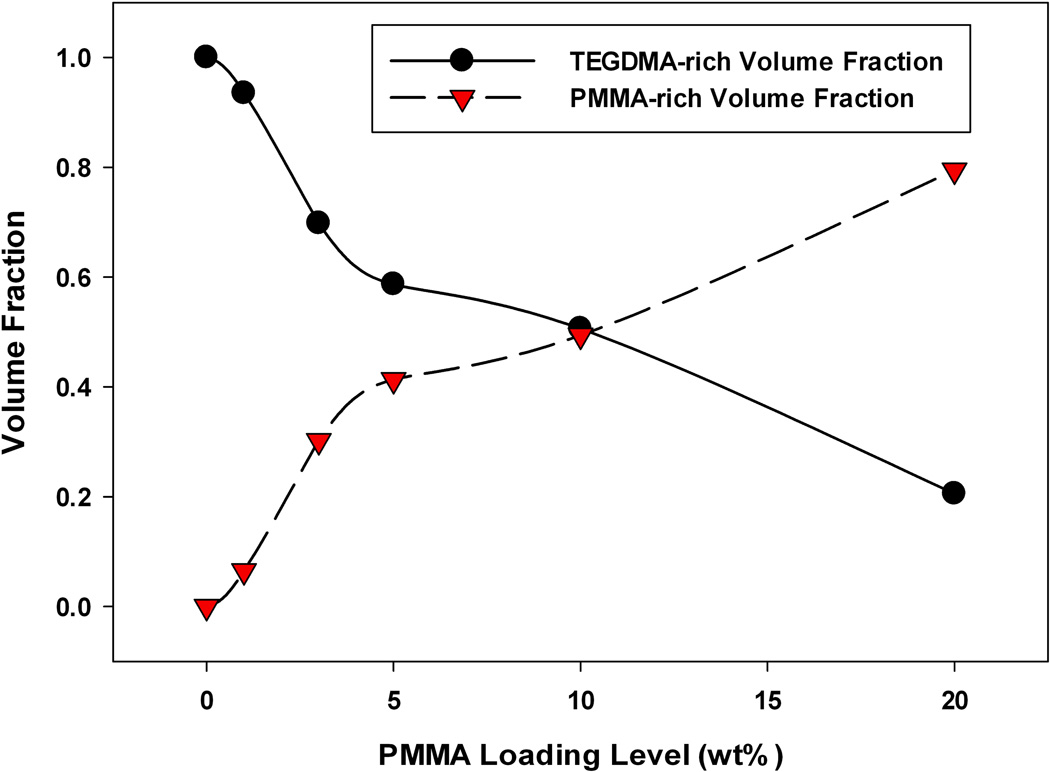
These results can be deconvoluted and quantified to estimate the volume fraction of each phase (Figure 12). From these results, it is easy to see that the prepolymer-rich phase volume fraction increases, as expected, with increasing prepolymer loading. Once continuity of the prepolymer-rich phase is established, the volume fraction of this phase increases in a linear manner with additional prepolymer. At these loading levels the prepolymer-rich volume fraction is greater than expected, which corresponds to observed decreases in volumetric shrinkage in these materials.
FIGURE 12.
Estimated volume fractions of poly-TEGDMA rich phase and PMMA rich-phase based on red versus black pixel distribution: A) TEGDMA, DC=77 %, B) TEGDMA/1 wt% PMMA (3:1), DC=82 %, C) TEGDMA/3 wt% PMMA (3:1), DC=93 %, D) TEGDMA/5 wt% PMMA (3:1), DC=85 %, E) TEGDMA/10 wt% PMMA (3:1), DC=75 %, F) TEGDMA/20 wt% PMMA (19:1), DC=70 %.
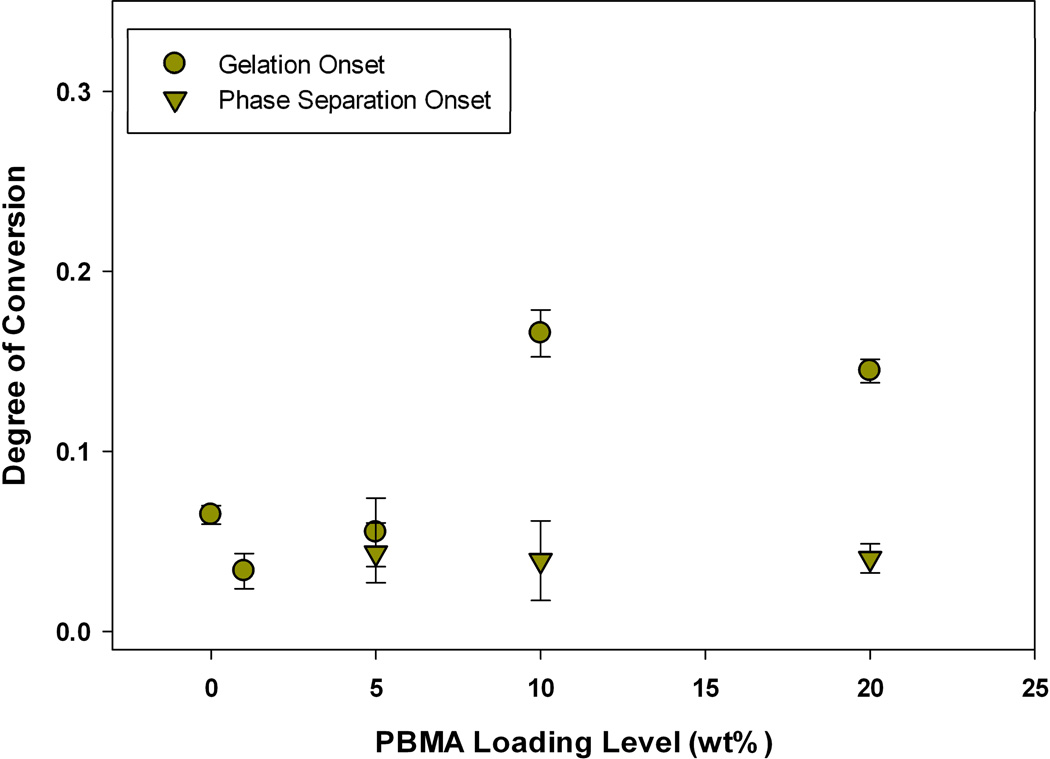
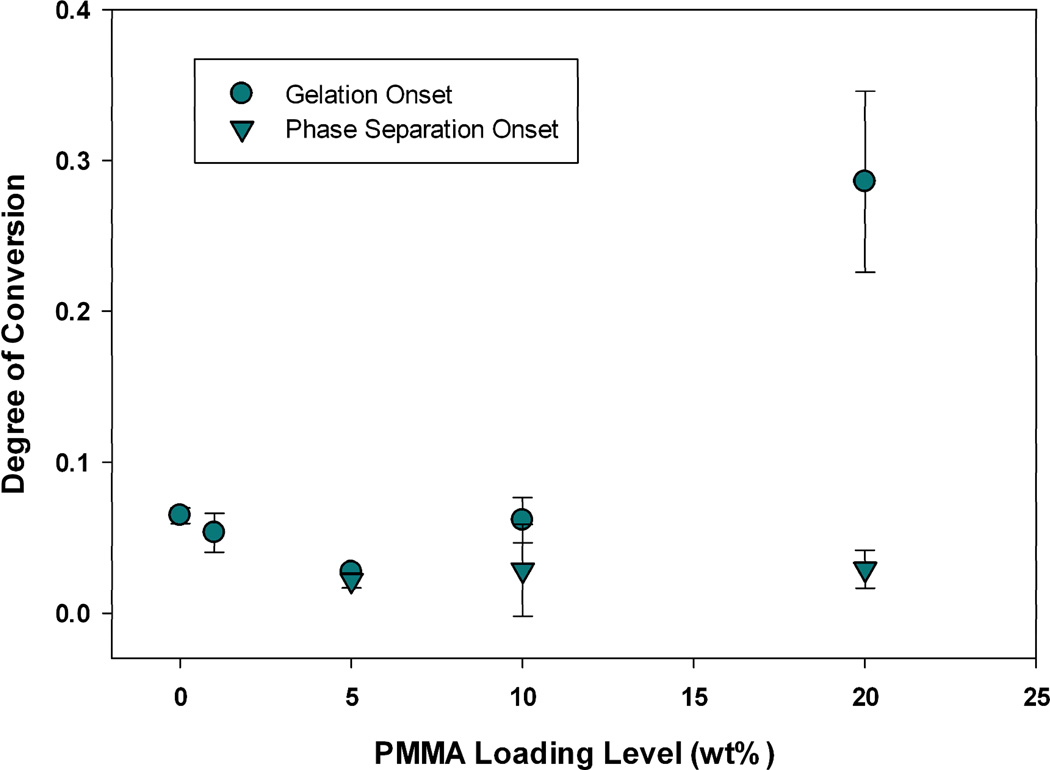
Previously, we presented and described two techniques that can be used to measure the conversion at the onset of gelation via photo-rheometry, and the conversion at the onset of phase separation via optical clarity measurements during polymerization.21 The onset of phase separation consistently coincided with or preceded the onset of gelation in all TEGDMA polymerizations modified by PMMA, PEMA, or PBMA. Depending on the modifying prepolymer, as well as the loading level, a significant degree of conversion may or may not occur between these two benchmarks. For instance, at 10 wt% loadings of PEMA or PBMA, gelation is delayed extensively with 7 (±1.0) or 13 (±2.6) % conversion of methacrylate groups respectively, that occurs between the onset of phase separation and gelation. This behavior is displayed in Figure 13 for PBMA-modified networks. However, at the same loading (10 wt%) of PMMA into a TEGDMA matrix (Figure 14), there is little delay between phase separation and gelation (3.3 ± 3.4%), indicating that the amount of time for diffusion of incompatible phases is much less. When the loading level of PMMA is increased to 20 wt%, gelation is delayed such that 26 ± 6.1% conversion methacrylate groups is observed. This delay in the onset of network gelation increases the time between phase separation and gelation from ~12 seconds in the network modified by 10 wt% PMMA to 44 seconds at the 20 wt% PMMA loading under the low irradiance conditions used in the rheometric study. This significant delay in gelation as loading is increased from 10 to 20 wt% PMMA is due to the changes in the overall reaction rate. The reaction rate maximum for the TEGDMA/10 wt% PMMA matrix is equivalent to that of the poly(TEGDMA) control (13.9 ± 0.6 versus 13.1 ± 1.2 L mol−1 min−1), but once the loading is increased to 20 wt% the reaction rate becomes significantly slower (4.4 ± 0.5).21 The slower reaction rate provides sufficient time for a completely co-continuous phase structure to form via diffusion of incompatible phases (Figure 10). This phase structure delays the onset of gelation, as polymerization proceeds in the two phases formed, but at non-equivalent rates. Macro-gelation is not observed until one of these co-continuous domains gels. Thus, an observed gel point conversion at 20% combines methacrylate conversion occurring in both phases formed, and the co-continuous phase that has gelled may actually have a lower local methacrylate conversion. A similar decrease in reaction rate begins at a 10 wt% loading level of PEMA and PBMA, thus accounting for the differences in stress reduction behavior as a function of loading level between these prepolymers.
FIGURE 13.
TEGDMA/PBMA gelation and phase separation onsets during polymerization (n=3), as measured by G’/G” crossover point and onset of turbidity respectively; Io=300 µW cm−2, λ=365 nm.
FIGURE 14.
TEGDMA/PMMA gelation and phase separation onsets during polymerization (n=3), as measured by G’/G” crossover point and onset of turbidity respectively; Io=300 µW cm−2, λ=365 nm.
With these observations and the images in Figure 10, we can conclude that a delay in gelation, resulting in significant network development post-phase separation and pre-gelation allows for regular, co-continuous network formation with maximum interfacial area. Additionally, the polymerizations that have an observed delay in gelation also experience a delay in the onset of stress development. The co-continuous network structure formed in these cases allows for network rearrangement throughout a greater portion of the polymerization, delaying the stress development and decreasing the overall polymerization stress (i.e. TEGDMA/20 wt% PBMA). The loading level where this co-continuous structure is first observed depends on the specific modifying prepolymer, and its impact on gelation.
Combining the studies detailed here, the following stress reduction mechanism is proposed for the TEGDMA/ prepolymer system. Upon photo-irradiation, phase separation is initiated via thermodynamic instability between the prepolymer additive and the initially formed TEGDMA homopolymer that is accompanied by a change in opacity of the polymerizing material, as the two phases formed have differing refractive indices. With moderate loading levels, due to the amount of prepolymer present and the time available for diffusion of incompatible phases, a continuous phase rich in prepolymer will form. Polymerization will proceed more rapidly in the TEGDMA-rich phase as it has a higher concentration of double bonds and lower local viscosity. The composition of the poly(TEGDMA)/prepolymer-rich phase is approximately 40–50 wt% prepolymer, which will substantially increase the local viscosity and suppress autoacceleration, resulting in a slower local polymerization rate. At the early stages of the reaction, observed volumetric shrinkage and polymerization stress is at a minimum, as shrinkage that occurs due to conversion can be compensated for by network rearrangement since the system, and specifically the prepolymer-rich phase, has not yet gelled. The network rearrangement pre-gelation is accomplished by thermodynamically driven monomer diffusion out of the prepolymer rich domains.
At moderate degrees of conversion (25–50 %), the volume change associated with converting monomer to polymer results in an increase in observed volumetric shrinkage and polymerization stress, since the network has gelled and cannot compensate for TEGDMA shrinkage as effectively. Although the prepolymer-rich phase will have a decreased cross-link density, the linear prepolymer reinforces these domains through physical entanglements promoted by the concentration effects, causing the bulk modulus to remain equivalent to or greater than that of a non-phase separated network. The efficiency of this dynamic mechanism at stress reduction during polymerization depends on the domain size, interfacial surface area between different phases and most importantly, the local differential between phases in properties such as reaction rate, viscosity, and Tg.
CONCLUSIONS
Here, we have investigated stress-reduction via PIPS in a dimethacrylate photopolymerization modified by the addition of thermoplastic prepolymers. TEGDMA polymerizations modified with PEMA or PBMA had reduced polymerization stress, while maintaining equivalent or enhanced bulk final modulus at loading levels greater than 10 wt%. PMMA modified polymerizations also exhibited a reduction in overall polymerization stress, but this only occurred at a loading level of 20 wt%.
By imaging phase structure as a function of prepolymer loading level, it was found that an irregular continuous domain of TEGDMA/prepolymer is established when the prepolymer loading is greater than ~3 wt%. Co-continuous phase structure that is regular in domain size and shape is observed when the prepolymer loading is ~20 wt%. At early stages of conversion, volumetric shrinkage and polymerization stress is at a minimum because any changes in density that occur from TEGDMA-conversion are compensated for by network re-arrangement.
For effective stress reduction the following are necessary: a sufficient level of prepolymer to form a continuous phase of TEGDMA/prepolymer, sufficient time between phase separation and gelation to allow for diffusion of incompatible phases, and finally a polymerization rate that leads to a high final degree of conversion across the entire network. The differences that arise between the prepolymers in use here is due to a combination of differences in molecular weight and Tg Future work will involve systematic studies to understand the impact of these physical properties on PIPS.
FIGURE 6.
Elastic Modulus, post-cure, of TEGDMA/PEMA materials (n=3).
ACKNOWLEDGEMENTS
The donation of monomer used in this study by Esstech, the microscope access from the University of Colorado Biofrontiers Institute, as well as funding support from NIH/NIDCR 5R01DE014227 are greatly appreciated.
REFERENCES AND NOTES
- 1.Pfeifer CS, Ferracane JL, Sakaguchi RL, Braga RR. J. Dent. Res. 2008;87:1043. doi: 10.1177/154405910808701114. [DOI] [PubMed] [Google Scholar]
- 2.Patel MP, Braden M, Davy KWM. Biomaterials. 1987;8:53. doi: 10.1016/0142-9612(87)90030-5. [DOI] [PubMed] [Google Scholar]
- 3.Ferracane JL. Dent. Mater. 2005;21:36. doi: 10.1016/j.dental.2004.10.004. [DOI] [PubMed] [Google Scholar]
- 4.Goncalves F, Pfeifer CS, Ferracane JL, Braga RR. J. Dent. Res. 2008;87:367. doi: 10.1177/154405910808700404. [DOI] [PubMed] [Google Scholar]
- 5.Lu H, Stansbury JW, Bowman CN. Dent. Mater. 2004;20:979. doi: 10.1016/j.dental.2004.05.002. [DOI] [PubMed] [Google Scholar]
- 6.Stansbury J, Ge J. RadTech Rep. 2003:56–62. [Google Scholar]
- 7.Stansbury JW, Trujillo-Lemon M, Lu H, Ding XZ, Lin Y, Ge JH. Dent. Mater. 2005;21:56. doi: 10.1016/j.dental.2004.10.006. [DOI] [PubMed] [Google Scholar]
- 8.Goncalves F, Pfeifer CCS, Stansbury JW, Newman SM, Braga RR. Dent. Mater. 2010;26:697. doi: 10.1016/j.dental.2010.03.014. [DOI] [PubMed] [Google Scholar]
- 9.Chou YC, Lee LJ. Polym. Eng. Sci. 1994;34:1239. [Google Scholar]
- 10.Li W, Lee LJ. Polymer. 2000;41:685. [Google Scholar]
- 11.Liu Y, Zhong XH, Yu YF. Colloid Polym. Sci. 2010;288:1561. [Google Scholar]
- 12.Murata K, Sachin J, Etori H, Anazawa T. Polymer. 2002;43:2845. [Google Scholar]
- 13.Kihara H, Miura T. Polymer. 2005;46:10378. [Google Scholar]
- 14.Cao X, Lee LJ. J. Appl. Polym. Sci. 2003;90:1486. [Google Scholar]
- 15.Velazquez R, Sanchez F, Yanez R, Castano VM. J. Appl. Polym. Sci. 2000;78:586. [Google Scholar]
- 16.Schroeder WF, Borrajo J, Aranguren MI. Journal of Applied Polymer Science. 2007;106:4007. [Google Scholar]
- 17.Vaessen DM, McCormick AV, Francis LF. Polymer. 2002;43:2267. [Google Scholar]
- 18.Velazquez R, Ceja I, Guzman J, Castano VM. J. Appl. Polym. Sci. 2004;91:1254. [Google Scholar]
- 19.Qui TCM, Kinohira T, Van-Pham T, Hirose A, Norisuye T, Nakanishi H. Curr. Opin. Solid State Mater. Sci. 2011;15:254. [Google Scholar]
- 20.Kimura N, Kawazoe K, Nakanishi H, Norisuye T, Tran-Cong-Miyata Q. Soft Matter. 2013;9:8428. [Google Scholar]
- 21.Szczepanski CR, Pfeifer CS, Stansbury JW. Polymer. 2012;53:4694. doi: 10.1016/j.polymer.2012.08.010. [DOI] [PMC free article] [PubMed] [Google Scholar]
- 22.Lu H, Trujillo-Lemon M, Ge J, Stansbury J. Comp. Cont. Educ. Dent. 2010;31:1–4. [PubMed] [Google Scholar]
- 23.Lu H, Stansbury JW, Dickens SH, Eichmiller FC, Bowman CN. J. Mater. Sci. : Mater. Med. 2004;15:1097. doi: 10.1023/B:JMSM.0000046391.07274.e6. [DOI] [PubMed] [Google Scholar]
- 24.Lu H, Stansbury JW, Dickens SH, Eichmiller FC, Bowman CN. J. Biomed. Mater. Res., Part B. 2004;71B:206. doi: 10.1002/jbm.b.30088. [DOI] [PubMed] [Google Scholar]
- 25.Pfeifer CS, Wilson ND, Shelton ZR, Stansbury JW. Polymer. 2011;52:3295. doi: 10.1016/j.polymer.2011.05.034. [DOI] [PMC free article] [PubMed] [Google Scholar]
- 26.Chambon F, Winter HH. J. Rheol. 1987;31:683. [Google Scholar]
- 27.Degee AJ, Feilzer AJ, Davidson CL. Dent. Mater. 1993;9:11. doi: 10.1016/0109-5641(93)90097-a. [DOI] [PubMed] [Google Scholar]
- 28.Green WA. Industrial Photoinitiators - A Technical Guide. Boca Raton, FL: CRC Press - Taylor & Francis Group; 2010. [Google Scholar]
- 29.Velazquez R, Reyes J, Castano VM. e-Polym. 2003 [Google Scholar]


