Summary
Notch signalling plays a key role in the generation of haematopoietic stem cells (HSCs) during vertebrate development1-3 and requires intimate contact between signal emitting and receiving cells, although little is known regarding when, where, and how these intercellular events occur. We previously reported that the somitic Notch ligands, Dlc and Dld, are essential for HSC specification4. It has remained unclear, however, how these somitic requirements are connected to the later emergence of HSCs from the dorsal aorta (DA). Here we show that Notch signalling establishes HSC fate as their shared vascular precursors migrate across the ventral face of the somite and that Junctional adhesion molecules (JAMs) mediate this required Notch signal transduction. HSC precursors express jam1a and migrate axially across the ventral somite, where Jam2a and Notch ligands Dlc and Dld are expressed. Despite no alteration in the expression of Notch ligand or receptor genes, loss of function of jam1a led to loss of Notch signalling and loss of HSCs. Enforced activation of Notch in shared vascular precursors rescued HSCs in jam1a or jam2a deficient embryos. Together, these results indicate that Jam1a – Jam2a interactions facilitate the transduction of requisite Notch signals from the somite to the precursors of HSCs, and that these events occur well before formation of the DA.
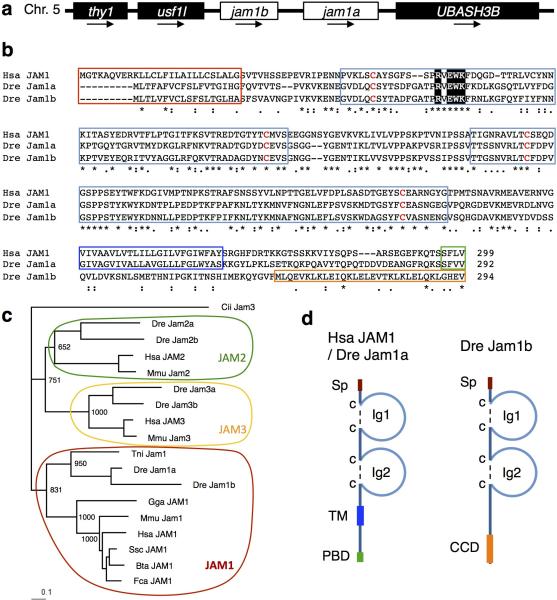
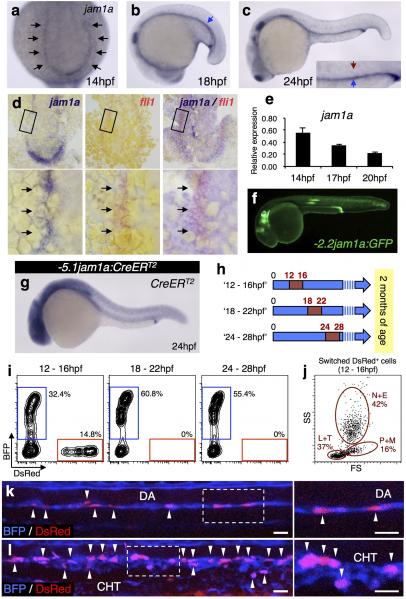
JAM proteins belong to the immunoglobulin superfamily of cell adhesion molecules, comprised of three closely related members, JAM1 (also known as JAM-A or F11R), JAM2 (also known as JAM-B), and JAM3 (also known as JAM-C)5. It has been reported that Jam1 is expressed in both murine and zebrafish HSC fractions6,7, although its role in haematopoiesis remains unknown. In zebrafish, the jam1 gene was tandemly duplicated on chromosome 5 to generate jam1a and jam1b (also known as f11rl). The structure of Jam1a is similar to that of human JAM1, which is composed of two immunoglobulin-like domains, a transmembrane domain (TM), and a PDZ-binding domain (PBD), whereas Jam1b lacks the TM and PBD (Extended Data Fig. 1a-d). We therefore focused on Jam1a to determine its potential roles in HSC development. We first examined the expression of jam1a in zebrafish embryos. At 14 hours post-fertilization (hpf), jam1a was expressed in bilateral stripes of posterior lateral mesoderm (PLM) (Extended Data Fig. 2a), which gives rise to both endothelial and haematopoietic lineages8. After 18hpf, however, jam1a was no longer detected in endothelial cells (Extended Data Fig 2b, c). We performed co-staining of jam1a with fli1, a marker of the vascular lineage. The expression domain of fli1 overlapped with that of jam1a at 14hpf (Extended Data Fig. 2d), indicating that PLM cells indeed express jam1a at this stage. We observed the downregulation of jam1a in purified fli1:GFP+ endothelial cells from 14 to 20hpf (Extended Data Fig. 2e).
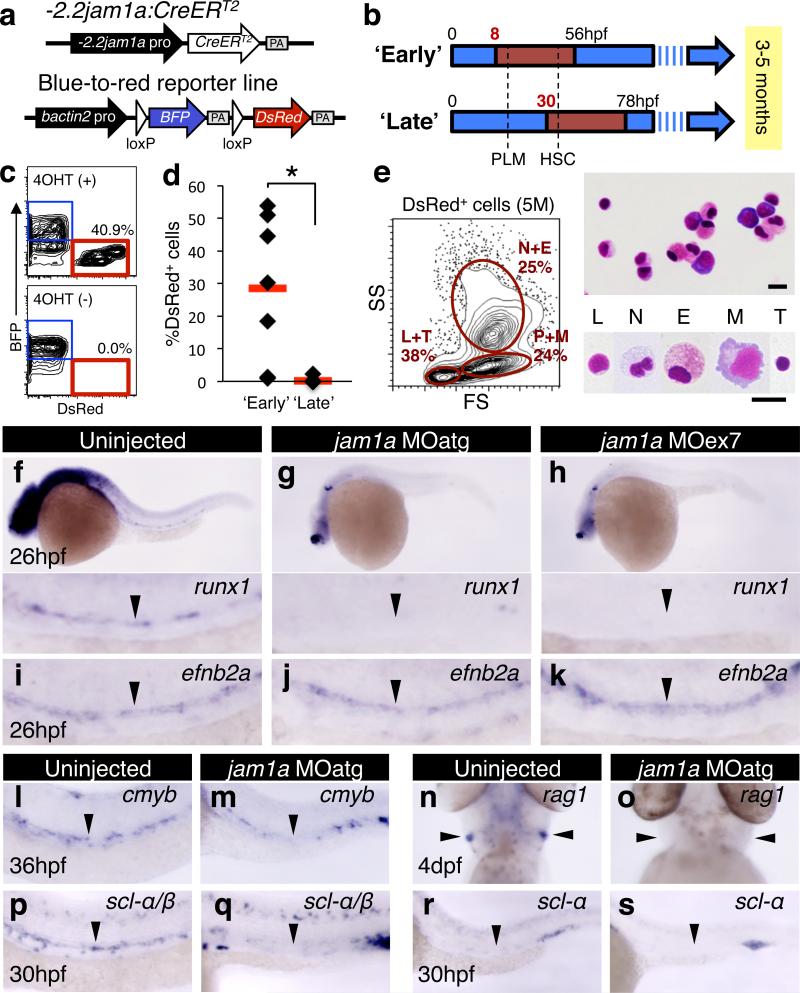
To determine if HSC precursors are contained within jam1a+ PLM cells, we performed lineage tracing utilizing combined -2.2jam1a:CreERT2 and blue-to-red reporter (bactin2:loxP-BFP-loxP-DsRed) transgenic lines (Fig. 1a). -2.2jam1a:CreERT2 expresses CreERT2 under the control of jam1a regulatory elements (Extended Data Fig. 2f). Double-transgenic embryos were treated with 4-hydroxytamoxifen (4OHT) following two different schedules (Fig. 1b). An ‘early’ group was treated with 4OHT from 8hpf, a stage before PLM formation9, and a ‘late’ group from 30hpf, a stage just before HSC emergence in the DA10,11. These embryos were grown to 3-5 months of age, after which whole kidney marrow cells were analyzed by flow cytometry (Fig. 1c). As shown in Fig. 1d, high percentages of ‘switched’ DsRed+ cells were detected in the ‘early’ group. DsRed+ cells were comprised of multiple types of blood lineages (Fig. 1e). In contrast to the ‘early’ schedule, DsRed+ cells were nearly undetectable in the ‘late’ group (Fig. 1d). These results indicate that jam1a is expressed in the shared vascular precursors of HSCs during early somitogenesis stages. The expression of jam1a in HSC precursors was further confirmed by additional lineage-tracing studies using a -5.1jam1a:CreERT2 transgenic animal, which has an extended jam1a promoter/enhancer region (Extended Data Fig 2g-l).
Figure 1. Loss of jam1a results in the loss of HSCs.
a, Vector constructs of transgenic animals used for lineage tracing. PA, polyA. b, Two different schedules of 4-hydroxytamoxifen (4OHT) treatment (‘early’ and ‘late’). Red insets in the blue arrows indicate the period of the 4OHT treatment. c, Flow cytometric analysis of adult kidney marrow cells. d, The percentages of DsRed+ cells in kidney marrow in the ‘early’ (n = 7) or ‘late’ group (n = 10). Red bars indicate the mean percentage. *p < 0.002, by Student's t-test. e, Flow cytometric and morphological analysis of DsRed+ cells. L, lymphocytes, N, neutrophils; E, eosinophils; M, monocytes; T, thrombocytes, P, precursors. May-Grünwald Giemsa staining. Bars, 10μm. f-k, Expression of runx1 and efnb2a in uninjected, jam1a MOatg-, or MOex7-injected embryos. l-s, Expression of cmyb, rag1, scl-α/β, and scl-α in uninjected or jam1a MOatg-injected embryos. Arrowheads indicate the dorsal aorta (f-m, p-s) or thymus (n, o). Data are pooled from two independent experiments (c-e) or representative of two independent experiments with two different clutches of embryos (f-s).
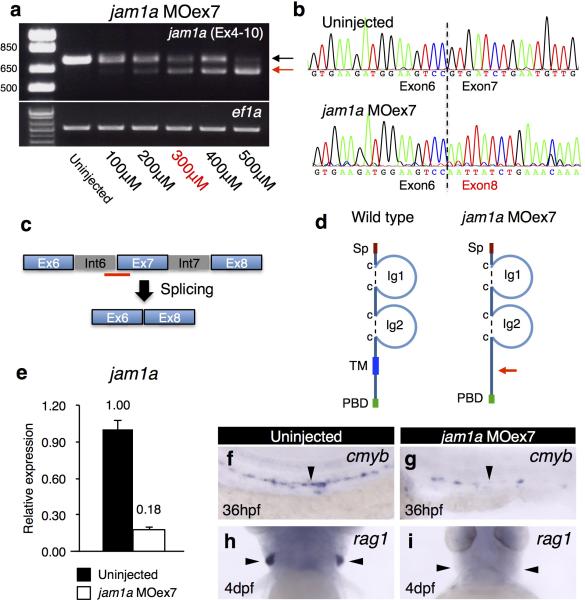
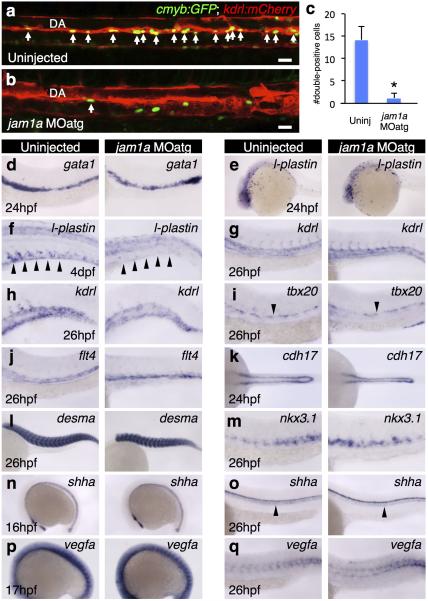
To examine the function of Jam1a in haematopoiesis, we designed two different morpholino oligonucleotides (MOs), jam1a MOatg (a translation-blocking MO) and MOex7 (a splice-blocking MO) (Extended Data Fig. 3a-e). We first examined the expression of the HSC marker gene runx1 in these morphants. As shown in Fig. 1f, runx1 was detected in the DA in uninjected wild type embryos at 26hpf. In contrast, runx1 was nearly undetectable in jam1a MOatg- and MOex7-injected embryos at the same stage (Fig. 1g, h). The expression of efnb2a (ephrin-B2a, a DA marker gene) was unaffected in either morphant (Fig. 1i-k), suggesting that the DA is specified normally. To further characterize jam1a morphants, we investigated the expression of additional marker genes. The expression of cmyb (another HSC marker) in the DA was largely absent in jam1a morphants (Fig 1l, m, Extended Data Fig. 3f, g). T-cell colonization of the thymus requires input from HSCs, providing a useful readout for whether HSCs have been specified or not. In jam1a morphants, the expression of rag1 (a marker of immature T cells) was absent in the thymus at 4 days post fertilization (dpf) (Fig. 1n, o, Extended Data Fig. 3h, i). A truncated isoform of scl, scl-β, has been shown to mark haemogenic endothelium in the DA12. Comparison of scl-α/β and scl-α probes revealed the specific reduction of scl-β in the DA in jam1a morphants (Fig. 1p-s). Nascent HSCs can be visualized as cmyb:GFP; kdrl:mCherry double-positive cells in the ventral floor of the DA10. The number of double-positive cells in the DA was twelve times lower in jam1a morphants than in wild type embryos (Extended Data Fig. 4a-c). The expression of gata1 (an erythroid marker) and l-plastin (a myeloid marker) at 24hpf was normal in jam1a morphants, whereas the expression of l-plastin at 4dpf was reduced in the caudal haematopoietic tissue (CHT) (Extended Data Fig. 4d-f). These results indicate that primitive haematopoiesis is unaffected, but definitive haematopoiesis is defective in jam1a morphants. The vasculature in the trunk was normal in jam1a morphants, whereas development of the vascular plexus in the CHT was slightly abnormal (Extended Data Fig. 4g-j). Development of the pronephros, somite, sclerotome, and notochord was unaffected in jam1a morphants (Extended Data Fig. 4k-o). These results indicate that the failure of HSC specification in jam1a morphants is specific and not due to gross malformations in adjacent environmental tissues. The effects of MOs are summarized in Supplementary Table 1.
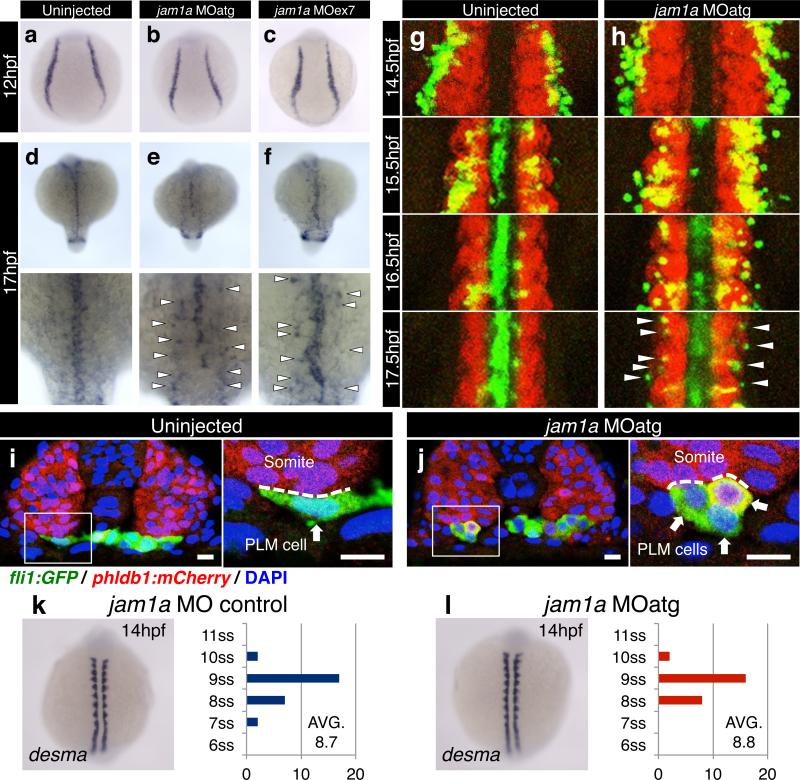
Since jam1a is expressed in PLM cells, we next examined the formation and migration of the PLM in jam1a morphants. The expression of fli1 at 12hpf was normal in both types of jam1a morphants (Fig. 2a-c), suggesting that PLM formation is unaffected. PLM cells migrate axially and reach the midline by 17hpf (Fig. 2d). We observed a delay in the migration of PLM cells in both types of jam1a morphants, in that a subset of fli1+cells did not reach the midline by 17hpf (Fig. 2e, f). We performed time-lapse imaging of PLM cells from 14hpf using fli1:GFP; phldb1:mCherry double transgenic embryos, where endothelial precursors and somitic cells are labeled by GFP and mCherry expression, respectively. PLM cells in the first wave reached the midline by 15.5hpf in wild type embryos, whereas the remaining cells reached the midline by 17.5hpf to form the ‘vascular cord’ (Fig. 2g, Supplementary Video 1). In jam1a morphants, however, only a few PLM cells reached the midline by 15.5hpf. Moreover, some PLM cells remained at the lateral borders of the somites at 17.5hpf, and the vascular cord was discontinuous (Fig 2h, Supplementary Video 2, 3). We examined the morphology of migrating PLM cells. In wild type embryos, most migrating fli1:GFP+ PLM cells displayed a flattened morphology and appeared to closely interact with the ventral domain of the somite (Fig. 2i). By contrast, PLM cells in jam1a morphants displayed a round shape with relatively little surface contact with the somite (Fig. 2j).
Figure 2. PLM cell migration is delayed in jam1a morphants.
a-f, The expression of fli1 in uninjected, jam1a MOatg-, or MOex7-injected embryos. Arrowheads indicate a subset of fli1+ cells that did not reach the midline by 17hpf. g, h, Time-lapse images of fli1:GFP; phldb1:mCherry double-transgenic embryos. The regions from the tenth to twelfth somite are shown at each time point. Arrowheads indicate a subset of fli1:GFP+ cells that did not reach the midline. i, j, Transverse sections of fli1:GFP; phldb1:mCherry embryos uninjected (15.5hpf) or injected with jam1a MOatg (16hpf). High magnification views of the boxed regions are shown in the right panels. Dotted lines indicate the contact surface area between PLM cells (arrows) and somitic cells. Bars, 10μm. k, l, The number of somites were counted in jam1a MO control- or MOatg-injected embryos at 14hpf based on the expression of desma. The average numbers of somites in embryo groups are shown on each graph. There was no significant difference between jam1a MO control- (n = 28) and MOatg-injected embryos (n = 26, p = 0.61, by Student's t-test). ss, somite-stage. Data are representative of two independent experiments with two different clutches of embryos (a-f, k, l) or three embryos (i, j) or three independent experiments with nine embryos (g, h).
To exclude the possibility of a general developmental delay in jam1a morphants, we enumerated somites at 14hpf in jam1a MO control- and MOatg-injected embryos. We mainly observed 9 somites formed in both jam1a MO control- and jam1a MOatg-injected embryos at this stage, and there was no significant difference in the average numbers of somites between groups (Fig. 3k, l). This indicates that the migration defect observed in jam1a morphants is specific and not due to developmental delay. In zebrafish, Hedgehog (Hh) and Vascular endothelial growth factor a (Vegfa) signalling pathways have been implicated to regulate the migration of PLM cells13,14. In jam1a morphants, however, the expression of shha (sonic hedgehog a) and vegfa as well as their downstream target efnb2a was unaffected (Fig. 1i-k, Extended Data Fig. 4n-q), indicating that the defect of PLM cell migration in jam1a morphants is independent of the Hh and Vegfa signalling pathways.
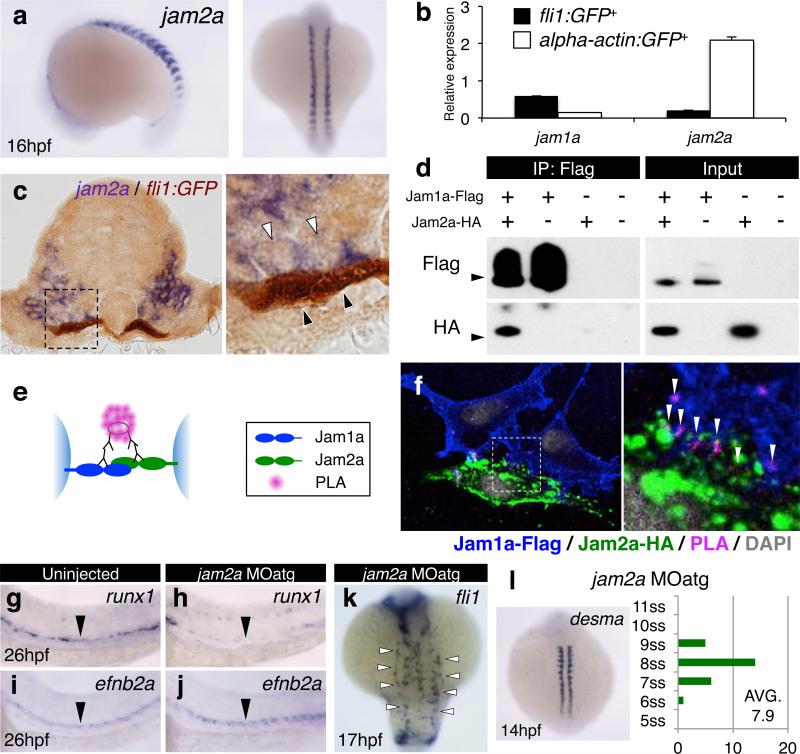
Figure 3. Loss of somitic jam2a phenocopies the Jam1a defect.
a, Expression of jam2a at 16hpf. b, Relative expression levels of jam1a and jam2a in purified fli1:GFP+ and alpha-actin:GFP+ cells at 14hpf. Error bars, s.d. c, A transverse section of a fli1:GFP embryo stained with jam2a (purple, white arrowheads) and anti-GFP antibody (brown, black arrowheads) at 16hpf. The right panel shows a high magnification view of the boxed region. d, Co-immunoprecipitation (Co-IP) using anti-Flag antibody. The immunoprecipitates were examined by Western blotting using anti-Flag or anti-HA antibody. Inputs represent 10% of cell lysates used in the Co-IP experiment. Arrowheads indicate 40kDa. e, A schematic diagram of the proximity ligation assay (PLA). f, A representative result of Duolink PLA. The right panel represents a high magnification view of the boxed region. Arrowheads indicate PLA signal. g-J, The expression of runx1 and efnb2a in uninjected or jam2a MOatg-injected embryos. Arrowheads indicate the dorsal aorta. k, The expression of fli1 in jam2a MOatg-injected embryo at 17hpf. Arrowheads indicate a subset of fli1+ cells that did not reach the midline. l, The number of somites were counted in jam2a MOatg-injected embryos at 14hpf based on the expression of desma. Average somite number is shown on the graph. ss, somite-stage. Data are representative of two independent experiments with two different clutches of embryos (a-c, g-l) or three independent experiments (d, f).
Because PLM cells migrate along the ventral domain of the somites, which includes the sclerotome, it is likely that a binding partner of Jam1a is expressed on the somitic epithelium. Powell et al. determined the expression patterns of zebrafish jam genes and their physical binding properties by surface plasmon resonance. They showed that Jam1a can bind to Jam2a, Jam2b, and Jam3a, but not Jam1a (homotypically), Jam1b, or Jam3b. Moreover, among these 6 jam genes, only jam2a and jam3b are expressed in somites15,16. Therefore, we next investigated whether PLM cells make contact with jam2a+ somitic cells. As shown in Fig. 3a, jam2a was specifically expressed in somites at 16hpf, a stage when PLM cells are migrating. Quantitative polymerase chain reaction (qPCR) results also showed that jam2a was highly expressed in purified alpha-actin:GFP+ somitic cells at 14hpf, whereas jam1a was highly expressed in purified fli1:GFP+ PLM cells (Fig. 3b). Histological analysis of 16hpf embryos revealed that migrating fli1:GFP+ PLM cells were in close contact with jam2a+ somitic cells (Fig. 3c).
To determine if Jam1a can bind to Jam2a, we performed co-immunoprecipitation experiments using transiently transfected Flag-tagged Jam1a (Jam1a-Flag) and HA-tagged Jam2a (Jam2a-HA) constructs in HEK293T cells. Anti-Flag immunoprecipitation followed by anti-HA Western blotting showed specific binding of Jam1a to Jam2a (Fig. 3d). To further test their interaction, we utilized a Duolink proximity ligation assay (PLA), which can demonstrate protein-protein interactions in situ by eliciting a fluorescent signal (Fig 3e). As shown in Fig. 3f, PLA signals were detected in the boundary region between transfected Jam1a-Flag+ cells and Jam2a-HA+ cells, revealing the interaction of these proteins in trans. These results suggest that cells of PLM maintain intimate contact with cells of the ventral somite via Jam1a – Jam2a interactions during their migration.
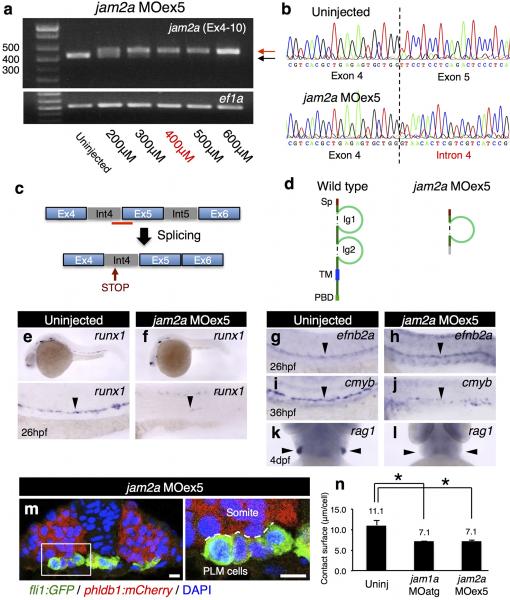
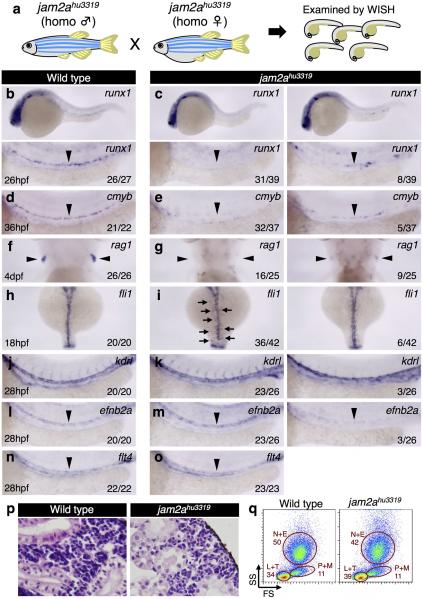
This model predicts that loss of jam2a function would phenocopy the effects in jam1a morphants. We thus examined both HSC specification and PLM cell migration in jam2a MOatg or MOex5-injected embryos (Extended Data Fig. 5a-d). The expression of runx1 in the DA was greatly reduced in both jam2a morphants, whereas efnb2a expression was unaffected (Fig. 3g-j, Extended Data Fig. 5e-l). In addition, axial migration of PLM cells was greatly delayed in both types of jam2a morphants (Fig. 3k, Supplementary Video 4, 5), despite only a modest delay in development (Fig. 3l). Migrating fli1:GFP+ PLM cells in jam2a morphants displayed a round shape (Extended Data Fig 5m), similar to that shown in jam1a morphants (Fig. 2j). The average contact surface area between a PLM cell and the somite was significantly reduced in both jam1a and jam2a morphants compared with uninjected embryos (Extended Data Fig. 5n). The effects of jam2a MOs were further validated in jam2a mutants (jam2ahu3319). Approximately 80% of homozygous jam2ahu3319 embryos showed nearly undetectable expression of runx1 and cmyb in the DA and rag1 in the thymus (Extended Data Fig. 6ag). Moreover, approximately 85% of homozygous jam2ahu3319 embryos showed delayed PLM cell migration compared with wild type embryos (Extended Data Fig. 6h, i). Formation of the vasculature, however, was grossly normal in jam2ahu3319 embryos (Extended Data Fig 6j-o). These phenotypes are consistent with those in jam1a morphants, suggesting that Jam1a – Jam2a interactions are involved in both PLM cell migration and HSC specification.
Despite a large reduction in embryonic HSC number, approximately 50% of homozygous jam2ahu3319 animals were viable and showed almost normal haematopoiesis in the adult kidney (Extended Data Fig. 6p, q). Further studies will be required to understand how haematopoiesis can recover in jam2ahu3319 animals during development. Perhaps related to this observation, a dispensable role for Jam2 in adult haematopoiesis has also been reported in mice17,18.
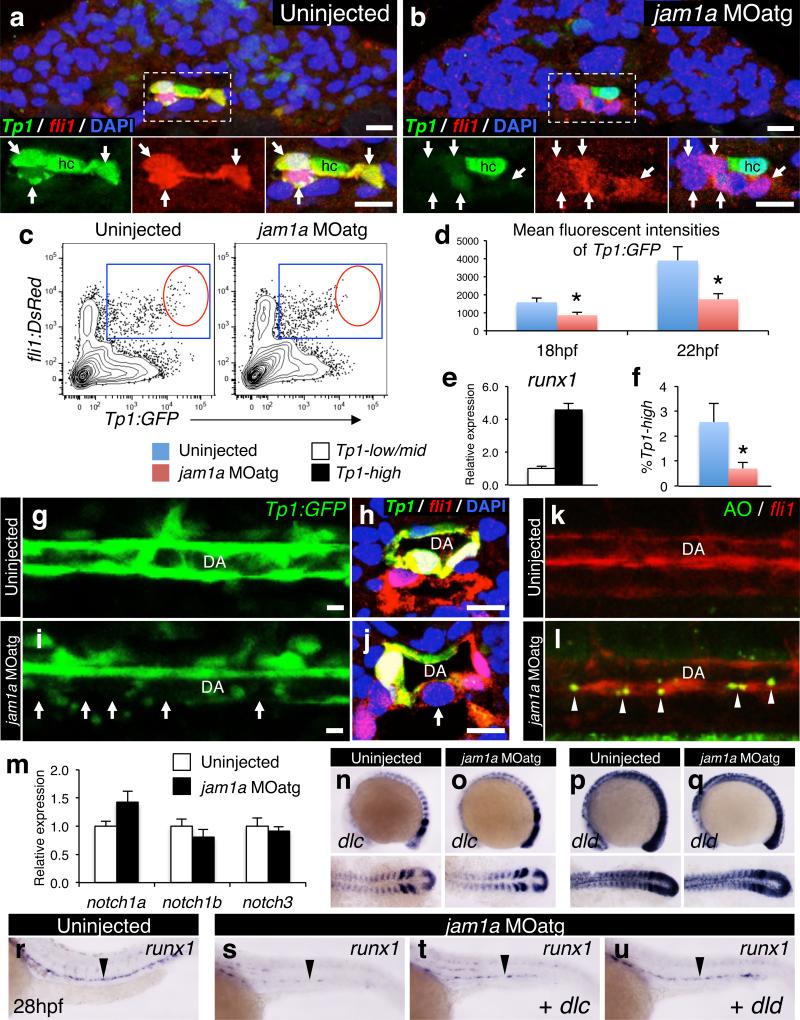
To better understand how both jam1a and jam2a morphants show impaired HSC specification, we considered possible signal transduction mechanisms from the somite. Because our recent work demonstrated that two somitic Notch ligands, Dlc and Dld, are essential for HSC specification4, and because Notch is a juxtacrine signal that requires close contact between adjacent cells, we prioritized analysis of the Notch signalling pathway. To test the hypothesis that Jam1a – Jam2a interactions facilitate Notch signal transmission between the PLM and somite, we first examined the activation of Notch signalling in jam1a morphants using a Notch reporter line, Tp1:GFP, which expresses GFP under the control of tandem Notch responsive elements19. In wild type embryos, some fli1:DsRed+ endothelial cells strongly expressed Tp1:GFP in the midline at 18hpf (Fig. 4a). In jam1a morphants, by contrast, most of the fli1:DsRed+ cells showed weak or no expression of the Tp1:GFP reporter at the same stage (Fig. 4b). The expression levels of Tp1:GFP in fli1:DsRed+ cells were further quantified by flow cytometry (Fig. 4c). The mean fluorescence intensity of GFP in the Tp1:GFP+; fli1:DsRed+ population was significantly lower in jam1a morphants than in uninjected embryos (Fig. 4d). In wild type embryos, runx1 is highly expressed in the Tp1:GFPhigh fraction of fli1:DsRed+ cells at 22hpf (Fig. 4e), suggesting that HSC precursors are enriched in this population. Notably, the percentage of Tp1:GFPhigh; fli1:DsRed+ cells was significantly lower in jam1a morphants (Fig. 4f). At 28hpf, Tp1:GFP was highly expressed in the DA in wild type embryos (Fig. 4g, h). Interestingly, in jam1a morphants, Tp1:GFP expression was weak and discontinuous along the floor of the DA (Fig. 4i, j), the site of HSC emergence10,11. In addition, we observed many apoptotic cells along the aortic floor in jam1a morphants (Fig. 4k, l), suggesting that, in the absence of Notch signalling, HSC precursors fail to be specified and undergo apoptosis.
Figure 4. Notch signalling is depleted in jam1a morphants.
a, b, Transverse sections of Tp1:GFP; fli1:DsRed embryos uninjected or injected with jam1a MOatg at 18hpf. Green and red channels and merges of the boxed regions are shown in the lower panels. Arrows indicate fli1:DsRed+ cells. hc, hypochord. c-f, Flow cytometric and gene expression analysis of Tp1:GFP; fli1:DsRed embryos. Representative results of flow cytometric analysis at 22hpf (c), the mean fluorescent intensities of GFP in Tp1:GFP+; fli1:DsRed+ populations (d), relative expression levels of runx1 in the Tp1:GFPhigh and Tp1:GFPlow/mid population of fli1:DsRed+ cells in wild type embryos at 22hpf (e), and the percentages of Tp1:GFPhigh in fli1:DsRed+ populations at 22hpf (f) are shown. Blue gates and red circles indicate the Tp1:GFP+; fli1:DsRed+ and Tp1:GFPhigh; fli1:DsRed+ population, respectively. *p < 0.01, by Student's t-test; Error bars, s.d. g-j, Lateral views of the dorsal aorta (DA) in Tp1:GFP embryos and transverse sections of Tp1:GFP; fli1:DsRed embryos uninjected or injected with jam1a MOatg at 28hpf. Arrows indicate relatively low activation of Tp1:GFP in the ventral floor of the DA. Bars, 10μm. k, l, Acridine orange (AO) staining under the fli1:DsRed background in uninjected or jam1a MOatg-injected embryos at 30hpf. Arrowheads indicate AO-stained apoptotic cells. m, Relative expression levels of notch1a, notch1b, and notch3 in purified fli1:GFP+ cells obtained from uninjected or jam1a MOatg-injected embryos at 18hpf. n-q, The expression of dlc and dld in uninjected or jam1a MOatg-injected embryos at 14hpf. r-u, The expression of runx1 at 26hpf. Embryos were uninjected, injected with jam1a MOatg alone, or co-injected with jam1a MOatg and dlc or dld mRNA. Data are representative of two independent experiments with four embryos (a, b, h, j), eight embryos (g, i, k, l), four different clutches of embryos (c-f), or two different clutches of embryos (m-u).
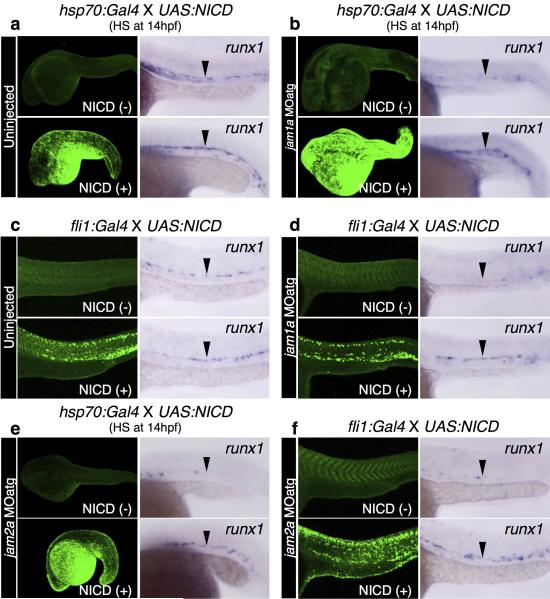
To test whether ectopic activation of Notch signalling is sufficient to rescue HSCs in jam1a morphants, we enforced expression of the Notch intracellular domain (NICD), a dominant activator of the Notch pathway3, using combined hsp70:Gal4; UAS:NICD transgenic lines. Heat-shock induction of NICD at 14hpf rescued the expression of runx1 in the DA in jam1a morphants (Extended Data Fig. 7a, b), similar to that shown previously for rescue of mind bomb (mib) mutants or wnt16 morphants3,4. The expression of runx1 was also rescued in jam1a morphants when NICD was induced in the PLM using the fli1:Gal4 line (Extended Data Fig. 7c, d). Similar results were obtained in jam2a MOatg-injected embryos (Extended Data Fig. 7e, f).
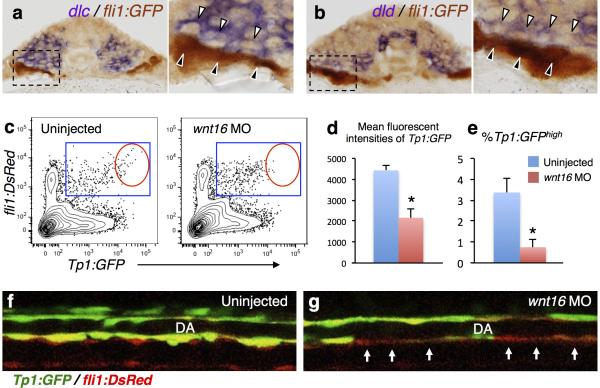
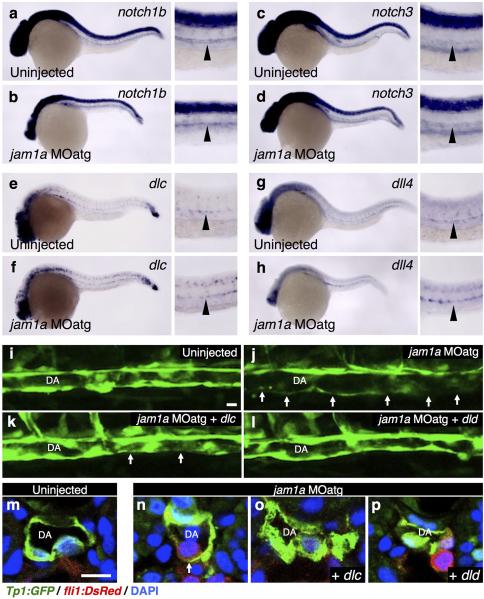
At 15hpf, migrating fli1:GFP+ cells were observed to make direct contact with dlc+ or dld+ somitic cells (Extended Data Fig. 8a, b), indicating that PLM cells may receive Notch signaling via presentation of somitic Notch ligands. We observed low activation of Tp1:GFP in endothelial cells in wnt16 morphants (Extended Data Fig. 8c-g), which show a reduction in somitic dlc and dld4. This suggests that Notch signalling in endothelial cells is activated at least in part by somitic Dlc and/or Dld. We investigated the expression of somitic Notch ligand genes (dlc and dld) as well as aortic Notch receptor and ligand genes (notch1a, notch1b, notch3, dlc, and delta-like 4 (dll4)) in jam1a morphants. Importantly, each was expressed normally in jam1a morphants (Fig. 4m-q, Extended Data Fig. 9a-h), suggesting that the defect in Notch signalling in jam1a morphants is due to low Notch signal transmission rather than misregulation of Notch signalling components. Consistent with this postulate, we observed less contact surface area between migrating PLM cells and the somite in both jam1a and jam2a morphants (Fig. 2i, j, Extended Data Fig. 5m, n), which correlates with low activation of Notch signalling. Our hypothesis is further supported by an additional rescue experiment in which dlc or dld is globally overexpressed in jam1a morphants in order to present more Notch ligand to HSC precursors. As presented in Fig. 4u, the expression of runx1 in the DA was almost fully rescued by co-injection of dld mRNA along with the jam1a MOatg, whereas runx1 expression was only partially rescued following co-injection with dlc mRNA (Fig. 4r-u). Furthermore, the expression of Tp1:GFP was also restored in the ventral floor of the DA by co-injection with dlc or dld mRNA (Extended Data Fig. 9i-p). These data confirm that the impairment of HSC specification in jam1a morphants is caused by inadequate activation of Notch signalling in HSC precursors and suggest that Jam1a and Jam2a normally mediate the physical interaction between these precursors and the somite, which is required for efficient Notch signal transmission (Extended Data Fig 10).
It has been reported that the overall levels of Notch signal transmission is proportional to adhesion strength between Notch receptor- and ligand-expressing cells20. Our data demonstrate that runx1 is highly expressed in the Tp1:GFPhigh population of endothelial cells (Fig. 4e), suggesting that a relatively high level of Notch signalling is required to generate HSC fate. These findings strongly suggest that efficient Notch signal transduction in HSC precursors requires intimate intercellular contact mediated by Jam proteins. Moreover, our data suggest that HSC fate is established much earlier than previously appreciated, during the axial migration of PLM cells, which is well before formation of the DA. These new findings may provide key insights into the timing and tissue interactions needed to instruct HSC fate, which should help inform in vitro approaches to generate HSCs from pluripotent stem cells.
Methods
Zebrafish husbandry and heat shock
Zebrafish were maintained as previously described21 and in accordance with University of California at San Diego Institutional Animal Care and Use Committee (IACUC) guidelines. All animal and cell line experiments are approved by the University of California at San Diego IACUC. The Tg(cmyb:GFP)zf169 (ref. 22), Tg(kdrl:HsHRAS-mCherry)s896 (ref. 23), Tg(fli1:GFP)y1 (ref. 24), Tg(fli1:DsRed)um13 (ref. 25), Et(phldb1:Gal4-mCherry) (ref. 26), Tg(alpha-actin:GFP) (ref. 27), Tg(Tp1:GFP)um14 (ref. 19), Tg(hsp70:Gal4)1.5kca4 (ref. 3), Tg(UAS:NICD)kca3 (ref. 3), Tg(fli1:Gal4)ubs4 (ref. 28), and jam2ahu3319 (ref. 15) were used. Heat shocks were performed at 14hpf for 45 min at 38°C.
Alignment and phylogenetic analysis
cDNA and amino acid sequences were obtained from the National Center for Biotechnology Information (NCBI) database (http://www.ncbi.nlm.nih.gov/). The deduced amino acid sequences of zebrafish Jam1a, Jam1b, and human JAM1 were aligned using ClustalW (European Bioinformatics Institute). A phylogenetic tree of JAM subfamily proteins was constructed as previously described29. Protein domains were predicted using the SMART database (http://smart.embl-heidelberg.de/). The gene locations for zebrafish jam1a and jam1b were examined using the genomic sequence database version 9 at Sanger (http://www.sanger.ac.uk/).
Generation of transgenic lines
Tg(-2.2jam1a:GFP)sd25: a 2.2 kb fragment immediately upstream of the jam1a transcriptional start site was cloned from zebrafish genomic DNA and ligated upstream of the EGFP site in I-SceI-pBSII SK+. Vectors were flanked by ISceI sites and injected into one-cell stage embryos with I-SceI (Roche, 11362399001) to generate transgenic founders. Three -2.2jam1a:GFP founders were identified by screening for the GFP fluorescence of progeny. The line used in this study showed the strongest GFP expression. Tg(-2.2jam1a:CreERT2; -2.2jam1a:GFP)sd26: The CreERT2 fragment was amplified by PCR from pCAG-CreERT2 (Addgene) and ligated upstream of the jam1a promoter in the jam1a:GFP vector. Then, an additional jam1a promoter was ligated upstream of the CreERT2. Ten -2.2jam1a:CreERT2; -2.2jam1a:GFP founders were identified by screening for the GFP fluorescence of progeny. Tg(-5.1jam1a:CreERT2; -5.1jam1a:GFP)sd34: a further 2.9 kb fragment cloned from zebrafish genomic DNA was ligated upstream of both the 2.2 kb promoters (total 5.1 kb). Three -5.1jam1a:CreERT2; -5.1jam1a:GFP founders were identified by screening for the GFP fluorescence of progeny. Tg(bactin2:loxP-BFP-loxP-DsRed)sd27: A PCR-amplified DsRedExpress fragment was used to replace the EGFP site in the pIST2-Myl2-loxP-TagBFP-loxP-EGFP vector. The loxP-TagBFP-loxP-DsRedExpress site was then used to replace the EGFP site in the ISceI-pBSII SK+ vector. A 10.8kb fragment immediately upstream of the bactin2 transcriptional start site was cloned from zebrafish genomic DNA and ligated upstream of the loxP-TagBFP-loxP-DsRedExpress site. Four bactin2:loxP-BFP-loxP-DsRed founders were identified by screening for the BFP fluorescence of progeny.
Cell preparation and flow cytometry
Kidney marrow cells were prepared as previously described29. Briefly, kidneys were dissected, and haematopoietic cells were obtained by macerating the kidney on a stainless steel mesh in 5 mL of ice-cold 2% fetal bovine serum (FBS) in Hanks’ balanced salt solution (HBSS). After centrifugation, the pellet was gently mixed with 1 mL of distilled water by pipetting to lyse erythrocytes by osmotic shock. Subsequently, 1 mL of 2X HBSS was added, and the cells were washed with HBSS by centrifugation. Cells from embryos were prepared as previously described10. Briefly, embryos were collected and anesthetized in E3 medium containing 0.01% tricaine, and were digested with Liberase TM (Roche, 05401119001) in PBS for 1 hour at 37°C. Cells were then filtered through 40μm nylon mesh and washed with 2% FBS in HBSS by centrifugation. Just before flow cytometric analysis, Sytox Red (Invitrogen, S34859) solution was added to the samples at a final concentration of 5nM to exclude nonviable cells. Flow cytometric acquisition was performed on a BD LSR Fortessa (BD Biosciences), and cell sorting was performed on a FACS Aria II (BD Biosciences). Analysis was performed using FlowJo software (Treestar). Cells were sorted into 20% FBS in HBSS, and were used for morphological or expression analysis.
qPCR and RT-PCR
Total RNA was extracted from embryos, dissected kidneys, or sorted cells using RNeasy Mini Kit (QIAGEN, 74104), and cDNAs were synthesized using QuantiTect Reverse Transcription Kit (QIAGEN, 205311). Quantitative real-time PCR (qPCR) assays were performed on a BIO-RAD CFX96 real time system according to the manufacturer's instructions (BIO-RAD). The expression of ef1a was used to normalize the amount of the investigated transcripts. Reverse transcription (RT)-PCR was performed as previously described7. Primers used in qPCR and RT-PCR are listed in Supplementary Table 2.
In situ hybridization
cDNAs were cloned by RT-PCR using specific primers listed in Supplementary Table 2, and ligated into the pCRII-TOPO vector (Invitrogen, K4620-01). Digoxigenin (DIG)- or fluorescein-labeled RNA probes were prepared by in vitro transcription with linearized constructs as previously described29. Embryos were fixed with 4% paraformaldehyde (PFA) in PBS at 4°C overnight. Whole-mount in situ hybridization (WISH) was performed as previously described30. Two-color WISH was performed using DIG- and fluorescein-labeled probes. Embryos were developed with nitro blue tetrazolium chloride (NBT, Roche, 11383213001) / 5-bromo-4-chloro-3-indolyl phosphate, toluidine salt (BCIP, Roche, 11383221001) and FastRed (Roche, 11496549001). Two-color stained embryos were photographed after removal of the yolk extension tube.
Immunohistochemistry and HE staining
Embryos were fixed with 4% PFA, embedded in paraffin, and sectioned at 4μm in thickness. Deparaffinized tissue sections were incubated with blocking solution (1% goat serum, 1% donkey serum, and 0.2% bovine serum albumin in PBS) for 30 min at room temperature and then incubated with 1:1000 chicken anti-GFP (Aves, GFP-1020), 1:1000 rabbit anti-RFP antibodies (for DsRed staining, Abcam, ab34771), and/or 1:500 mouse anti-mCherry antibodies (Abcam, ab125096) overnight at 4°C. For fluorescent immunohistochemistry, sections were incubated with 1:1000 goat anti-chicken IgG Alexa Fluor 488-conjugated (Molecular Probes, A-11039), 1:1000 donkey anti-rabbit IgG Alexa Fluor 594-conjugated (Molecular Probes, A-21207), and/or goat anti-mouse IgG Alexa Fluor 594-conjugated (Molecular Probes, A-11005) secondary antibodies for 1 hr at room temperature. After washing, sections were mounted with Duolink in situ mounting medium with DAPI (Olink, DUO82040). For colorimetric immunohistochemistry, sections were stained with anti-GFP antibody, followed by staining with 1:1000 anti-chicken IgG horseradish peroxidase (HRP)-conjugated secondary antibody (invitrogen, 61-3120) for 1 hr at room temperature. Sections were then developed with 3, 3’-diaminobenzidine (DAB) substrate solution (Sigma, D5905) for 3 min at room temperature. After washing, sections were mounted with mounting medium (50% glycerol, 10% gelatin in ddH2O). Whole-mount immunofluorescence was performed as described4, using 1:500 mouse anti-cMyc antibody (Sigma, M4439) and 1:1000 donkey anti-mouse IgG Alexa Fluor 488-conjugated (Molecular Probes, A-21202). Haematoxylin-eosin (HE) staining was performed on deparaffinized tissue sections as previously described29.
Transient expression
A Flag and HA tag were inserted between the two Ig domains of jam1a and jam2a by two-step PCR, respectively, and cloned into the pcDNA3 vector as previously described29. HEK293T or Hela cells were transiently transfected with the above constructs using FuGENE HD transfection regent (Promega, E2311). Cells were then cultured in 6-well plate with 10%FBS, 200mM L-glutamine in Dulbecco's Modified Eagle Medium (DMEM) at 37°C and 5% CO2.
Immunoprecipitation and Western blotting
HEK293T cells expressing Jam1a-Flag and/or Jam2a-HA constructs were harvested and lysed in lysis buffer (25mM Tris-HCl pH7.4, 1mM EDTA, 0.1mM EGTA, 150mM NaCl, 5mM MgCl2, 2mM Na3VO4, 20% glycerol, 0.1% Triton X-100, 1mM dithiothreitol, proteinase inhibitor). Samples were then centrifuged to remove precipitated proteins and were incubated with anti-Flag M2 agarose antibody (Sigma, A2220) for 3 hrs at 4°C. Samples were washed three times with lysis buffer, resuspended in 2X sample buffer (4% SDS, 0.2M dithiothreitol, 0.1M Tris-HCl pH6.8, 10% glycerol, 20μg/ml bromophenol blue), and boiled for loading. Western blotting was performed as previously described31. Briefly, samples were separated by a NuPAGE 4-12% Bis-Tris Gel (Novax, NP0335BOX). The gel was then transferred using Semi-Dry transfer cell (BIO-RAD) to Immobilon-P Membrane (Millipore, IPVH00010). The membrane was blocked with 1% skim milk, 0.05% Tween-20 in PBS for 30 min at room temperature, and then incubated with 1:1000 mouse anti-HA antibody (Covance, MMS-101P) or 1:1000 rabbit anti-Flag antibody (Sigma, F7425) overnight at 4°C. After washing with 0.05% Tween-20 in PBS (PBST), the membrane was incubated with 1:10000 goat anti-mouse IgG HRP-conjugated secondary antibody (Jackson ImmunoResearch, 115-035-166) or 1:10000 goat anti-rabbit IgG HRP-conjugated secondary antibody (Jackson ImmunoResearch, 111-035-144) for 45 min at room temperature. After washing with PBST, chemiluminescence was performed using the SuperSignal West Pico Chemiluminescent Substrate (Thermo, 34077).
Duolink proximity ligation assay
Hela cells expressing Jam1a-Flag or Jam2a-HA construct were co-cultured on a cover slip. Cells were fixed with 4% PFA for 20 min at room temperature, blocked with 0.1% gelatin-PBS, and stained with 1:1000 rabbit anti-Flag and 1:1000 mouse anti-HA antibodies for 40 min at room temperature. After washing with 0.1% gelatin-PBS, proximity ligation assay (PLA) was done according to manufacturer's protocol (Olink). Cells were then stained with 1:1000 donkey anti-mouse IgG Alexa Fluor 488-conjugated and 1:1000 goat anti-rabbit IgG Alexa Fluor 647-conjugated (Molecular Probes, A-21244) secondary antibodies for 40 min at room temperature. After washing with 0.1% gelatin-PBS, cells were mounted with Duolink in situ mounting medium with DAPI.
Microscopy and acridine orange staining
Fluorescent images were captured using an SP5 inverted confocal microscope (Leica) as previously described10. For time-lapse imaging, embryos were embedded in agarose (1.0% in E3 medium) containing tricaine at a temperature of 28.5°C. z-stacks were taken every 196sec. Videos were created following processing with Volocity software (Improvision). Acridine orange staining was performed as previously described32. Briefly, embryos were dechorionated and incubated in 1X E3 medium containing 5μg/ml acridine orange (Sigma, A8097) for 30 min, followed by three washes in 1X E3. Embryos were then visualized by confocal microscopy. All images captured by confocal microscopy were displayed as maximum projections. Visible light imaging was performed on a BX-51 microscope using 100X oil objective lens and DP70 digital camera and software (Olympus) or a Leica MZ16 microscope and DFC295 digital camera and software (Leica).
Morpholino and mRNA injection
Embryos were injected at the one-cell stage with 1nl of morpholino oligonucleotides (MOs, GeneTools) and/or mRNA. The MO sequences and concentrations used in this study are as follows: jam1a MOatg, AGCACACAAAGGCGAAGGTCAACAT (100μM); jam1a MO control, AGgAgACAAAcGCcAAGcTCAACAT (100μM, lowercase letters denote mismatched bases); jam1a MOex7, ATCACCTTTAACAGAGAACAACACA (300μM); jam2a MOex5, AGGAACTACAGCAGAAACAGGTCAA (400μM). The jam2a MOatg (300μM)15 and wnt16 MO2 (5ng/nl)4 were used as previously reported. The effects of MOs are summarized in Supplementary Table 1. Capped mRNAs were synthesized from linearized pCS2+ constructs using the mMessage mMachine SP6 kit (Ambion, AM1340), and were injected into embryos at following concentrations; dlc, 50ng/μl; dld, 50ng/μl.
4OHT treatment
4-hydroxytamoxifen (4OHT, Sigma, H7904) was dissolved in ethanol as a 25mM stock solution. Embryos were incubated with 5μM of 4OHT in E3 medium. Control embryos were incubated in E3 medium containing 0.02% ethanol. After treatment, the embryos were washed twice in E3 medium and grown as described above.
Experimental design and statistics
All experiments comparing treatment groups were made using randomly assigned siblings without investigator blinding. Sample sizes were chosen after estimating effect size, and data were analyzed for statistical significance after at least two repeated experiments. All data were analyzed by comparison of means using unpaired two-tailed Student's t-tests. No data were excluded. A value of p < 0.01 was considered to be statistically significant.
Extended Data
Extended Data Figure 1. Alignment and phylogenetic analysis of Jam1a.
a, The genomic loci of the jam1a and jam1b gene. Arrows indicate the orientation of each gene. b, Alignment of zebrafish Jam1a, Jam1b, and human JAM1. The multiple alignment was produced using ClustalW. Asterisks indicate a fully conserved residue. Colons and periods indicate strong and weak similarity, respectively. Dashes indicate gaps. Red, light blue, blue, green, yellow boxes indicate signal peptide (Sp), immunoglobulin-like domain (Ig), transmembrane domain (TM), PDZ-binding domain (PBD), and coiled-coil domain (CCD), respectively. Shaded boxes show a cisdimerization motif. c, Phylogenetic analysis of Jam proteins. Cii, Ciona intestinalis; Dre, Danio rerio; Hsa, Homo sapiens; Mmu, Mus musculus; Tni, Tetraodon nigroviridis; Gga, Gallus gallus; Ssc, Sus scrofa; Bta, Bos taurus; Fca, Felis silvestris catus. Cii Jam3 was used as an out-group. The numbers at the relevant branches refer to bootstrap values of 1000 replications. d, Schematic diagrams of human JAM1 and zebrafish Jam1a (left) and Jam1b (right).
Extended Data Figure 2. The expression of jam1a and lineage tracing of jam1a- expressing cells.
a-c, The expression of jam1a at 14, 18, and 24hpf. Black, blue, and red arrows indicate the posterior lateral mesoderm (PLM), pronephros, and dorsal aorta (DA), respectively. d, Single or two-color whole-mount in situ hybridization with jam1a (purple) and/or fli1 (red) probes. The expression domain of fli1 merged with that of jam1a (arrows). e, qPCR analysis of jam1a in purified fli1:GFP+ cells at 14, 17, and 20hpf. Relative expression levels in each cell population were calculated from the expression levels in the kidney tissue. Error bars, s.d. f, GFP expression of -2.2jam1a:GFP at 30hpf. GFP expression was strongly detected in posterior pronephros, lateral lines, and otic vesicles. g, The expression of CreERT2 in -5.1jam1a:CreERT2 at 24hpf. h. Three different schedules of 4-hydroxytamoxifen (4OHT) treatment (12 - 16hpf, 18 - 22hpf, and 24 - 28hpf) in -5.1jam1a:CreERT2; bactin2:loxP-BFP-loxP-DsRed (blue-to-red reporter line). The numbers indicate hour post fertilization (hpf), and red insets in the blue arrows indicate the period of the 4OHT treatment. i, Flow cytometric analysis of kidney marrow cells in 12 - 16hpf group (left, n = 5), 18 - 22hpf group (middle, n = 5), and 24 - 28hpf group (right, n = 2) at 2 months of age. One 12 - 16hpf animal showed switched DsRed+ cells in kidney marrow cells. j, DsRed+ cells from 12 - 16hpf kidneys are distributed in all blood cell populations, including neutrophils and eosinophils (N+E), precursors and monocytes (P+M), and lymphocytes and thrombocytes (L+T). k, l, Confocal imaging of the DA and caudal haematopoietic tissue (CHT) in a 12 - 16hpf embryo at 48hpf. Right panels show high magnification views of the boxed regions in left panels. Embryos are oriented with anterior to the left. There are many ‘switched’ DsRed+ cells in the ventral floor of the DA and in the CHT (arrowheads). Bars, 20μm. Data are representative of two independent experiments with two different clutches of embryos (a-e, g) or eight embryos (k, l) or pooled from two independent experiments (i, j).
Extended Data Figure 3. Characterization of jam1a MOex7-injected embryos.
a, RT-PCR results from jam1a MOex7-injected embryos. cDNA from embryos uninjected or injected with various doses of jam1a MOex7 (100 – 500μM) was subjected to RT-PCR analysis using specific primers, which amplify from exon 4 to 10 of jam1a. ef1a was used as a control. The expected size of PCR products in uninjected embryos is 746 base pairs (bp) (black arrow). Exon 7 (108bp)-skipped products were detected in jam1a MOex7-injected embryos (red arrow). The dose of 300μM was used in this study. b, Exon 7-skipped products were verified by sequencing. The dotted line indicates the junctions between exon 6 and exon 7 (uninjected, upper panel) or exon 8 (jam1a MOex7, lower panel). c, A schematic diagram of the mRNA splicing in jam1a MOex7-injected embryos. The red bar indicates the binding site of jam1a MOex7. d, Schematic diagrams of Jam1a protein in wild type (left) or jam1a MOex7-injected embryos (right). Since exon 7 encodes the transmembrane domain (TM), jam1a MOex7-injected embryos express a mutant protein lacking the TM. Sp, signal peptide; Ig, immunoglobulin-like domain; PBD, PDZ-binding domain. e, The relative expression of wild type jam1a mRNA in uninjected or jam1a MOex7 (300μM)-injected embryos at 24hpf. The reverse primer was designed in exon 7. Error bars, s.d. f-i, The expression of cmyb and rag1 in uninjected or jam1a MOex7-injected embryos. Arrowheads indicate the dorsal aorta (f, g) or the thymus (h, i). Data are representative of two independent experiments with two different clutches of embryos (a, e-i).
Extended Data Figure 4. jam1a is required for HSC specification.
a-c, Fluorescently labeled HSCs in cmyb:GFP; kdrl:mCherry. The number of cmyb:GFP;kdrl:mCherry double-positive cells in the dorsal aorta (DA) were counted in uninjected or jam1a MOatg-injected embryos at 48hpf (arrows). Embryos are oriented with anterior to the left. The average number of double-positive cells is significantly lower in jam1a MOatg-injected embryos (n = 10) compared with uninjected embryos (n =10), *p < 0.001 by Student's t-test; error bars, s. d. d-q, The expression of gata1 (an erythroid marker), lplastin (a myeloid marker) at 24hpf or 4dpf, kdrl (a pan-endothelial marker) in the trunk or caudal haematopoietic tissue (CHT), tbx20 (a marker for the roof of DA), flt4 (a vein marker), cdh17 (a pronephros marker), desma (a somite marker), nkx3.1 (a sclerotome marker), shha (a notochord marker) at 16hpf or 26hpf, and vegfa at 17hpf or 26hpf in uninjected or jam1a MOatg-injected embryos. Arrowheads indicate CHT (f), DA (i), or notochord (o). Data are representative of two independent experiments with ten embryos (a-c) or two different clutches of embryos (d-q).
Extended Data Figure 5. Characterization of jam2a MOex5-injected embryos.
a, RT-PCR results from jam2a MOex5-injected embryos. cDNA from embryos uninjected or injected with various doses of jam2a MOex5 (200 – 600μM) was subjected to RT-PCR analysis using specific primers, which amplify from exon 4 to 10 of jam2a. ef1a was used as a control. The expected size of PCR products in uninjected embryos is 537 base pairs (bp) (black arrow). Intron 4 (72bp)-trapped products were detected in jam2a MOex5-injected embryos (red arrow). The dose of 400μM was used in this study. b, Intron 4-trapped products were verified by sequencing. The dotted line indicates the junctions between exon 4 and exon 5 (uninjected, upper panel) or intron 4 (jam2a MOex5, lower panel). c, A schematic diagram of the mRNA splicing in jam2a MOex5-injected embryos. The red bar indicates the binding site of jam2a MOex5. d, Schematic diagrams of Jam2a protein in wild type (left) or jam2a MOex5-injected embryos (right). Since intron 4 contains an in-frame stop codon, jam2a MOex5-injected embryos express a truncated mutant protein. Sp, signal peptide; Ig, immunoglobulin-like domain; TM, transmembrane domain; PBD, PDZ-binding domain. e-l, The expression of runx1, efnb2a, cmyb, and rag1 in uninjected or jam2a MOex5-injected embryos. Arrowheads indicate the dorsal aorta (e-j) or the thymus (k, l). m, A transverse section of a fli1:GFP; phldb1:mCherry embryo injected with jam2a MOex5 at 16hpf. A high magnification view of the boxed region is shown in the right panel. A dotted line in the right panel indicates the contact surface area between fli1:GFP+ PLM cells and phldb1:mCherry+ somitic cells. Bars, 10μm. n, The average contact surface area between a PLM cell and the somite in uninjected, jam1a MOatg-, or jam2a MOex5-injected embryos. The contact surface area per cell (μm/cell) was calculated from at least one hundred fli1:GFP+ cells in an embryo, and the averages were obtained from three embryos of each. *p < 0.01, by Student's t-test. Data are representative of two independent experiments with two different clutches of embryos (a, e-l) or three embryos (m, n).
Extended Data Figure 6. jam2a is required for HSC specification.
a, A schematic diagram of the preparation of jam2a mutant (jam2ahu3319) embryos. Embryos from an incross of genotyped homozygous (homo) jam2ahu3319 animals were examined by whole-mount in situ hybridization (WISH). b-g, The expression of runx1 and cmyb in the dorsal aorta (DA) and rag1 in the thymus in wild type or jam2ahu3319 embryos. The numbers shown in each panel indicate the frequency of embryos showing each expression pattern. h, i, The expression of fli1 at 18hpf in wild type or jam2ahu3319 embryos. Arrows indicate a subset of fli1+ cells that did not reach the midline. j-o, The expression of endothelial marker genes (kdrl, efnb2a, and flt4) in wild type or jam2ahu3319 embryos at 28hpf. Approximately 90% of embryos showed normal vascular plexus, while the rest of embryos showed a reduction of efnb2a and kdrl. Arrowheads indicate the DA (b-e, l, m), the thymus (f, g), or posterior cardinal vein (n, o). p, Histological analysis of the adult kidney in a wild type or jam2ahu3319 animal at 2 months of age. Many blood cells are observed in the marrow area. Haematoxylin-eosin (HE) staining. q, Representative results of flow cytometric analysis of kidney marrow cells from a wild type or jam2ahu3319 animal at 3 months of age. All blood cell populations are detected in jam2ahu3319 animals. L+T, lymphocytes and thrombocytes; N+E, neutrophils and eosinophils; P+M, precursors and monocytes. Data are representative of two independent experiments with two different clutches of embryos (b-o) or three different animals (p, q).
Extended Data Figure 7. Enforced expression of the Notch intracellular domain rescues HSCs in jam1a or jam2a morphants.
Heat-shock (hsp70:Gal4, a, b, e) or endothelial (fli1:Gal4, c, d, f) induction of Notch intracellular domain (NICD) in uninjected, jam1a MOatg-, or jam2a MOatg-injected embryos. Left panels show whole-mount immunofluorescence visualization of Myc-tagged NICD, and right panels show the expression of runx1 at 26hpf. Arrowheads indicate the dorsal aorta. Data are representative of two independent experiments with two different clutches of embryos (a-f).
Extended Data Figure 8. Somitic Dlc and Dld are involved in the activation of endothelial Notch signalling.
a, b, Transverse sections of fli1:GFP embryos stained with dlc or dld (purple) and anti-GFP antibody (brown) at 15hpf. Right panels show high magnification views of the boxed regions. Migrating fli1:GFP+ cells (black arrowheads) are in contact with dlc+ or dld+ somitic cells (white arrowheads). c-e, Flow cytometric analysis of Tp1:GFP; fli1:DsRed embryos uninjected or injected with wnt16 MO at 22hpf. Representative results of flow cytometric analysis (c), the mean fluorescent intensities of GFP in Tp1:GFP+; fli1:DsRed+ populations (d), and the percentages of Tp1:GFPhigh in fli1:DsRed+ populations (e) are shown. Blue gates and red circles indicate the Tp1:GFP+; fli1:DsRed+ and Tp1:GFPhigh; fli1:DsRed+ population, respectively. *p < 0.01, by Student's t-test. Error bars, s.d. f, g, Lateral views of the dorsal aorta (DA) in Tp1:GFP; fli1:DsRed embryos uninjected or injected with wnt16 MO at 28hpf. Arrows indicate the low activation of Tp1:GFP in the ventral floor of the DA. Data are representative of two independent experiments with four embryos (a, b), eight embryos (f, g), or four different clutches of embryos (c-e).
Extended Data Figure 9. Aortic Tp1:GFP expression is restored by overexpression of dlc or dld in jam1a morphants.
a-h, The aortic expression of notch1b, notch3, dlc, and dll4 in uninjected or jam1a MOatg-injected embryos at 26hpf. Arrowheads indicate the dorsal aorta (DA). i-p, Lateral views of the DA in Tp1:GFP (i-l) and transverse sections of Tp1:GFP; fli1:DsRed (m-p) at 28hpf. Embryos were uninjected, injected with jam1a MOatg alone, or co-injected with jam1a MOatg and dlc or dld mRNA. Arrows indicate relatively low activation of Tp1:GFP in the ventral floor of the DA. The expression of Tp1:GFP was restored in the ventral floor of the DA by co-injection with dlc or dld. Bars, 10μm. Data are representative of two independent experiments with two different clutches of embryos (a-h), eight embryos (i-l), or three embryos (m-p).
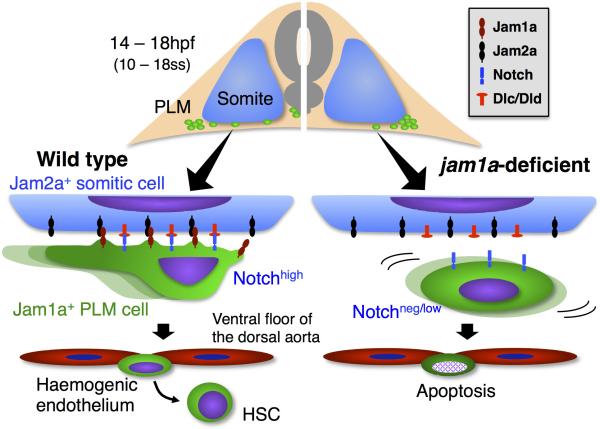
Extended Data Figure 10. A model of Notch signal transduction in HSC precursors.
Jam1a+ PLM cells initially flank the somites then migrate to the midline along the ventral face of the somite, where Jam2a and the Notch ligands Dlc and Dld are expressed. Binding of Jam1a and Jam2a in trans is required for transmission of Notch signals into the PLM derivatives that subsequently generate aortic haemogenic endothelium (left side). In jam1a-deficient embryos, although PLM cells arise and initially migrate normally, their migration is delayed upon contact with the somite. Moreover, they show low activation of Notch signalling due to poor interaction with the somite, resulting in the failure of HSC specification in the aortic floor (right side).
Supplementary Material
Acknowledgements
The authors thank G. Wright for providing the jam2ahu3319 line, A. Shimizu for help in generating transgenic lines, M. Osato for providing the I-SceI-pBSII SK+ vector, M. Distel for providing phldb1:Gal4-mCherry animals, and W. Clements, Y. Lee, and E. Butko provided critical evaluation of the manuscript. This work was supported in part by a JSPS Research fellowship for Young Scientists and a JSPS Postdoctoral fellowship for Research Abroad (I. K.), by a New Investigator Award from the California Institute of Regenerative Medicine, R01-DK074482 from the National Institutes of Health, and an Innovative Science Award from the American Heart Association (D. T.).
Footnotes
Supplementary Information is linked to the online version of the paper at www.nature.com/nature.
Author contributions
I. K., T. S., and D. T. designed research. I. K. generated transgenic lines, performed flow cytometry, cell culture, and transfection experiments, analyzed data, and wrote the manuscript. I. K. and J. K.-S. performed in situ hybridization and real-time PCR. I. K., J. K.-S., and C. P. generated in situ probes. I. K. and N. F. performed immunoprecipitation and Western blotting. I. K. and A. K. performed confocal imaging. J. K.-S. performed histological analyses. A. K., C. P., T. S., and D. T. edited the manuscript.
The authors declare no competing financial interests.
References
- 1.Hadland BK, et al. A requirement for Notch1 distinguishes 2 phases of definitive hematopoiesis during development. Blood. 2004;104:3097–3105. doi: 10.1182/blood-2004-03-1224. [DOI] [PMC free article] [PubMed] [Google Scholar]
- 2.Yoon MJ, et al. Mind bomb-1 is essential for intraembryonic hematopoiesis in the aortic endothelium and the subaortic patches. Mol Cell Biol. 2008;28:4794–4804. doi: 10.1128/MCB.00436-08. [DOI] [PMC free article] [PubMed] [Google Scholar]
- 3.Burns CE, Traver D, Mayhall E, Shepard JL, Zon LI. Hematopoietic stem cell fate is established by the Notch-Runx pathway. Genes Dev. 2005;19:2331–2342. doi: 10.1101/gad.1337005. [DOI] [PMC free article] [PubMed] [Google Scholar]
- 4.Clements WK, et al. A somitic Wnt16/Notch pathway specifies haematopoietic stem cells. Nature. 2011;474:220–224. doi: 10.1038/nature10107. [DOI] [PMC free article] [PubMed] [Google Scholar]
- 5.Weber C, Fraemohs L, Dejana E. The role of junctional adhesion molecules in vascular inflammation. Nat Rev Immunol. 2007;7:467–477. doi: 10.1038/nri2096. [DOI] [PubMed] [Google Scholar]
- 6.Sugano Y, et al. Junctional adhesion molecule-A, JAM-A, is a novel cell-surface marker for long-term repopulating hematopoietic stem cells. Blood. 2008;111:1167–1172. doi: 10.1182/blood-2007-03-081554. [DOI] [PubMed] [Google Scholar]
- 7.Kobayashi I, et al. Comparative gene expression analysis of zebrafish and mammals identifies common regulators in hematopoietic stem cells. Blood. 2010;115:e1–9. doi: 10.1182/blood-2009-07-232322. [DOI] [PubMed] [Google Scholar]
- 8.Thompson MA, et al. The cloche and spadetail genes differentially affect hematopoiesis and vasculogenesis. Dev Biol. 1998;197:248–269. doi: 10.1006/dbio.1998.8887. [DOI] [PubMed] [Google Scholar]
- 9.Jin SW, Beis D, Mitchell T, Chen JN, Stainier DY. Cellular and molecular analyses of vascular tube and lumen formation in zebrafish. Development. 2005;132:5199–5209. doi: 10.1242/dev.02087. [DOI] [PubMed] [Google Scholar]
- 10.Bertrand JY, et al. Haematopoietic stem cells derive directly from aortic endothelium during development. Nature. 2010;464:108–111. doi: 10.1038/nature08738. [DOI] [PMC free article] [PubMed] [Google Scholar]
- 11.Kissa K, Herbomel P. Blood stem cells emerge from aortic endothelium by a novel type of cell transition. Nature. 2010;464:112–115. doi: 10.1038/nature08761. [DOI] [PubMed] [Google Scholar]
- 12.Qian F, et al. Distinct functions for different scl isoforms in zebrafish primitive and definitive hematopoiesis. PLoS Biol. 2007;5:e132. doi: 10.1371/journal.pbio.0050132. [DOI] [PMC free article] [PubMed] [Google Scholar]
- 13.Gering M, Patient R. Hedgehog signaling is required for adult blood stem cell formation in zebrafish embryos. Dev Cell. 2005;8:389–400. doi: 10.1016/j.devcel.2005.01.010. [DOI] [PubMed] [Google Scholar]
- 14.Wilkinson RN, et al. Hedgehog signaling via a calcitonin receptor-like receptor can induce arterial differentiation independently of VEGF signaling in zebrafish. Blood. 2012;120:477–488. doi: 10.1182/blood-2011-10-383729. [DOI] [PMC free article] [PubMed] [Google Scholar]
- 15.Powell GT, Wright GJ. Jamb and Jamc are essential for vertebrate myocyte fusion. PLoS Biol. 2011;9:e1001216. doi: 10.1371/journal.pbio.1001216. [DOI] [PMC free article] [PubMed] [Google Scholar]
- 16.Powell GT, Wright GJ. Genomic organisation, embryonic expression and biochemical interactions of the zebrafish junctional adhesion molecule family of receptors. PLoS One. 2012;7:e40810. doi: 10.1371/journal.pone.0040810. [DOI] [PMC free article] [PubMed] [Google Scholar]
- 17.Sakaguchi T, et al. Putative “stemness” gene jam-B is not required for maintenance of stem cell state in embryonic, neural, or hematopoietic stem cells. Mol Cell Biol. 2006;26:6557–6570. doi: 10.1128/MCB.00729-06. [DOI] [PMC free article] [PubMed] [Google Scholar]
- 18.Arcangeli ML, et al. JAM-B regulates maintenance of hematopoietic stem cells in the bone marrow. Blood. 2011;118:4609–4619. doi: 10.1182/blood-2010-12-323972. [DOI] [PubMed] [Google Scholar]
- 19.Parsons MJ, et al. Notch-responsive cells initiate the secondary transition in larval zebrafish pancreas. Mech Dev. 2009;126:898–912. doi: 10.1016/j.mod.2009.07.002. [DOI] [PMC free article] [PubMed] [Google Scholar]
- 20.Ahimou F, Mok LP, Bardot B, Wesley C. The adhesion force of Notch with Delta and the rate of Notch signaling. J Cell Biol. 2004;167:1217–1229. doi: 10.1083/jcb.200407100. [DOI] [PMC free article] [PubMed] [Google Scholar]
- 21.Westerfield M. The Zebrafish Book: a Guide for the Laboratory Use of Zebrafish (Danio rerio) University of Oregon Press; 2000. [Google Scholar]
- 22.North TE, et al. Prostaglandin E2 regulates vertebrate haematopoietic stem cell homeostasis. Nature. 2007;447:1007–1011. doi: 10.1038/nature05883. [DOI] [PMC free article] [PubMed] [Google Scholar]
- 23.Chi NC, et al. Foxn4 directly regulates tbx2b expression and atrioventricular canal formation. Genes Dev. 2008;22:734–739. doi: 10.1101/gad.1629408. [DOI] [PMC free article] [PubMed] [Google Scholar]
- 24.Lawson ND, Weinstein BM. In vivo imaging of embryonic vascular development using transgenic zebrafish. Dev Biol. 2002;248:307–318. doi: 10.1006/dbio.2002.0711. [DOI] [PubMed] [Google Scholar]
- 25.Villefranc JA, Amigo J, Lawson ND. Gateway compatible vectors for analysis of gene function in the zebrafish. Dev Dyn. 2007;236:3077–3087. doi: 10.1002/dvdy.21354. [DOI] [PMC free article] [PubMed] [Google Scholar]
- 26.Distel M, Wullimann MF, Koster RW. Optimized Gal4 genetics for permanent gene expression mapping in zebrafish. Proc Natl Acad Sci USA. 2009;106:13365–13370. doi: 10.1073/pnas.0903060106. [DOI] [PMC free article] [PubMed] [Google Scholar]
- 27.Higashijima S, Okamoto H, Ueno N, Hotta Y, Eguchi G. High-frequency generation of transgenic zebrafish which reliably express GFP in whole muscles or the whole body by using promoters of zebrafish origin. Dev Biol. 1997;192:289–299. doi: 10.1006/dbio.1997.8779. [DOI] [PubMed] [Google Scholar]
- 28.Zygmunt T, et al. Semaphorin-PlexinD1 signaling limits angiogenic potential via the VEGF decoy receptor sFlt1. Dev Cell. 2011;21:301–314. doi: 10.1016/j.devcel.2011.06.033. [DOI] [PMC free article] [PubMed] [Google Scholar]
- 29.Kobayashi I, et al. Characterization and localization of side population (SP) cells in zebrafish kidney hematopoietic tissue. Blood. 2008;111:1131–1137. doi: 10.1182/blood-2007-08-104299. [DOI] [PubMed] [Google Scholar]
- 30.Thisse C, Thisse B, Schilling TF, Postlethwait JH. Structure of the zebrafish snail1 gene and its expression in wild-type, spadetail and no tail mutant embryos. Development. 1993;119:1203–1215. doi: 10.1242/dev.119.4.1203. [DOI] [PubMed] [Google Scholar]
- 31.Fujita N, et al. The Atg16L complex specifies the site of LC3 lipidation for membrane biogenesis in autophagy. Mol Biol Cell. 2008;19:2092–2100. doi: 10.1091/mbc.E07-12-1257. [DOI] [PMC free article] [PubMed] [Google Scholar]
- 32.Furutani-Seiki M, et al. Neural degeneration mutants in the zebrafish, Danio rerio. Development. 1996;123:229–239. doi: 10.1242/dev.123.1.229. [DOI] [PubMed] [Google Scholar]
Associated Data
This section collects any data citations, data availability statements, or supplementary materials included in this article.


