Abstract
We conducted simulations to compare the potential imaging performance for breast cancer detection with High-Purity Germanium (HPGe) and Cadmium Zinc Telluride (CZT) systems with 1% and 3.8% energy resolution at 140 keV, respectively. Using the Monte Carlo N-Particle (MCNP5) simulation package, we modelled both 5 mm-thick CZT and 10 mm-thick HPGe detectors with the same parallel-hole collimator for the imaging of a breast/torso phantom. Simulated energy spectra were generated, and planar images were created for various energy windows around the 140-keV photopeak. Relative sensitivity and scatter and the torso fractions were calculated along with tumour contrast and signal-to-noise ratios (SNR). Simulations showed that utilizing a ±1.25% energy window with an HPGe system better suppressed torso background and small-angle scattered photons than a comparable CZT system using a −5%/+10% energy window. Both systems provided statistically similar contrast and SNR, with HPGe providing higher relative sensitivity. Lowering the counts of HPGe images to match CZT count density still yielded equivalent contrast between HPGe and CZT. Thus, an HPGe system may provide equivalent breast imaging capability at lower injected radioactivity levels when acquiring for equal imaging time.
Keywords: Monte Carlo Simulation, Germanium Camera, Breast Imaging
1. Introduction
MAMMOGRAPHY has long been the standard technique for the screening and detection of breast cancer. However, mammography performance deteriorates when imaging denser breast tissue (Rosenberg et al 1998). Nuclear Breast Imaging (NBI), also referred to as Scintimammography, Molecular Breast Imaging (MBI) and Breast Specific Gamma Imaging (BSGI), is a technique that utilizes specifically designed gamma cameras to image the distribution of 99mTc-sestamibi, which exhibits higher uptake in malignant tissues than healthy tissue (Delmon-Moingeon et al, 1990). These techniques have less dependence on tissue density and higher sensitivity than mammography for the detection of sub-centimeter diameter tumours (Garibaldi et al 2006, Tornai et al 2004, Mueller et al 2003, Robert et al 2011, Judy et al 2010).
One benefit of using semiconductor detectors for NBI is that their superior energy resolution (ER), compared to scintillators, allows for better separation of scattered photons from primary counts. Cadmium Zinc Telluride (CZT) is a room temperature semiconductor, typically pixilated into millimeter-scale elements, that has seen use in biomedical imaging (Mueller et al 2003, Robert et al 2011). Utilizing small pixel sizes for CZT provides good spatial resolution while also diminishing the contribution of holes to the signal generation (small-pixel effect) (Barrett et al 1995), thereby reducing its low-energy tailing. Current CZT imaging systems offer ER of ~4% Full Width at Half Maximum (FWHM) at 140 keV, compared to Sodium Iodide scintillators which offer ~10% ER at 140 keV (Mueller et al 2003, Robert et al 2011).
High-Purity Germanium (HPGe) detectors offer the best ER of any conventional radiation detector with ~1% FWHM at 140 keV (Johnson et al 2011a). However, these detectors require cooling to liquid nitrogen temperatures for optimal performance, making a compact imaging system for clinical and preclinical settings unrealistic in the past. Recent technological advances have given rise to compact, mechanically cooled HPGe gamma cameras that do not require bulky liquid nitrogen dewars. We have worked with an HPGe detector of 10-mm thickness that offers ~1% ER at 140 keV and ~1.5 mm intrinsic spatial resolution (Johnson et al 2011a). While this particular detector does not have a sufficiently large active area for NBI, in this work we investigate whether an HPGe detector of this type might offer benefits for NBI.
One area in which improved detector performance might enhance lesion detection is adjacent to the chest wall, where out-of-field activity is high and small-angle scatters from the heart and torso can end up in breast images. In theory, better scatter rejection should improve image quality and the visibility of lesions in close proximity to the torso and heart. While it has been argued that the scatter content in NBI is small enough that the ~4% ER at 140 keV of CZT does not greatly improve image contrast compared to detectors with worse ER (Hruska and O’Connor 2006), the even narrower energy windows afforded by the ~1% ER of HPGe might offer some benefit. Furthermore, HPGe, unlike CZT, does not suffer from low-energy tailing, so there also is potential for enhancements in sensitivity compared to CZT due to the higher photopeak fraction. The main objective of this work is to investigate whether the better ER offered by HPGe might translate into improved breast imaging performance. We conduct simulations to compare the imaging performance of HPGe and CZT systems. To ensure accurate results from the simulations, the intrinsic properties and performance of the HPGe detector are validated experimentally using a compact HPGe camera.
2. Experimental and Simulation Methods
2.1. MI4 HPGe Detector Measurements
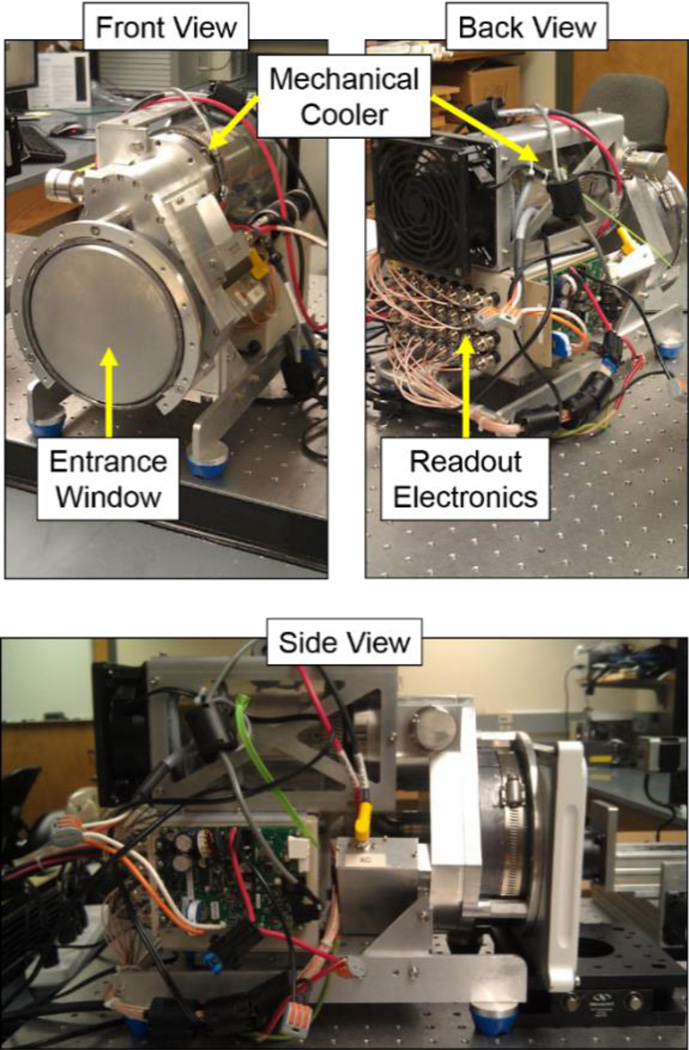
The MI4 HPGe detector, displayed in figure 1, was fabricated by PhDs Co. (Knoxville, TN). The system is a double-sided strip detector comprised of two sets of 16 × 16 orthogonal strips with 4.75-mm strip width, a 5-mm pitch, a 10-mm thickness and an active area of 55.1 cm2 (Johnson et al 2011b). The detector is mechanically cooled to ~60 K. Pulse signal analysis enables 3D position sensitivity finer than the strip pitch and thickness of the HPGe detector (Burks et al 2004).
Figure 1.
Photographs of the MI4 HPGe detector. The entrance window and chamber that houses the HPGe crystal can be viewed from the front, while the readout electronics can be observed from the back side of the detector system. The mechanical cooler that lowers the temperature to liquid nitrogen levels rests on top of the system. The side view of the detector has the collimator attached on the right, along with other electronic components.
To develop an accurate breast imaging camera model for our simulations, physical measurements of the intrinsic properties of the MI4 detector were made. Energy resolution and spatial resolution were evaluated for input into our HPGe detector simulation. The methods for acquiring these measurements are detailed in section 2 and the results are included in the HPGe model description in section 3.
2.1.1. Energy Resolution
To determine an appropriate energy resolution for the simulated detector model, a flood illumination using a 99mTc volumetric source was performed on the MI4. 20 mCi of 99mTc was mixed in ~600 cm3 of aqueous solution inside a plastic box with length and height of 10 cm to cover the FOV of the detector. The energy spectrum was experimentally measured and the FWHM of the generated 140-keV photopeak was calculated for use in the HPGe model.
2.1.2. Intrinsic Spatial Resolution
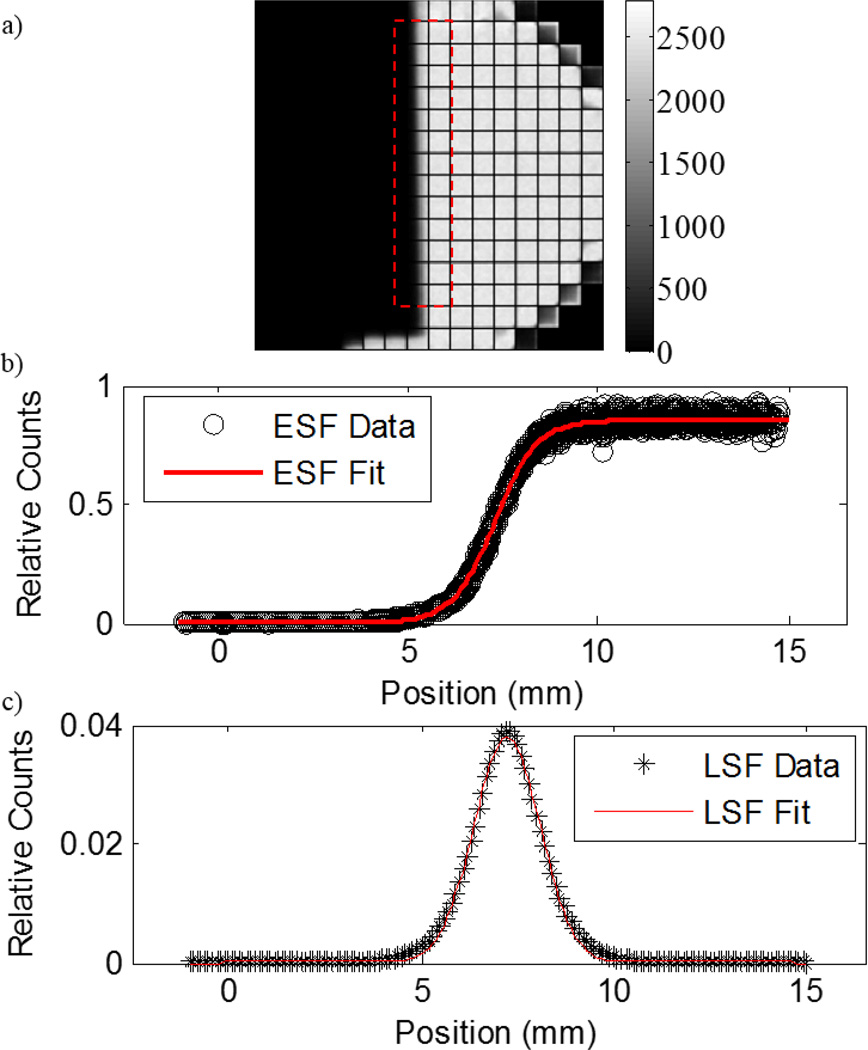
To determine the intrinsic spatial resolution (ISR) across the anode and cathode sides of the detector, we evaluated the FWHM of the Line Spread Function (LSF) through differentiating the measured Edge Spread Function (ESF) (Fujita et al 1985). A tungsten block covered a portion of the detector from a distant point source to generate a transition region between no counts and full illumination due to the spatial response of the detector. The edge was angled relative to the detector face for finer sampling than the effective pixel size. Line profiles were shifted to generate the ESF, which was estimated as a Logistic function using a non-linear, least-squares fit. The ESF fit was then differentiated to create a LSF and fitted to a Gaussian function to calculate the FWHM. The Normalised Root Mean Square Error (NRMSE) was calculated to determine the goodness of fit for the Gaussian function using the following equation:
| (1) |
Here, Data represents the values of the LSF data and Fit represents the fitted Gaussian function values at the same position, i. The term n represents the number of values in Fit. This procedure was repeated for both orthogonal directions.
2.2. Monte Carlo Model and Validation
Measurements of the intrinsic properties of the MI4 HPGe detector were used as inputs for our Monte Carlo model. We experimentally validated the model against the imaging performance of the detector/parallel-hole collimator combination to ensure realistic results. The Monte Carlo N-Particle (MCNP5) package was used to conduct simulations (Brown et al 2002). Its PTRAC card records the event history, including interaction positions, interaction types, propagating direction, and deposited energy, of particles that meet selected criteria. This information was used within a MATLAB (MathWorks, Inc.) parser script for the generation of energy spectra and, subsequently, planar images from events falling within chosen energy windows.
2.2.1. HPGe Camera Model
For these simulations, we modelled our HPGe detector following the simulations of a CZT-based imaging system described in Hruska and O’Connor (2008) and the architecture of the MI4 HPGe detector. The LumaGEM (Gamma Medica, Salem, NH) CZT system contained a matrix of 96 × 128 CZT pixels with dimensions of 1.6 mm × 1.6 mm × 5 mm each for a total active area of 15 cm × 20 cm. Surrounding the detector was 4-mm thick lead shielding, and a 4-mm thick lead compression pad was located on top of the breast. For this study, we maintained the 15 cm × 20 cm active area of the CZT detector, the lead shielding and compression pad, but swapped the CZT for an HPGe detector, which includes an aluminum entrance window and a vacuum inter-detector space.
We modelled the 1-cm thick HPGe detector with 0.50-mm by 0.50-mm pixels within the 15-cm × 20-cm active area. The collimator used was a conventional low energy high resolution (LEHR) parallel-hole collimator with hexagonal shape, 1.85-mm hole-diameter, 0.3-mm septal thickness and 20-mm bore length. Event positioning was determined as the first interaction within the camera model. No explicit modelling of the strip readout or the gap regions between strips was performed. Spatial blurring was added to the model on an event-by-event basis using a Gaussian distribution for the x- and y-dimensions prior to binning. The FWHMs of the Gaussian blurring functions were the measured ISR in the x and y dimensions. To compare HPGe and CZT images, the HPGe projection images measured were rebinned to 1.5-mm by 1.5-mm pixels by summing 3 × 3 groups of the original 0.50-mm by 0.50-mm pixels.
The energy resolution for energies below 140 keV was estimated using (2) for events that lost energy due to Compton scatter within the collimator, HPGe detector or phantom:
| (2) |
Eres is the experimentally measured energy resolution at 140 keV and E is the absorbed energy from an event measured within the modelled detector (Hruska and O’Connor 2008). An energy-dependent Gaussian blurring function, shown in (3), was applied to the absorbed energy to determine the total energy recorded:
| (3) |
Randn is a random number selected from a normal distribution within the MATLAB script. The total energy was parsed into 0.25-keV bins to generate energy spectra.
2.2.2. Experimental Validation
We first validated our HPGe model by comparing the planar sensitivity between the MI4 camera and simulated HPGe camera. The planar sensitivity was acquired based upon procedures outlined in the NEMA standards for characterizing gamma cameras (NEMA 2007). A petri dish with an inner diameter of 8.6 cm was filled with a thin volume of aqueous 99mTc with 3.85 mCi of radioactivity. The petri dish was oriented parallel to the camera, placed 10 cm away and imaged for 300 seconds. The same experiment was conducted in simulation with a total of 3.424 × 10¹⁰ emitted photons, equivalent to imaging 3.85 mCi of 99mTc for 240 seconds. Planar sensitivity was determined from the experiment and simulation by summing over counts within equal-sized ROIs in the resulting images and applying the following equation for the decay-corrected count rate Rt,
| (4) |
where Ct is the total number of counts in the image, TStart is the start time of the scan, TCali is the time of activity calibration, TAcq is the scan duration, and THalf is the half-life of 99mTc at 21672 seconds. The planar sensitivity, S, was calculated with (5) using the calibrated activity, ACali, and the results from (4),
| (5) |
We also validated our HPGe model by comparing the measured total system resolution (combined collimator and detector resolutions) of the MI4 camera to both the simulated resolution and the expected resolution given by analytic calculations. Methods for measuring total system resolution closely followed procedures outlined in the NEMA standards for characterizing gamma cameras (NEMA 2007). A capillary tube with an inner-diameter of 1.1 mm was filled with an aqueous 99mTc solution and imaged parallel to the anode and cathode strips from 1 cm and 5 cm distance in 1-cm steps from the collimator face. The same acquisitions were simulated using the HPGe model to generate corresponding projections. Line spread functions of the capillary projections were fit to Gaussian functions to determine averaged FWHM and FWTM for both the experimentally measured and simulated data. NRMSE was calculated to determine the goodness of fit for the Gaussian fits following (1) in section 2.1.2. To calculate the theorized system resolution, the geometric resolution Rg (Anger 1967) for parallel-hole collimation was employed and added in quadrature to the ISR, Ri, as shown in (6) and (7):
| (6) |
| (7) |
Here, d is the collimator-hole diameter, le is the effective collimator length adjusted for attenuation, x is the source-to-collimator distance, and c is the spacing between the bottom of the collimator and the detector material, assumed to be 14.6 mm. Analytic FWTM was assumed to be 1.83 times the recorded FWHM. Percent error between the simulated and experimental system resolution at each collimator to capillary distance was calculated and averaged to determine agreement between the simulation model and the HPGe camera.
In the case that the model and camera total system resolution do not agree, adjustments to the model must be considered. To compensate for the HPGe model’s underestimation of the total system resolution, we increased the simulated ISR in the y-direction to yield the appropriate system resolution. This was calculated by averaging the quadrature differences between the measured FWHM and FWTM from the geometric resolutions for the five measurements at different depths. With matching energy and spatial resolution to the MI4 camera, our HPGe breast imaging model is expected to accurately simulate the imaging performance for a clinically-relevant NBI task.
2.3. Nuclear Breast Imaging Simulations
2.3.1. Breast Phantom Parameters
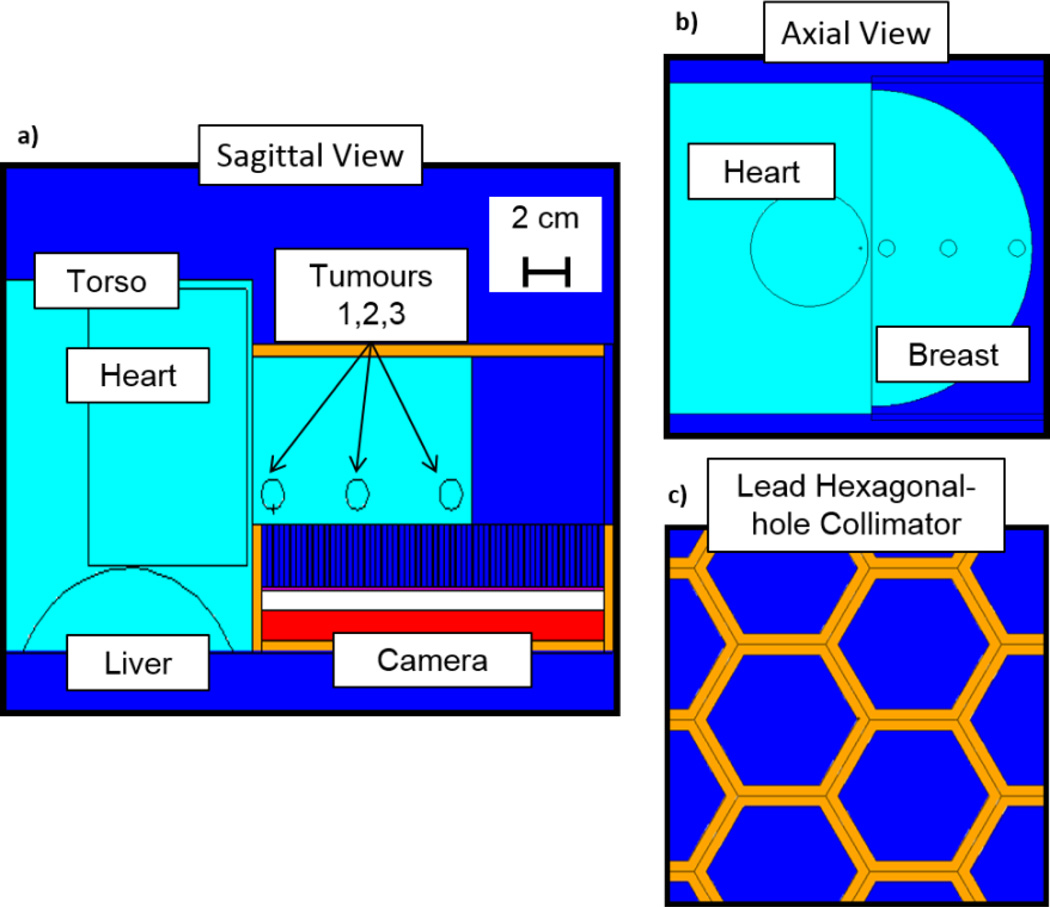
To reiterate, the objective of this work was to investigate whether the better ER offered by HPGe might translate into improved breast imaging performance. We modelled a breast and torso water phantom for the simulation based on the description in Hruska and O’Connor (2008). The half-cylindrical breast had a thickness of 5.5 cm and a radius of 9.6 cm. Adjacent to the breast was a 20 cm × 20 cm × 12.5 cm box representing the torso, which contained a cylindrical heart and the top portion of a cylindrical liver with heights of 9 cm and 14 cm, respectively, and radii of 3.50 cm and 5.25 cm, respectively. The torso and liver objects were truncated to expedite the simulations. The breast contained three 1-cm diameter spherical tumours located near the chest wall at the edge of the FOV of the detector, in the centre of the breast, and near the outer edge of the breast. The tumours were either located 1 cm from the camera with a tumour-breast radioactivity concentration ratio (TBR) of 5:1 or 4 cm from the collimator with a TBR of 10:1. All tissues were treated as water. A schematic of the imaging simulation is shown in figure 2. Radioactivity concentrations for the organs were set from clinical studies for uptake of 99mTc-sestamibi following Hruska and O’Connor (2008) and appear in table 1.
Figure 2.
A schematic of the geometry for the Monte Carlo simulation. (a) A sagittal view of the detector (red) and the breast/torso phantom (light blue) with 3 spherical tumours. Four-mm thick lead shielding (orange) surrounds the camera and a 4-mm thick lead pad simulates light compression of the breast. (b) Axial view of the breast/torso phantom with the heart and three spherical tumours. (c) Axial view of the lead hexagonal parallel-hole collimator.
Table 1.
Source definitions for the breast/torso phantom
| Organ | Volume (mL) |
Activity Concentration |
Emission Probability |
|---|---|---|---|
| Liver | 254 | 80 | 0.66 |
| Heart | 350 | 15 | 0.17 |
| Torso | 4259 | 1 | 0.13 |
| Breast | 796 | 1 | 0.02 |
| Tumours | 0.524 | 5 or 10 | 8.5×10⁻⁵ or 1.7×10⁻⁴ |
2.3.2. CZT Camera Model
To compare imaging performance between detectors with different energy resolutions, we benchmarked the HPGe detector against the performance of a CZT-based system. The CZT camera was modelled partly from its description in Hruska and O’Connor (2008) with slight differences from the LumaGEM system briefly described in section 2.2.1. To keep the simulated CZT model design similar to the HPGe model, the same architecture of the MI4 detector was used for the CZT model, including the LEHR collimator, aluminum entrance window and inter-detector vacuum space. An energy resolution of 3.8% at 140 keV was used with an ISR of 1.6 mm (Pani et al 2006). CZT exhibits a low-energy tailing effect arising from incomplete charge collection due to its poor transport properties (Wagenaar 2004). Previous work suggests that randomly subjecting 60% of events to tailing best matches experimentally acquired energy spectra (Hruska and O’Connor 2008). The distribution for the tailing effect was empirically created by matching simulated energy spectra of a 140 keV source to experimental data. The experimental CZT spectrum was obtained from published material (Hruska and O’Connor 2008), while the simulated spectrum was created from an MCNP5 simulation of an isotropic 140-keV point source. The tailing distribution was then created from the difference in relative counts between the observed and simulated spectra, both of which were normalized, in each energy bin. This tailing model was applied on an event-by-event basis to determine measured energy within the detector.
2.3.3. Simulation Measurements and Analysis
Ten independent simulations of 3×10¹⁰ generated photons each were conducted for both systems and tumour parameters, equivalent to imaging 1.35 mCi of 99mTc activity within the water phantom for 10 minutes and yielding clinically relevant count densities of approximately 1000 counts/cm2 in standard CZT images with ±10% energy window. Simulated energy spectra parsed by scatter order, the number of scatters within the phantom, and event origin were generated for the CZT and HPGe models. We generated planar images from events falling within energy windows of ±10% and an asymmetric 15% energy window from −5% to +10% for CZT, similar to Hruska and O’Connor (2008), and energy windows of ±2.5% and ±1.25% for HPGe. Relative sensitivity, or number of counts within the images, was measured relative to the mean counts recorded for the CZT images with a ±10% energy window. We calculated scatter and torso fractions, defined as the fraction of all events within the chosen energy window that scattered in the phantom and the fraction of all events within the chosen energy window that originated in the torso, respectively. Line profiles were drawn through the horizontal centre of the images to assess tumour signal and background levels in CZT and HPGe. Average tumour contrast and signal-to-noise ratios (SNR) for each individual tumour were calculated using a 3 × 3 pixel ROI centred on the tumours, and a 9 × 9 pixel ROI of adjacent background and applying the following equations:
| (8) |
| (9) |
Statistical analysis using the student-t test was performed to compare contrast and SNR between the detector and energy window combinations for each tumour. Additionally, we investigated the quality of HPGe and CZT images with equivalent counts. Images were generated with equal count densities of approximately 1000 counts/cm2 and energy windows of ±10% and ±2.5% for CZT and HPGe, respectively. These energy windows were chosen for each detector as they offered the highest relative sensitivity for each system. The same image analysis was performed for images with equivalent count densities.
3. Experimental and Simulation Results
3.1. MI4 HPGe Detector Intrinsic Properties
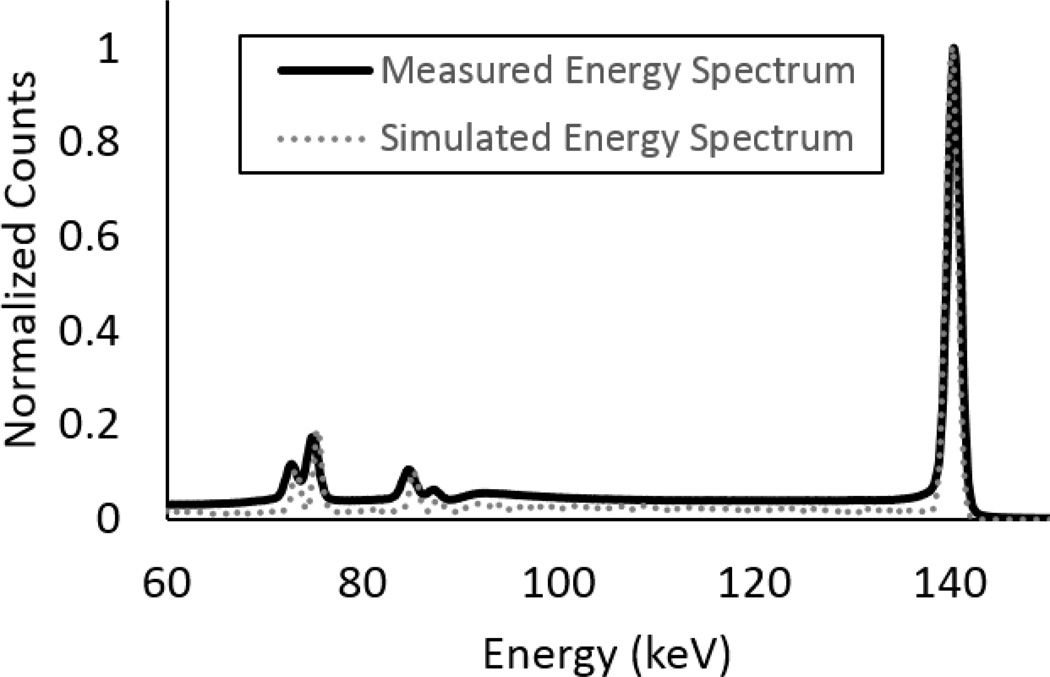
Normalized energy spectra from the MI4 HPGe detector and modelled HPGe breast camera model are displayed in figure 3. The measured FWHM of the 140-keV photopeak was 1.43 keV, resulting in an ER of 1.02%.We modelled our HPGe detector with a fixed ER of 1.0% at 140 keV, given that the ER of these detectors are consistently around 1.0% at 140 keV (Johnson et al 2011b).
Figure 3.
Energy spectra acquired using a 99mTc source with the MI4 HPGe Camera and the Monte Carlo simulation model. The spectra have been normalized for comparison. The two energy spectra correlate well, particularly for the 140-keV photopeak. The small differences in intensity is due to differing amount of lead shielding around the MI4 and modelled breast camera. The equal FWHMs for the peaks signifies that the energy resolution model for varying energies is accurate.
Figure 4 shows an acquired image for the ESF, the ESF with the Logistic fit, and the LSF with the Gaussian fit for the x-axis resolution. NRMSE was 3.3% for both Gaussian fits in the x- and y-dimensions. Using the ESF method, we found that the ISR in the x-dimension was 1.9 mm, while the ISR in the y-dimension was 1.5 mm.
Figure 4.
(a) Edge spread function dataset for determining the ISR in the x-dimension. The units on the scale is counts. (b) Horizontal line profiles within the red box were shifted and plotted to generate an ESF, which was fitted to a Logistic function. (c) The derivative of the ESF is the LSF, which was fitted to a Gaussian function for FWHM measurements. The ISR was found to be 1.9 mm and 1.5 mm in the x- and y-axes, respectively.
3.2. Experimental Validation
The planar sensitivities for the experiment and simulation were 200 and 402 cpm/µCi (counts per minute per micro-curie), respectively. The current method for processing events excludes those in which charge is collected on more than one strip on either side. The strip readout of the MI4 was not explicitly modelled, but count losses from its effects can be estimated. More than 10% of photons would be expected to interact in or adjacent to gap regions between strips and, therefore, not be included, as these events would result in incomplete charge collection or charge sharing between strips. In addition, approximately 35% of incident photons undergo Compton scattering within the detector, leading to energy deposition across multiple strips and exclusion from event totals. Accounting for these count losses in the simulation yields a planar sensitivity of 229 cpm/µCi, for a 14.5% difference in sensitivity between the model and the MI4 camera. Other factors, such as detector dead-time and edge effects, were not modelled and could also reduce the measured MI4 camera sensitivity.
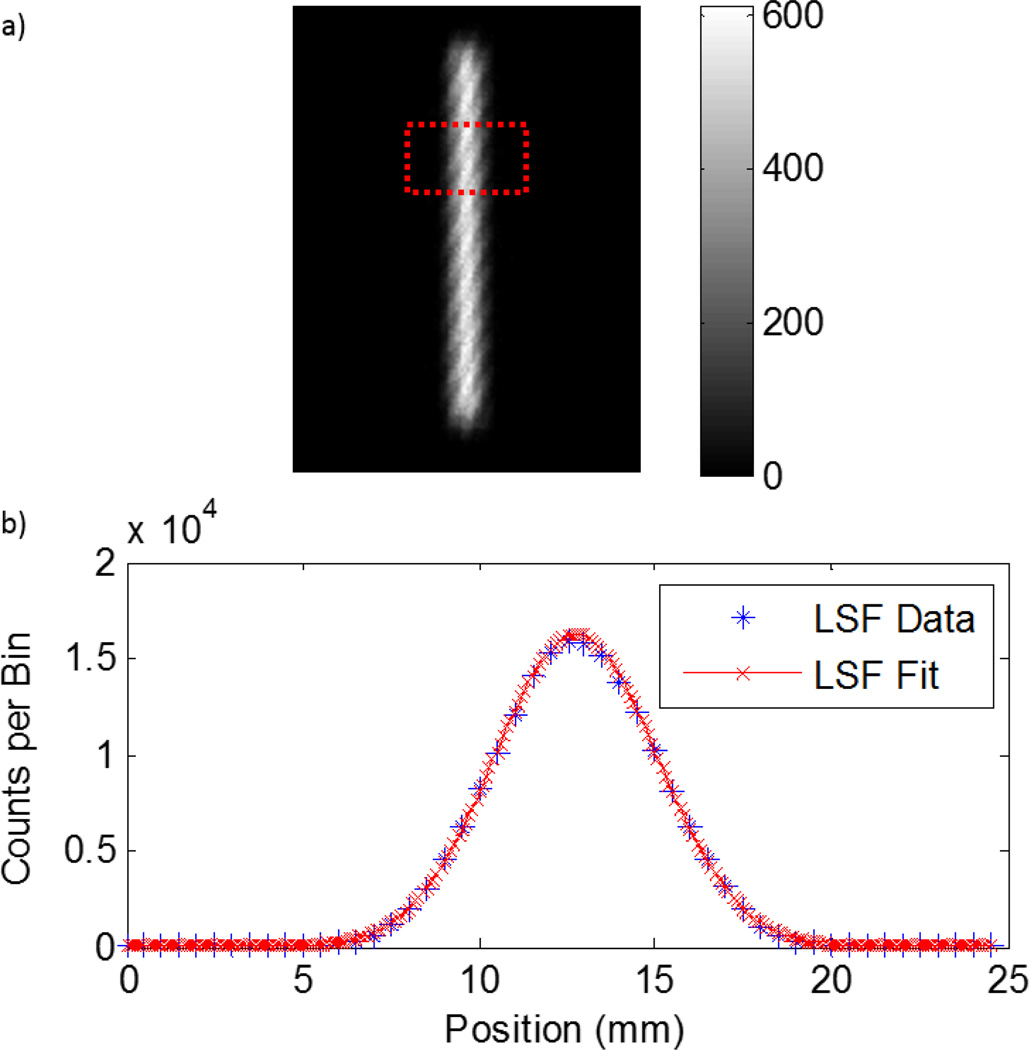
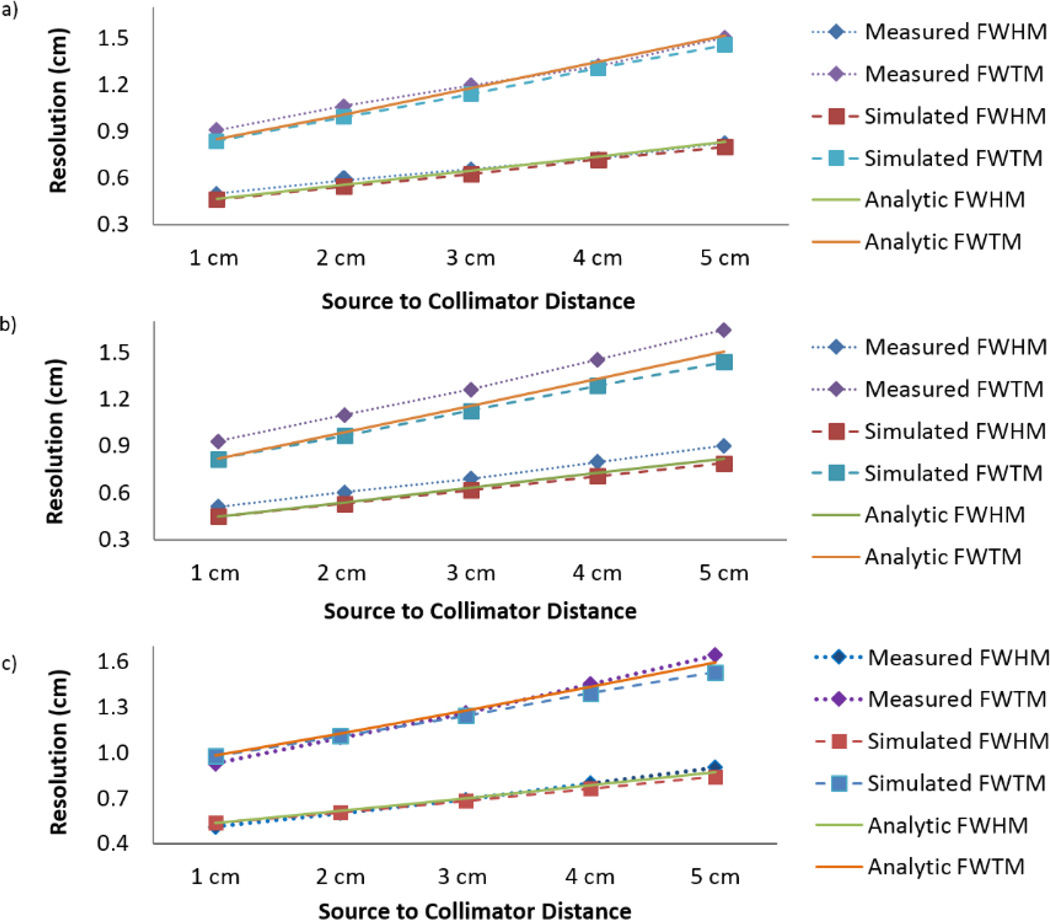
Figure 5 displays a representative capillary projection and Gaussian fit to the LSF. Table 2 provides the goodness of fits for the Gaussian distributions. Figure 6 shows the results for the experimental, simulated, and analytic FWHM and FWTM measurements in the x and y dimensions. All of the Gaussian fits had an average NRMSE <5% from the LSFs. There is agreement in FWHM and FWTM along the x-axis, where the average percent error was 4.4%. However, an error of 11.5% between the experimental and simulation resolutions in the y-axis was observed, as seen in figure 6 (b). After compensating for the difference between simulation and experiment, the intrinsic resolution in the y-dimension was 0.33 cm. Figure 6 (c) displays the new total system resolution trends by distance for the y-dimension. In this case, the agreement between measured and simulated resolution improved to 1.2% percent error. By matching energy and spatial resolution to the MI4 camera, our HPGe breast imaging model is expected to accurately simulate the imaging performance for a clinically-relevant NBI task.
Figure 5.
Total system resolution measurement and analysis. (a) A representative projection of the 1-mm diameter capillary at a 2-cm distance from the modelled HPGe camera. The scale is in units of counts. The box signifies one set of horizontal line profiles summed together to generate a LSF. Five LSFs are generated per projection. (b) The LSF created from the data within the box for estimating the total resolution. The LSF data was fitted to a Gaussian function, whose FWHM and FWTM were taken for spatial response measurements.
Table 2.
NRMSE goodness of fit measurements (Average ± standard deviation) for determining total system resolution. All numbers are percentages.
| Capillary Distance |
MI4 Resolution Fits | Model Resolution Fits | ||
|---|---|---|---|---|
| X-Resolution | Y-Resolution | X-Resolution | Y-Resolution | |
| 1 cm | 2.28 ± 1.58 | 2.57 ± 1.10 | 1.42 ± 1.08 | 0.95 ± 0.28 |
| 2 cm | 2.71 ± 0.96 | 2.65 ± 1.06 | 1.41 ± 0.52 | 1.18 ± 0.18 |
| 3 cm | 3.22 ± 1.51 | 3.53 ± 1.69 | 1.61 ± 0.22 | 1.28 ± 0.16 |
| 4 cm | 3.67 ± 1.57 | 3.17 ± 1.41 | 1.73 ± 0.37 | 1.30 ± 0.05 |
| 5 cm | 4.25 ± 1.43 | 3.12 ± 1.47 | 1.83 ± 0.13 | 1.69 ± 0.15 |
Figure 6.
The total system resolution measurements along the (a) x-axis and (b) y-axis. FWHM and FWTM are shown for experiment, simulation, and analytic calculations. Percent error from the experimental resolution for the simulation was 4.4% and 11.5% for the x- and y-axis, respectively. The intrinsic resolution in the y-dimension was altered in the model for more realistic system resolution, shown in (c). The percent error after adjustment was 1.2% in the y-axis, signifying comparable performance between the MI4 HPGe detector and the Monte Carlo model.
3.3. Generated Energy Spectral Analysis
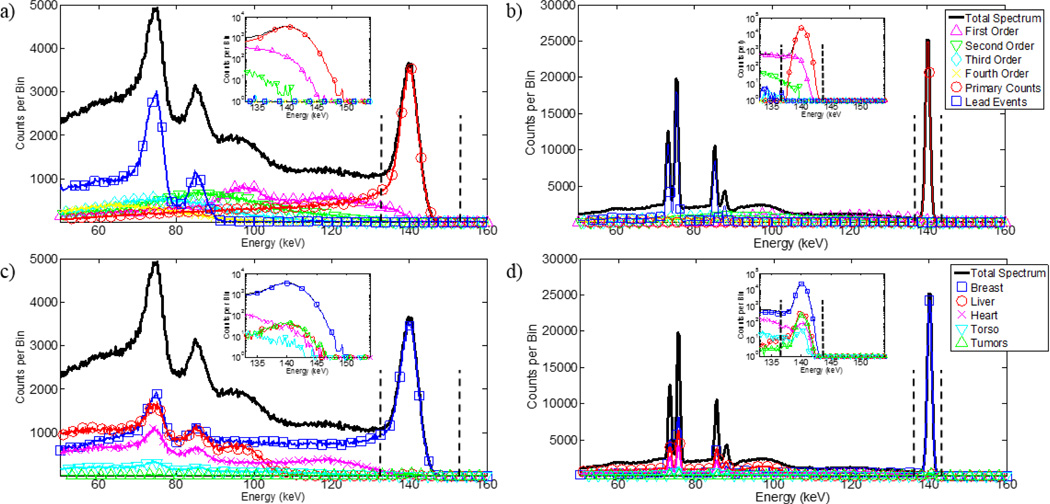
Generated energy spectra from one run of the CZT and HPGe simulations are displayed in figure 7. Scatter and torso fractions within set energy windows of energy spectra are shown in table 3. Some of the advantages of HPGe can be observed in these energy spectra, including the lack of low-energy tailing and narrower photopeaks. Less scatter and photons originating from the torso fall within the energy windows in HPGe spectra than a CZT spectra. Thus, background from the torso and scatters within the breast or collimator contribute less to generated images.
Figure 7.
Generated energy spectra from the breast imaging simulations. (a) CZT spectrum parsed by scatter order. (b) HPGe spectrum parsed by scatter order. (c) CZT spectrum parsed by event origin order. (d) HPGe spectrum parsed by event origin. Legends describe plots along same horizontal axis. The vertical dashed-lines signify energy windows of −5%/+10% on CZT and ±2.5% on HPGe placed around the 140-keV photopeak. Log-scale insets of the photopeak are displayed in each plot. The low-energy tailing of CZT removes primary events from the energy window and the image. The 1% ER at 140 keV of HPGe provides sharp peaks that enable the use of narrower energy windows to minimize inclusion of out-of-field radioactivity that undergoes small-angle scattering.
Table 3.
Performance measures by detector type and energy window
| Detector System |
Energy Resolution |
Energy Window |
Relative Sensitivity |
Scatter Fraction |
Torso Fraction |
|---|---|---|---|---|---|
| CZT | 3.8% | ±10% | 100.00% | 17.22% | 7.32% |
| −5%/+10% | 76.61% | 8.63% | 3.35% | ||
| HPGe | 1.0% | ±2.5% | 123.70% | 4.66% | 2.83% |
| ±1.25% | 120.45% | 2.41% | 2.50% | ||
3.4. Simulated Images
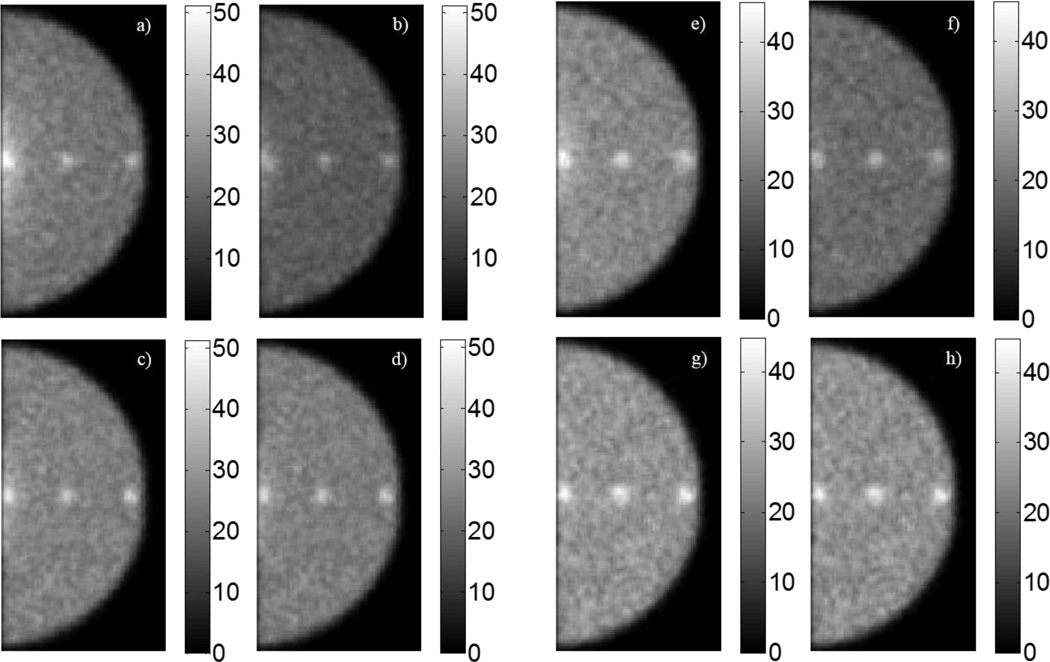
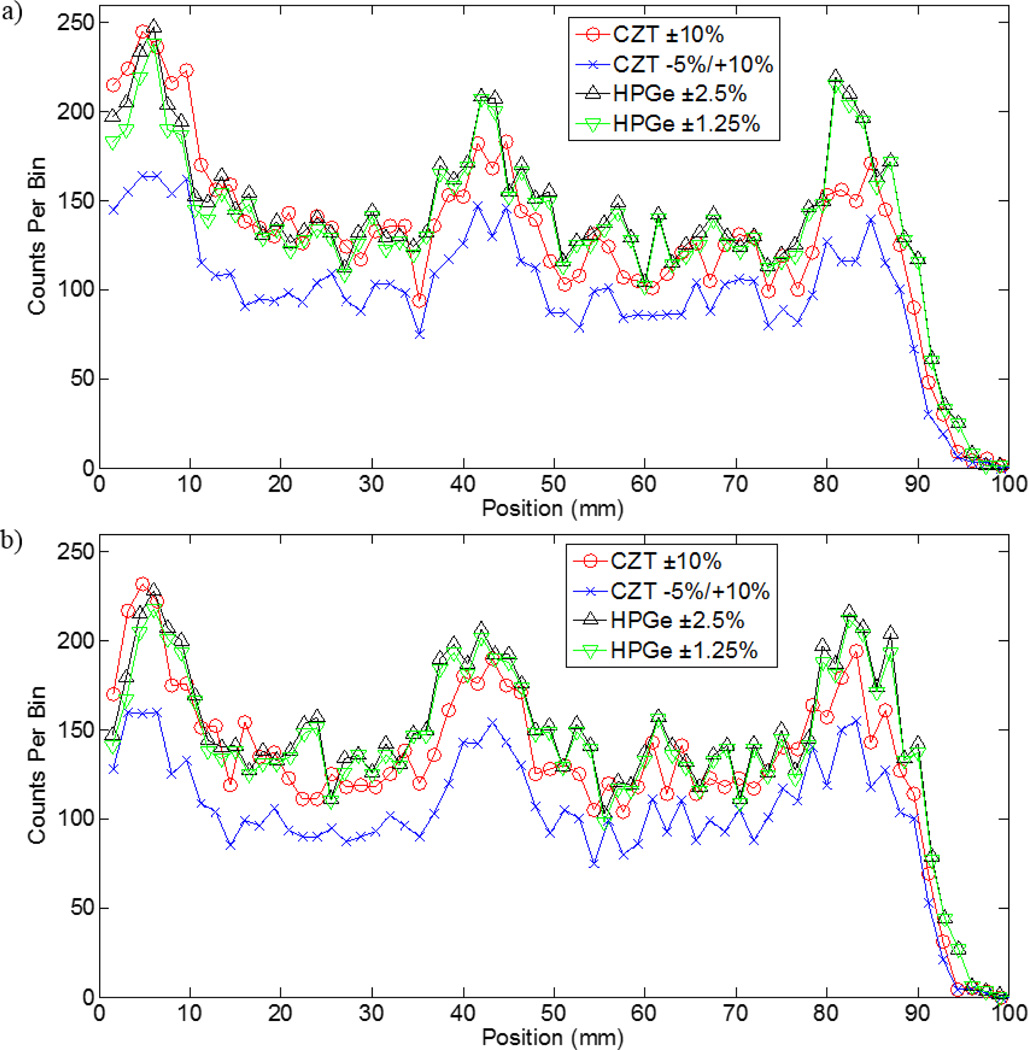
Representative images from a single simulation run following application of a 3 × 3 mean filter are shown in figure 8. The three tumours at both depths within the breast phantom are visible across all the detector/energy window pairings. Line profiles drawn across the centre of the CZT and HPGe images in figure 8 are shown in figure 9, confirming that the signal from the tumours rises above the background in CZT- and HPGe-generated images.
Figure 8.
Filtered breast images generated from one simulation run. Figures (a) – (h) correspond to tumours located at a 1-cm depth and (e) – (h) correspond to the tumours at a 4-cm depth. (a), (e) CZT ±10%. (b), (f) CZT −5%/+10%. (c), (g) HPGe ±2.5%. (d), (h) HPGe ±1.25%.
Figure 9.
Line profiles drawn through the centre of the CZT and HPGe images in figure 8. The zero position corresponds to the region near the chest wall. (a) Profiles for the 1-cm depth tumours. (b) Profiles for the 4-cm depth tumours. The high intensity peaks are consistent with the position of the three tumours. In general, the HPGe profiles are higher intensity at the tumours and background regions.
3.5. Imaging Performance
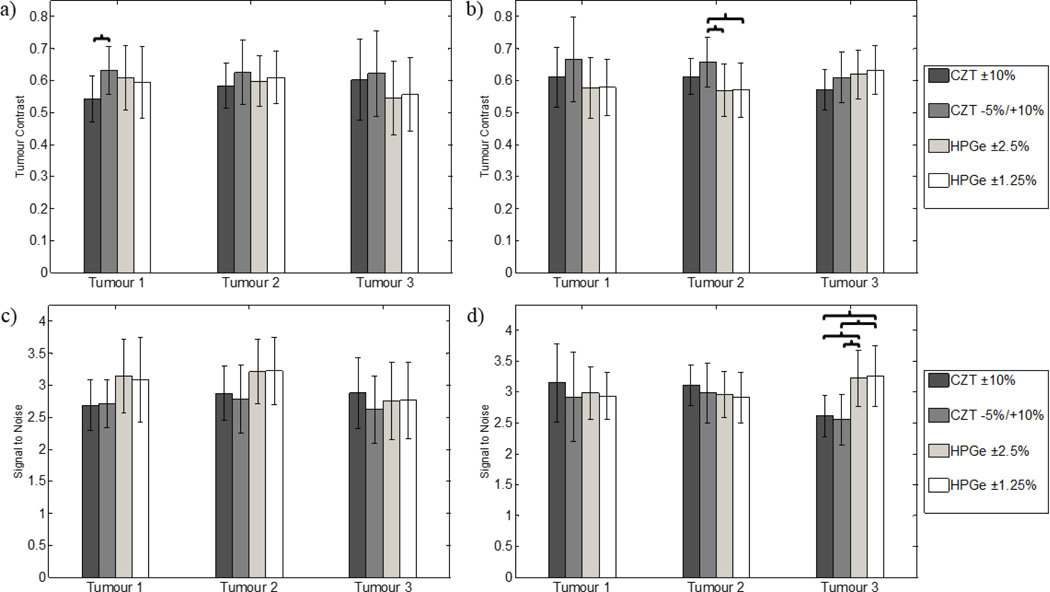
Table 3 also displays the relative sensitivity results from the simulations. Average tumour contrast and SNR for each tumour are compared in figure 10 for each detector and energy window combination at both tumour depths. When comparing image quality between CZT and HPGe for tumours at a 1-cm depth, we observe no statistical difference for both tumour contrast and SNR. For the 4-cm depth tumours, tumour 2 contrast is statistically higher for CZT with the asymmetric energy window than both HPGe-acquired images (p = 0.02). Conversely, the SNR of tumour 3 for both HPGe images is significantly greater than CZT-acquired images (p < 0.005).
Figure 10.
Average tumour contrast and signal-to-noise measurements for all combinations of detector and energy window across ten independent simulations for the (a), (c) 1-cm depth tumours and the (b), (d) 4-cm depth tumours. Error bars represent one standard deviation from the mean. The brackets point to the detector/energy window combinations with significant differences, or p-values < 0.05. With the 1-cm depth tumours, CZT and HPGe exhibit similar performance, while SNR is greater for HPGe-acquired images for tumour 3 at a depth of 4 cm.
3.6. Equal Sensitivity Imaging Performance
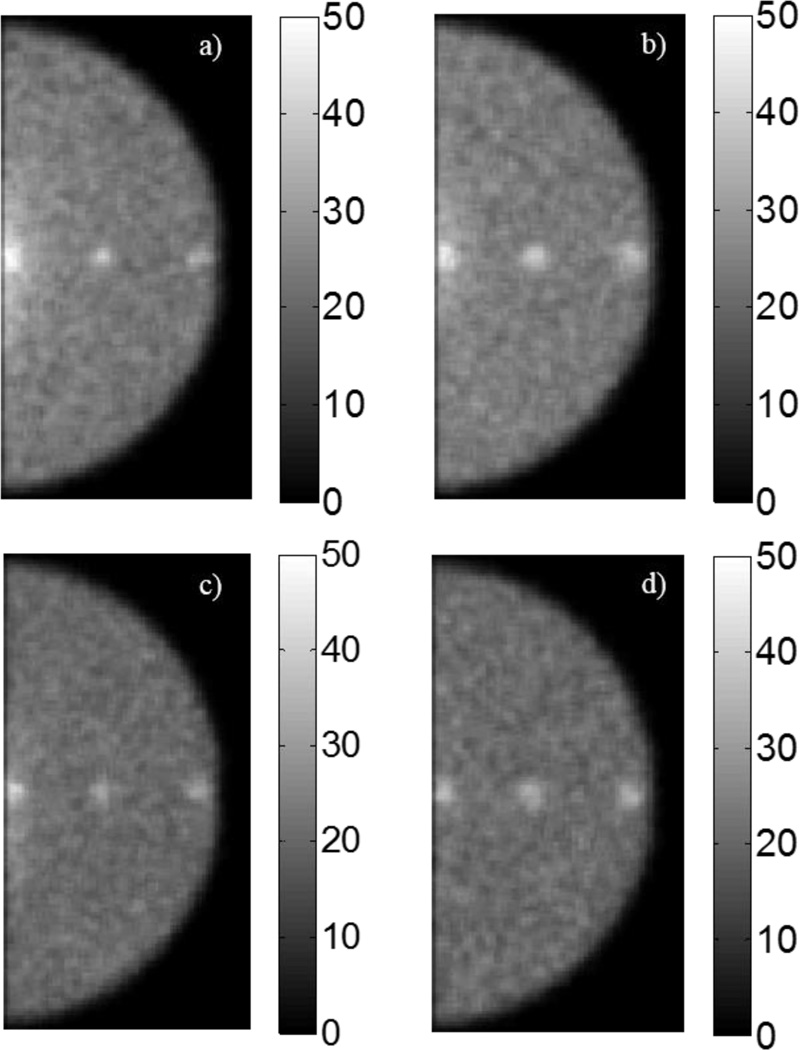
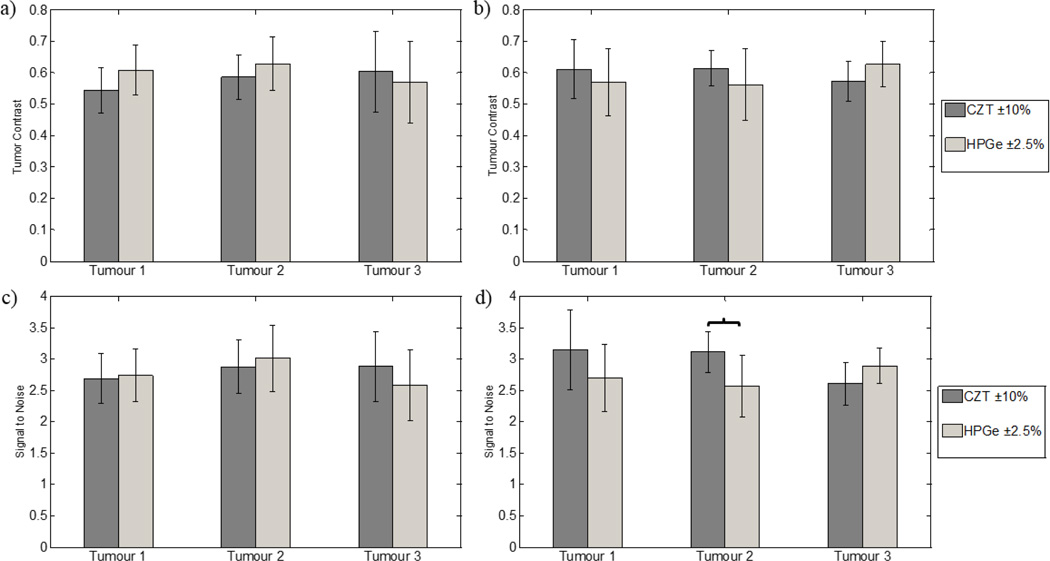
With a gain of ~25% for HPGe images, the count-density of those images were reduced by 20% to equal those of the CZT images. Figure 11 shows images for CZT and HPGe with equal count densities and energy windows of ±10% and ±2.5%, respectively. All three tumours at both depths are visible in these images. Figure 12 displays the average contrast and SNR measurements for these detector and energy window pairings. Reducing the number of counts in HPGe images to match that of CZT images yields no statistical differences in contrast or SNR for 1-cm depth tumours. Only tumour 2 at a depth of 4 cm saw a statistically significant difference in SNR between CZT and HPGe (p = 0.02).
Figure 11.
CZT- and HPGe-acquired projections with equal count densities. (a) CZT ±10% with 1-cm depth tumours. (b) CZT ±10% with 4-cm depth tumours. (c) HPGe ±2.5% with 1-cm depth tumours. (d) HPGe ±2.5% with 4-cm depth tumours.
Figure 12.
Average contrast and signal-to-noise measurements for the equal count images in figure 11. (a), (c) correspond to the 1-cm depth tumours and (b), (d) correspond to the 4-cm depth tumours. Error bars represent one standard deviation from the mean. The brackets point to the detector/energy window combinations with significant differences, or p-values < 0.05. Equivalent performance between equal count CZT and HPGe images is observed for the 1-cm depth tumours. However, a significance difference (p=0.01) in SNR for tumour 2 at a depth of 4 cm is also observed.
4. Discussion
This study aimed to simulate a realistic HPGe camera for planar nuclear breast imaging based on the current intrinsic properties of the MI4 HPGe detector. As a basis for comparison, we benchmarked our simulations against an augmented CZT model based on the LumaGEM 3200S as cited in Hruska and O’Connor (2008). We were interested in comparing the differences in scatter contributions, image quality and sensitivity when the image geometry was kept constant, but the detector crystal was switched from CZT to HPGe. To evaluate realistic imaging systems, the majority of intrinsic properties for the HPGe and CZT models were kept consistent with the MI4 (HPGe) and LumaGEM (CZT) systems, including energy resolution, detector thickness, effective pixel sizes, and ISR. We sought to investigate whether the superb energy resolution of HPGe would translate into improved breast imaging performance.
Physical measurements of the intrinsic spatial and energy resolutions made on the MI4 HPGe detector were used as inputs for the HPGe breast camera model. The HPGe camera model was validated using total system resolution measurements across several distances in accordance with NEMA standards. Energy resolution measurements were comparable to previous HPGe detectors, however, ISR in the x and y dimensions were different. One explanation for the difference in X and Y ISR is the difference in the electronic noise between the p- and n-sides of the particular detector used in the measurements. In addition to varying ISR, the total system resolution in the y-dimension was initially underestimated. We believe that the underestimation in y-axis spatial resolution is due to some additional blurring that is not accounted for by summing ISR and collimator resolution in quadrature.
One explanation for this may be the alignment of the hexagonal-hole collimator to the HPGe detector. The angle between the square pixels of the MI4 and the collimator’s hexagonal-holes may result in preferential blurring in one dimension. One major limitation of this study is that a proper experimental validation of the CZT model could not be performed because we do not possess a CZT camera. Also, we do not possess the collimator from the base CZT system, so the HPGe model validation was completed using an available LEHR collimator. The sensitivity of this collimator is 23% lower than the one used in Hruska and O’Connor. To achieve the same clinical count density as images in Hruska and O’Connor (2008), the total number of simulated photons is increased by a factor of 1.29, akin to extending the imaging time from 10 minutes to 12.9 minutes. Additionally, without a CZT detector, an empiric tailing model was generated using an experimental CZT spectrum published in Hruska and O’Connor (2008). The method used for determining the distribution of tailed events was done following Hruska and O’Connor (2008) as well. Applying their tailing method resulted in similar quality energy spectra, particularly around the 140-keV photopeak and for the primary count spectral line.
Another change from the previous study was our calculation of contrast and SNR. Differences in measured tumour contrast arise from our use of the average tumour signal in a 3×3 ROI instead of the maximum tumour signal. The average tumour signal over an ROI was used to calculate tumour contrast to reduce the influence of Poisson noise on the tumour contrast. In addition, the tumour contrast and SNR results presented here represent the average over ten independent simulations conducted for each type of detector. Even with these slight differences, our maximum tumour contrast averaged over the ten simulations is within one standard deviation of the maximum tumour contrast reported in Hruska and O’Connor (2008) (data not shown). Some agreement between this study and Hruska and O’Connor (2008) is observed in the relative sensitivities when applying ±10% and −5%/10% energy windows, but slight differences are seen in scatter and torso fractions. This could be due to the slight changes in the imaging geometry, including the truncated torso and liver regions.
Due to the good charge transport properties of HPGe, there is no low-energy tailing of primary events exhibited in its energy spectra. The ER of HPGe also provides sharper photopeaks than that of CZT. This enables the use of narrower energy windows, which helps minimize the contribution from scatter events originating from the breast and the torso. In both CZT and HPGe, we see some first-order scatter events fall within the energy windows and contribute to the images. The vast majority of higher-order scatter events lose enough energy to fall outside the energy windows for both detectors, but some second-order scatter contribute to the generated images. We also observe that out-of-field contributions from the heart, liver, and torso fall within the energy windows utilized for both CZT and HPGe. Many of these events are due to gamma-ray penetration through the lead shielding of the detector, but quantitative results show that both the scatter and torso fractions are lower for HPGe than CZT.
CZT-generated images with a ±10% energy window contain regions of high torso background levels along the chest wall. This region extends around the tumour closest to the torso, decreasing its visibility and lowering contrast. Applying a −5%/10% energy window to the CZT spectrum suppresses this torso background and provides a statistically significant gain in contrast (p=0.01) for the 1-cm depth tumour 1 closest to the torso. In addition, applying the asymmetric energy window provides a statistically significant gain in tumour 2 contrast for deep-seated tumours compared to HPGe. The HPGe images also exhibit the torso background, but with a lower intensity than the CZT image with the ±10% energy window. The HPGe images with both energy windows yield statistically similar tumour contrast and SNR values to CZT images when tumours are in closer proximity to the camera. However, the image quality of deep-seated tumours yields contradictory results with HPGe-acquired images showing enhanced SNR for tumour 3 over CZT images. One reason for this can be contributed to the superb ER of HPGe that allows for a lower scatter content farthest from the chest wall. This lower scatter content, as compared to the high scatter and torso contribution near the chest wall, corresponds to lower image noise, which would enhance SNR. This finding agrees with some literature related to the scatter distribution of nuclear breast images and the importance of energy resolution (Pani et al 1998, Williams et al 2000, Williams et al 2003). However, with the enhancement only observed with deep-seated tumours, a case for ER offering little to no benefit to breast imaging can also be made (Hruska and O’Connor 2006, Hruska and O’Connor 2008).
One reason NBI techniques are currently not proposed for breast screening is the radiation dose to the body, which can be 5–10 times greater than standard digital mammography (Hendrick 2010). In an effort to lower the dose to the patient, methods are being developed to increase sensitivity while maintaining resolution and tumour contrast so as to reduce injected radioactivity without the loss of image quality (O’Connor et al 2010). For this reason, the metrics for performance used in this and other similar studies have been relative sensitivity, tumour contrast, and SNR (Garibaldi et al 2006, Judy et al 2010, Hruska and O’Connor 2006, Hruska and O’Connor 2008). Clinical dedicated breast imaging protocols measuring 99mTc-sestamibi distributions with pixilated CZT modules use a ±10% energy window, making it the basis for our comparisons to HPGe with various energy windows (Hruska and O’Connor 2006, Hruska and O’Connor 2008). When lowering the count density of HPGe images by 20% to match that of CZT, equivalent image quality was observed for the majority of cases. Only tumour 2 at a depth of 4 cm exhibits a statistical difference (p = 0.01) between CZT and HPGe. This implies that a count reduction of 20% for HPGe when imaging centralised tumours far from the camera may be too great to maintain equivalent image quality to CZT. In the future, a more thorough simulation study investigating the minimal injected activity for clinical breast imaging with HPGe cameras will be performed.
One result of these simulations was that the HPGe system did not demonstrate significant gains in lesion SNR, even with an approximate 50% increase in sensitivity compared to the CZT system with the −5%/+10% energy window. One reason for this outcome may be due to counting statistics and the number of independent simulations conducted. From Poisson statistics, lesion SNR would be expected to increase as the square root of the count sensitivity. Hence, on average, 20% and 50% increases in sensitivity correspond to expected ~10% and 22% increases in SNR, respectively. However, there exists large variations in a single measurement of tumour contrast and SNR. For a single detector and energy window combination, we observed SNR values ranging between 2 and 4. This leads to large error bars on the average tumour contrast and SNR measurements, which diminishes the statistical significance of differences between the image quality metrics for CZT and HPGe. For this reason, there were very few significant gains observed in lesion SNR, even with the higher count sensitivities in HPGe. It is possible that more simulation trials could shrink the error bars on the average contrast and SNR measurements, but these results still offer some insight into the relative performance of HPGe and CZT cameras.
Overall, the HPGe system offers comparable tumour contrast and SNR to the CZT system, but with increased relative sensitivity and less contribution from scattered photons and torso background. It should be noted that the relative sensitivity gains observed in HPGe over CZT primarily reflect the event-by-event tailing model. Although the tailing model used here was based on published data, energy loss due to tailing varies with the CZT module properties, thus the relative sensitivity gains quoted here are not absolute. However, we believe that the superb charge-carrier transport properties of HPGe does provide relative sensitivity gains, whereas any tailing present in CZT reduces its sensitivity by removing primary events from the applied energy window. With these sensitivity gains, a reduction in the injected dose of radioactivity could be possible with HPGe cameras without sacrificing image quality. This is reflected in the statistically similar image quality between CZT and HPGe images after lowering HPGe count density, akin to reducing the effective radiation dose to the subject and acquiring for the same amount of time. The superior ER of 1% at 140 keV in HPGe enables us to utilize tighter energy windows around a higher quality photopeak, which better delineates primary events from scatter events and provides better suppression of background from the torso. Thus, HPGe detectors and parallel-hole collimators may offer some benefit for whole breast imaging, even without significant gains in image quality.
Future work in evaluating alternative parallel-hole collimation with HPGe may permit further radiation dose reductions with equivalent image quality. It has been shown that utilising parallel square-hole collimation comprised of tungsten and registered to the detector elements provides the best spatial resolution-sensitivity tradeoff for CZT systems and produces sensitivity gains between a factor of 1.5 and 3 (Weinmann et al 2009). Our initial study for improving the collimator design with HPGe detector by minimising penetration artifacts yielded a collimator with sensitivity gains of a factor of 1.83 over the collimator used in the present study (Campbell and Peterson 2011). We anticipate that applying a registered, tungsten collimator to HPGe detectors may offer further improvements in performance for HPGe systems. Furthermore, if the HPGe models continue to offer improvements with optimized collimation, then fabricating and manufacturing human-sized HPGe detectors may become a worthwhile pursuit. There are a number of challenges for growing and fabricating an HPGe detector for clinical imaging. The necessity for the vacuum space for cooling, shielding components around the edge, and other technical challenges are drawbacks that could negatively affect imaging performance, especially along the edge and close to the chest wall. These position-sensitive Germanium detectors are an emerging technology still under development, but substantial work has already been accomplished to make these devices possible, including advancements in cryogenics and amorphous-semiconductor contacts.
5. Conclusions
In this work, we conducted simulations to investigate the potential performance of a breast-specific imaging system using 5-mm thick CZT in comparison to the same system with 10-mm-thick HPGe. For equivalent activity imaged, HPGe provides better relative sensitivity and similar tumour contrast and SNR while better suppressing small-angle scatter events and background from the torso. HPGe may offer further advantages when employing alternative collimation schemes that open the FOV to look deeper into the chest wall, where small-angle scattering of photons from the torso may be more problematic. Our future endeavors will include conducting simulations of such alternative collimation schemes to assess their value in NBI. We also plan to explore alternative acquisition techniques that utilize the DOI estimation for limited-angle tomographic imaging.
Acknowledgements
This work was conducted in part using the resources of the Advanced Computing Center for Research and Education at Vanderbilt University, Nashville, TN. We would like to thank Dr. Benjamin McDonald for his assistance with MCNP5 and the simulation analysis. We would also like to thank the Ionizing Imaging group at the VUIIS, Dr. Lindsay Johnson, Dr. Sepideh Shokouhi, Dr. M. Noor Tantawy, Oleg Ochinnikov, and Rose Perea, PHDs Co. and Dilon Technologies for their support and assistance through this work. This work was supported by NIH/NIBIB R44EB15889, NIH/NCI R25CA136440, and the Southern Region Education Board.
References
- Anger HO. Radioisotope Cameras in Instrumentation in Nuclear Medicine. Vol. 1. New York: Academic; 1967. [Google Scholar]
- Barrett H, Eskin J, Barber H. Charge transport in arrays of semiconductor gamma-ray detectors. Phys. Rev. Lett. 1995;75:156–159. doi: 10.1103/PhysRevLett.75.156. [DOI] [PubMed] [Google Scholar]
- Brown FB, Barrett R, Booth T, Bull J, Cox L, Forster R, Goorley T, Mosteller R, Post S, Prael R, et al. MCNP version 5. Trans. Am. Nucl. Soc. 2002;87:4. [Google Scholar]
- Burks M, Jordan E, Hull E, Mihailescu L, Vetter K. Nuclear Science Symposium Conference Record, 2004 IEEE. Vol. 2. IEEE; 2004. Signal interpolation in germanium detectors for improved 3-d position resolution; pp. 1114–1118. [Google Scholar]
- Campbell DL, Peterson TE. Evaluating collimator designs for nuclear breast imaging with high-purity germanium detectors; Nuclear Science Symposium and Medical Imaging Conference (NSS/MIC), 2011 IEEE; 2011. pp. 2743–2748. [Google Scholar]
- Delmon-Moingeon LI, Piwnica-Worms D, Van den Abbeele AD, Holman BL, Davison A, Jones AG. Uptake of the cation hexakis(2-methoxyisobutylisonitrile)-technetium-99m by human carcinoma cell lines in vitro. Cancer Res. 1990;50:2198–2202. [PubMed] [Google Scholar]
- Garibaldi F, Cisbani E, Colilli S, Cusanno F, Fratoni R, Giuliani F, Gricia M, Lucentini M, Lo Meo S, Magliozzi M, et al. Molecular imaging: high-resolution detectors for early diagnosis and therapy monitoring of breast cancer. Nucl. Instr. & Meth. Phys. Rese. A. 2006;569:286–290. [Google Scholar]
- Fujita H, Doi K, Giger ML. Investigation of basic imaging properties in digital radiography. 6. MTFs of II-TV digital imaging systems. Med. Phys. 1985;12:713–720. doi: 10.1118/1.595653. [DOI] [PubMed] [Google Scholar]
- Hendrick RE. Radiation doses and cancer risks from breast imaging studies. Radiology. 2010;257:246–253. doi: 10.1148/radiol.10100570. [DOI] [PubMed] [Google Scholar]
- Hruska CB, O’Connor MK. CZT detectors: How important is energy resolution for nuclear breast imaging? Physica Medica. 2006;21:72–75. doi: 10.1016/S1120-1797(06)80029-3. [DOI] [PubMed] [Google Scholar]
- Hruska CB, O’Connor MK. A Monte Carlo model for energy spectra analysis in dedicated nuclear breast imaging. IEEE Trans. Nucl. Sci. 2008;55:491–500. [Google Scholar]
- Johnson LC, Campbell DL, Hull EL, Peterson TE. Characterization of a high-purity germanium detector for small-animal SPECT. Phys. Med. Biol. 2011;56:5877. doi: 10.1088/0031-9155/56/18/007. [DOI] [PMC free article] [PubMed] [Google Scholar]
- Johnson LC, Campbell DL, Ovchinnikov OS, Peterson TE. Performance characterization of a high-purity germanium detector for small-animal SPECT; Nuclear Science Symposium and Medical Imaging Conference (NSS/MIC), 2011 IEEE; 2011. pp. 607–612. [Google Scholar]
- Judy PG, Gong Z, Dinion NL, Welch BL, Saviour TS, Kieper D, Majewski S, McKisson J, Kross B, Proffitt J, et al. Analysis of image combination methods for conjugate breast scintigraphy. IEEE Trans. Nucl. Sci. 2010;57:1146–1154. [Google Scholar]
- Mueller B, O’Connor MK, Blevis I, Rhodes DJ, Smith R, Collins DA, Phillips SW. Evaluation of a small cadmium zinc telluride detector for scintimammography. J. Nucl. Med. 2003;44:602–609. [PubMed] [Google Scholar]
- NEMA. NEMA standards publication NU 1–2007: Performance measurements of gamma cameras. Rosslyn, VA: National Electrical Manufacturers Association; 2007. [Google Scholar]
- O’Connor MK, Hruska CB, Weinmann A, Manduca A, Rhodes DJ. Proc. SPIE. International Society for Optics and Photonics 780603; 2010. Development of radiation dose reduction techniques for cadmium zinc telluride detectors in molecular breast imaging. [Google Scholar]
- Pani R, De Vincentis G, Scopinaro F, Pellegrini R, Soluri A, Weinberg IN, Pergola A, Scafe R, Trotta G. Dedicated gamma camera for single photon emission mammography (SPEM) IEEE Trans Nucl. Sci. 1998;45:3127–3133. [Google Scholar]
- Pani R, Pellegrini R, Ciniti MN, Bennati P, Betti M, Casali V, Schillaci O, Mattoli M, Orsolini Cencelli V, Navarria F, et al. Recent advances and future perspectives of gamma imagers for scintimammography. Nucl. Instr. & Meth. Phys. Rese. A. 2006;569:296–300. [Google Scholar]
- Robert C, Montémont G, Rebuffel V, Verger L, Buvat I. Optimization of a parallel hole collimator/CdZnTe gamma-camera architecture for scintimammography. Med. Phys. 2011;38:1806. doi: 10.1118/1.3560423. [DOI] [PubMed] [Google Scholar]
- Rosenberg RD, Hunt WC, Williamson MR, Gilliland FD, Wiest PW, Kelsey CA, Key CR, Linver MN. Effects of age, breast density, ethnicity, and estrogen replacement therapy on screening mammographic sensitivity and cancer stage at diagnosis: review of 183,134 screening mammograms in Albuquerque, New Mexico. Radiology. 1998;209:511–518. doi: 10.1148/radiology.209.2.9807581. [DOI] [PubMed] [Google Scholar]
- Tornai MP, Brzymialkiewicz CN, Cutler SJ, Madhav P. Comparison of scintimammography and dedicated emission mammotomography. Nuclear Science Symposium Conference Record, 2004 IEEE. 2004;5:2818–2822. [Google Scholar]
- Wagenaar DJ. CdTe and CdZnTe semiconductor detectors for nuclear medicine imaging. Elsevier; 2004. [Google Scholar]
- Weinmann AL, Hruska CB, O’Connor MK. Design of optimal collimation for dedicated molecular breast imaging systems. Med. Phys. 2009;36:845–856. doi: 10.1118/1.3077119. [DOI] [PMC free article] [PubMed] [Google Scholar]
- Williams MB, Goode AR, Galbis-Reig V, Majewski S, Weisenberger AG, Wojcik R. Performance of a PSPMT based detector for scintimammography. Phys. Med. Biol. 2000;45:781–800. doi: 10.1088/0031-9155/45/3/315. [DOI] [PubMed] [Google Scholar]
- Williams MB, Narayanan D, More MJ, Goodale PJ, Majewski S, Kieper DA. Analysis of position-dependent compton scatter in scintimammography with mild compression. IEEE Trans. Nucl. Sci. 2003;50:1643–1649. [Google Scholar]


