Abstract
‘Blue Carbon’, which is carbon captured by marine living organisms, has recently been highlighted as a new option for climate change mitigation initiatives. In particular, coastal ecosystems have been recognized as significant carbon stocks because of their high burial rates and long-term sequestration of carbon. However, the direct contribution of Blue Carbon to the uptake of atmospheric CO2 through air-sea gas exchange remains unclear. We performed in situ measurements of carbon flows, including air-sea CO2 fluxes, dissolved inorganic carbon changes, net ecosystem production, and carbon burial rates in the boreal (Furen), temperate (Kurihama), and subtropical (Fukido) seagrass meadows of Japan from 2010 to 2013. In particular, the air-sea CO2 flux was measured using three methods: the bulk formula method, the floating chamber method, and the eddy covariance method. Our empirical results show that submerged autotrophic vegetation in shallow coastal waters can be functionally a sink for atmospheric CO2. This finding is contrary to the conventional perception that most near-shore ecosystems are sources of atmospheric CO2. The key factor determining whether or not coastal ecosystems directly decrease the concentration of atmospheric CO2 may be net ecosystem production. This study thus identifies a new ecosystem function of coastal vegetated systems; they are direct sinks of atmospheric CO2.
Keywords: air–water CO2 flux, blue carbon, carbon cycles, climate change, net ecosystem production, seagrasses
Introduction
Identifying the locations and mechanisms responsible for changing global atmospheric CO2 is still a critical challenge for predicting future interactions between the carbon cycle and climate. The ocean has recently been identified as an important stock of ‘Blue Carbon’, which is carbon captured by marine living organisms (Nellemann et al., 2009). The Blue Carbon that accumulates in sediments can be separated from the global atmosphere for millennia, whereas the carbon sequestered in terrestrial ecosystems is separated for only several dozen years (Mateo et al., 1997; McLeod et al., 2011). Some studies have estimated that the rate of carbon accumulation is higher in coastal sediments (238 Tg C yr−1) than that in open ocean sediments (6 Tg C yr−1) (Nellemann et al., 2009). However, unlike sequestration in terrestrial ecosystems, coastal carbon burial does not lead directly to an uptake of atmospheric CO2. This is because (i) the water column separates the atmosphere from benthic systems (thus, for example, air-sea CO2 gas exchange is affected by carbon input from incoming waters, buffer effect, and the residence time of the water column), and (ii) buried sedimentary carbon is composed of allochthonous sources in addition to autochthonous sources (Gazeau et al., 2005; Borges et al., 2006; Fourqurean et al., 2012).
Rigorous evidence for the uptake of atmospheric CO2 and its quantification are required if the assessment of Blue Carbon is to be a valid measure of climate change. However, the extent of ‘on-site’ uptake of atmospheric CO2 by coastal ecosystems through direct air-sea CO2 gas exchange remains unclear. The current perception is that the direct relationship between Blue Carbon and atmospheric CO2 uptake varies among geographical regions. Open oceans and continental shelves have functioned as net sinks of atmospheric CO2 on geological timescales (Tsunogai et al., 1999; Takahashi et al., 2009). This role is evidenced by the fact that high nutrient concentrations and the increases in atmospheric CO2 since the industrial revolution have led to high rates of primary production on continental shelves (Tsunogai et al., 1999; Chen & Borges., 2009; Takahashi et al., 2009). The dominant air-sea CO2 gas exchange is, therefore, an influx into the seawater that balances the fugacity of CO2 (fCO2) and dissolved inorganic carbon (DIC) against the excess of primary production over respiration. In contrast, estuarine waters are net sources of CO2 to the overlying atmosphere because of the predominance of CO2 efflux from the surface seawater, a consequence mainly of the input of DIC and organic carbon from land and the excess of mineralization and respiration over primary production (Raymond & Cole, 2001; Borges et al., 2004, 2005; Jiang et al., 2008; Laruelle et al., 2010; Cai, 2011; Chen et al., 2013; Regnier et al., 2013). Shallow near-shore waters have also been shown to be sources of CO2 to the atmosphere; this finding was based on the measurements of air-sea CO2 gas exchange adjacent to mangroves and salt marshes (Borges et al., 2005; Bouillon et al., 2007). However, little is yet known about the air-sea CO2 gas exchange and its determinants in shallow coastal waters with submerged aquatic vegetation (SAV) such as seagrass and seaweed systems (Smith, 1981; Frankignoulle, 1988; Gazeau et al., 2005), where the vegetation directly takes up DIC in the water column. This lack of knowledge reflects the difficulties of comprehensive measurements of the inherently complex and dynamic carbon flows and stocks in aquatic systems (Frankignoulle, 1988; Kayanne et al., 1995; Borges et al., 2005; Barrón et al., 2006; Tokoro et al., 2008; Koné et al., 2009). For instance, the relationship between biogeochemical processes (primary production, respiration, calcification, and mineral dissolution) and air-sea CO2 exchange in aquatic systems is non-linear and strongly affected by various chemical and physical factors such as the buffer effect of the carbonate system (Weiss, 1974), residence time (Gazeau et al., 2005), and turbulence at the water surface (Wanninkhof, 1992).
In this study, we investigated carbon flows, including air-sea CO2 fluxes, changes of DIC, net ecosystem production, and carbon burial rates in boreal, temperate, and subtropical seagrass meadows over different temporal and spatial scales. We then quantified the ecosystem function of direct CO2 uptake from the atmosphere by shallow coastal waters with SAV.
Materials and methods
Study sites
In situ measurements were conducted at boreal (Furen lagoon), temperate (Kurihama Bay), and subtropical (Fukido estuary) sites (Fig.1). Because seagrass meadows at these sites are located adjacent to river mouths, the effect of carbon inputs from land and community metabolism could be both observed and measured. In addition, the broad range of latitudes encompassed by this study made it possible to comprehensively analyse the effects of water temperature and light, which regulate almost all of the carbon flows, including those associated with community metabolism and the carbonate system.
Figure 1.
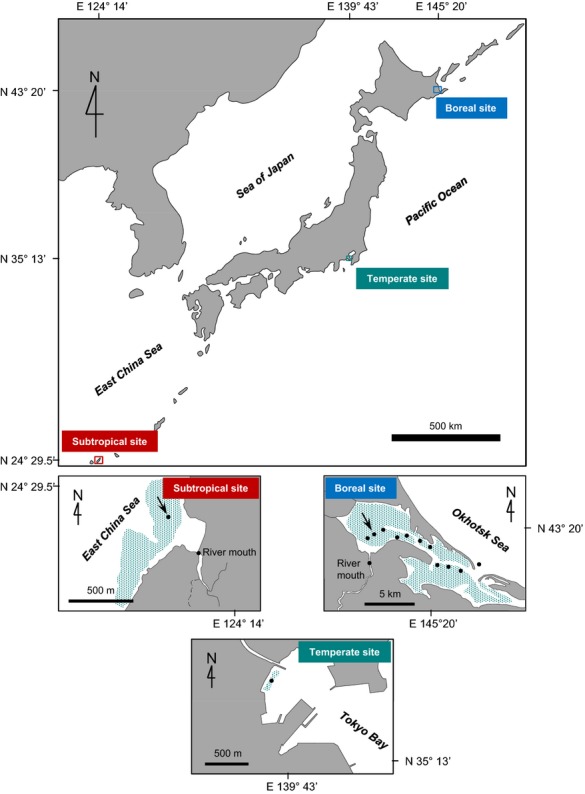
Location of study sites. The distribution of seagrass at each site is indicated by shading. The locations of water sampling sites are indicated by closed circles. Arrows indicate where air-sea CO2 fluxes were measured by the eddy covariance method. At the boreal site, we also performed a 48-h time series of discrete water sampling at the location indicated by the arrow.
Furen lagoon, Hokkaido, Japan (43°19′46.5˝N, 145°15′27.8˝E), is a semi-enclosed body of water with an area of 57.4 km2. Most of the lagoon is shallow (about 1 m deep), and much of the bottom (about 70%) is covered with seagrass meadows (dominant species: Zostera marina). The aboveground seagrass biomass ranges from 16 to 318 g dry weight (dw) m−2, according to a 2011 annual field survey. The chlorophyll a concentration, measured with an in situ fluorometer (Compact CLW; JFE Advantech, Nishinomiya, Japan), ranges from 2 to 7 μg l−1, according to August and November 2010 field surveys. The lagoon is brackish (salinity: 6–31) and is much affected by input from rivers, which flows through farmland where livestock is raised and fodder crops are grown. The nutrient levels range from 0.6 to 121 μmol N l−1 (DIN) and from 0.3 to 2.6 μmol P l−1 (DIP) (Montani et al., 2011).
Kurihama Bay, Tokyo, Japan (35°13′ 21.6˝N, 139°42′ 51.4˝E), is located at the mouth of Tokyo Bay. Seagrass meadows are found along the coastline at a water depth of about 3–4 m. According to a March 2010 field survey, the aboveground seagrass biomass is 38–98 g dw m−2 (dominant species: Z. marina), and chlorophyll a concentrations are 1–4 μg l−1. The inflowing Hirasaku River, which runs through urban areas, affects water quality (e.g. lowers salinity) during low tide (salinity: 29–33). The nutrient levels are 8–29 μg N l−1 (DIN) and 0.4–1 μg l−1 (DIP) according to field surveys from December 2012 to June 2013.
The Fukido estuary, Okinawa, Japan (24°29′ 22.1˝N, 124°13′40.5˝E), is located at the mouth of the Fukido River, which flows out from a mangrove forest. The estuary is more open to the sea than the other two sites. In a July 2011 field survey, the aboveground seagrass biomass was 32–88 g dw m−2 (dominant species: Cymodocea serrulata, Thalassia Hemprichii, and Enhalus acoroides), and phytoplankton chlorophyll a concentrations were 0.1–2 μg l−1. The salinity ranges from 29 to 33. The nutrient levels range from 0.5 to 2 μmol N l−1 (DIN) and from 0.01 to 0.03 μmol P l−1 (DIP) (Watanabe, 2004).
Air-sea CO2 flux
We determined the air-sea CO2 flux by three methods: the bulk formula method, the floating chamber method, and the eddy covariance method. We used three methods because each method has strengths and limitations with respect to technical difficulty, the spatial and temporal scale of interest, data accuracy and uncertainty, and costs.
Bulk formula method
The bulk formula method determines air-sea CO2 fluxes (F) by using the difference of fugacity between the air and the surface of the water in addition to the gas transfer velocity (k) determined from empirical relationships with the wind speed above the surface of the water (Wanninkhof, 1992; McGillis et al., 2001). The equation for the method is as follows:
| 1 |
where the CO2 solubility in water (S) is a function of water temperature and salinity (Weiss, 1974). The fugacity of CO2 in water (fCO2water) and that in air (fCO2air) were measured with a CO2 fugacity analyser through an equilibrator system (CO2-09, Kimoto electric) (Saito et al., 1995) or estimated using chemical equilibrium relationships and the total alkalinity (TA) and DIC of the water samples (Zeebe & Wolf-Gladrow, 2001). Water temperature and salinity were measured with a conductivity/temperature sensor (Compact-CT; JFE Advantech). The gas transfer velocity (k) is generally assumed to be determined by the physical condition of the water surface and has been empirically estimated by using the wind speed above the water surface. In this study, we used the following empirical equation to estimate k (Wanninkhof, 1992):
| 2 |
where U10 is the wind speed at a height of 10 m above the water surface. We determined U10 by assuming that there was a logarithmic relationship between wind speed, height above the water and the roughness of water surface (10−4 cm) (Kondo, 2000). We measured the wind speed at the height of a sonic anemometer (CSAT-3; Campbell Scientific, North Logan, UT, USA), which was deployed 2.5–4.5 m above the surface of the water. The Schmidt number (Sc) was determined from the water temperature and salinity near the water surface (Jähne et al., 1987).
The measurements were carried out on a research vessel. At the boreal site, continuous measurements were performed every hour for 2 days in August and November 2010. In addition, discrete measurements were performed from June to November 2011 (when the lagoon surface was not frozen) along a survey line from the river mouth to the mouth of the lagoon, which connects to the open ocean. The incoming water was also sampled in the river and in the open ocean. At the temperate site, the measurements were performed for 2 days and for 1 day during daylight hours in March 2010 and April 2013 respectively. At the subtropical site, the measurements were performed for 2 days during daylight hours in August 2011.
The bulk formula method has the advantage of relative ease from a technical standpoint, and it is the method most frequently and widely used. However, in most previous studies, the empirical relationship between the parameter k and wind speed has been determined from measurements made elsewhere, such as at open ocean or lake sites. Direct determination of k is recommended in coastal areas, where wind and current stresses on the water surface are likely to be different from the analogous stresses on open surfaces (Raymond & Cole, 2001; Borges et al., 2004; Tokoro et al., 2007, 2008).
Floating chamber method
In the floating chamber method, air-sea CO2 fluxes are determined from the change in CO2 concentration inside a chamber floating on the water surface (Frankignoulle, 1988; Borges et al., 2004; Vachon et al., 2010). The floating chamber used here was a rectangular polyvinyl chloride box (50 cm × 50 cm × 22 cm high, and weighing 17 kg) with polystyrene foam floats. The fCO2 analyser mentioned above was connected to the chamber by a Teflon tube for measurement of fCO2 inside the chamber. Details of this method are described elsewhere (Tokoro et al., 2007, 2008). The validity of the method has been quantitatively confirmed by a comparison of turbulence near the water surface inside and outside of the floating chamber (Tokoro et al., 2008; Vachon et al., 2010). The measurements were carried out on a research vessel in parallel with the bulk formula method measurements. Thus, the measurement duration and site were the same as for the bulk formula method, except for an annual discrete measurement at the boreal site in 2011 (the bulk formula method only).
The advantage of this method is that it provides a direct measurement of the flux. The disadvantage of the method is that under highly turbulent conditions the measurements are problematic because bubbles enter the chamber, or the chamber rolls over. In addition, the temporal and spatial ranges of the measurements are narrower than the corresponding ranges of the eddy covariance method.
Eddy covariance method
This method determines the air-sea CO2 flux by using the vertical motion of the atmosphere and atmospheric CO2 concentrations measured at a high frequency (10–20 Hz) to capture the micro-metrological behaviour of atmospheric eddy diffusion, which transports CO2 vertically.
The calculation of the air-sea CO2 flux (F) was implemented every 30 min by using the following equation:
| 3 |
where the coefficients F1 and F2 are correction terms based on the transfer functions that correct the frequency attenuation of the air-sea CO2 flux caused by the response time of the sensor, path-length averaging, sensor separation, signal processing, and flux-averaging time (Massman, 2000). The first term on the right-hand side of Eqn 3 is the product of F1 and the uncorrected air-sea CO2 flux calculated as the covariance of the CO2 density ρc and vertical wind speed w (the bar and the prime mark indicate the mean and the deviation from the mean respectively). The second and third terms are the Webb-Pearman-Leuning correction of latent heat and sensible heat respectively (Webb et al., 1980). The other symbols in Eqn 3 are as follows: ρd, dry air density; ρv, water vapour density; Ta, air temperature; and μ, ratio of molar weight of dry air to water vapour. The wind speed was corrected by using a double rotation to make the average vertical wind speed zero during the 30-min time interval (Lee et al., 2004). All the data were measured at 20 Hz and detrended using an exponential moving average (McMillen, 1988). The smoothing coefficient (= 1.7 × 10⁻³) was determined by using a cospectrum to maximize inclusion of low-frequency flux contributions and to minimize exclusion of time-variant fluctuations (not real turbulent fluctuation) (Lee et al., 2004).
The eddy covariance system was installed on a platform at both the boreal and subtropical sites. We used an open-path CO2 analyser (LI-7500A; LI-COR, Lincoln, NE, USA) and a 3-D sonic anemometer (CSAT-3, Campbell Scientific). The devices were deployed at a height of 2.5–5.5 m from the surface of the water, depending on the tide. The measurements at the boreal site were performed from July to August and during November 2010. The measurements at the subtropical site were performed from July to August 2011.
The advantage of the eddy covariance method is that it enables direct flux estimates to be made continuously and automatically over broad spatial and temporal ranges. The footprint (measurement area), which depends on several factors, including measurement height, wind speed, atmospheric stability, and the roughness of measurement site (10−4 cm) (Schuepp et al., 1990), ranges from several hundred square metres to several square kilometres on the windward side of the measurement site. Therefore, the method has been widely used to estimate terrestrial atmospheric CO2 fluxes (Lee et al., 2004). The method has also been used to estimate air-sea CO2 fluxes in the ocean and coastal seas (McGillis et al., 2001; Vesala et al., 2006; Kondo & Tsukamoto, 2007; Zemmelink et al., 2009; Huotari et al., 2011; Polsenaere et al., 2012) and to estimate sediment-water O2 fluxes (Berg et al., 2003; Kuwae et al., 2006). However, several studies have reported that results from the eddy covariance method are inconsistent with results from other methods, such as the bulk formula method (Kondo & Tsukamoto, 2007; Zemmelink et al., 2009). In addition, this method requires sufficient spatial uniformity within the study area. Data management with respect to several atmospheric conditions that affect the footprint of the measurement area (Schuepp et al., 1990), such as the wind direction and atmospheric stability, is therefore required for quality control. Moreover, this method is costly, not easy to deploy, and requires heavy data processing compared to the other methods.
Water sampling and data collection
Water samples for DIC measurement were collected in 250-ml Schott Duran bottles, which were poisoned with saturated mercuric chloride (200 μl per bottle) to prevent DIC changes due to biological activities (Dickson et al., 2007). DIC and TA were determined using a continuous-flow analyser (MDO-02, Kimoto electric, Osaka, Japan) (Kimoto et al., 2002; Watanabe et al., 2004) and a batch-sample analyser (ATT-05, Kimoto electric). The precision of the continuous-flow analyser and the batch-sample analyser were ± 2 and ± 4μmol kg−1-water for DIC and ± 3 and ± 3 μmol kg−1-water for TA respectively. The samples were collected during the time when the bulk formula measurements were made. However, the DIC and TA data at the subtropical site were not used because the relationships between salinity, DIC, and TA were inconsistent.
Net ecosystem production (NEP)
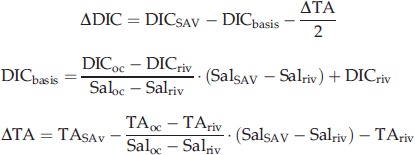
Net ecosystem production was estimated based on water depth and the temporal variation of ‘ΔDIC’, which is the difference between the observed DIC change and the value estimated from the mixing ratio of water and the DIC change due to calcification. The equations are as follows;
 |
4 |
where DICSAV, TASAV, and SalSAV are the DIC, TA and salinity, respectively, measured within a SAV system. DICbasis is the DIC estimated from the mixing ratio of river water and open ocean water. ΔTA is the TA change due to biogeochemical processes such as calcification and mineral dissolution. The parameters with the subscripts ‘oc’ (open ocean) and ‘riv’ (river) are those measured outside the boundary of the SAV system. Because DIC and TA are not affected by changes in pressure and water temperature, the coastal (brackish) water DIC and TA are completely determined from the mixing ratio of freshwater (from rivers) and seawater (from the open ocean) in the absence of ecosystem production, respiration/decomposition, and calcification. If these processes are taking place, the magnitude of the effects can be quantified from the difference between the measured DIC or TA and the DIC or TA estimated from the mixing ratio. In the case of the calcification process, the DIC change is expected to be half the TA change estimated from Eqn 4 (Zeebe & Wolf-Gladrow, 2001).
NEP was then calculated from ΔDIC as follows:
| 5 |
where n is the number of water samples that were collected every hour during the 48-h measurement period. The parameters Dw (n) and t(n) are the water depth and the time of collection of sample n respectively. Eqn 5 is based on the fact that the residence time of the water mass of the collected water samples was more than 1 h. The residence time was confirmed by in situ current measurements with several 2-D current velocimeters (Compact-EM, JFE Advantech).
To estimate how much light intensity affects NEP, the NEP data were fit to a photosynthesis–irradiance curve (Jassby & Platt, 1976):
| 6 |
where Pmax is the estimated maximum photosynthetic rate, R is the estimated respiration rate, α is the initial slope of the photosynthesis–irradiance curve, and I is the photosynthetic photon flux density (PPFD) in water. Pmax, R, and α were determined by least squares to give the best agreement between the calculated and measured NEP. PPFD was measured using a PPFD meter (MDS-MkV/L, JFE Advantech) located on the same platform with the eddy covariance instruments. ΔDIC was not determined at the subtropical site because of the short residence time of the water mass.
Carbon burial rate
Sediment cores (1 m) were collected from three locations at the boreal site with a PVC corer. To determine the bulk density, gamma ray attenuation was measured with a Multisensor Core Logger (MSCL-S; GeoTek Ltd., Northamptonshire, UK). Core samples consisted of 1-cm slices taken throughout the length of the core for geochemical and additional geophysical analyses. Each sample slice was analysed to determine water content, total organic carbon (TOC) content, and radiocarbon date (14C). Samples were prepared by drying the sediment (60 °C for 24 h) and measuring the net water loss (i.e. water content). The sediment was then acid washed to remove inorganic carbon. The TOC content was measured using an elemental analyser (Flash EA 1112, Thermo Electron, Bremen, Germany). The 14C dating was performed by accelerator mass spectrometry (AMS). Ages are reported in calibrated years before ‘present’ (BP), 1950 being the base year. ‘Present’ carbon burial rates were calculated from the TOC content of the top 1 cm of sediment; deeper sediment was affected by early diagenetic alteration. Burial rates were estimated from a linear average 14C age and the cumulative amount of TOC calculated from bulk density, water content, and surface TOC content.
Statistical analysis
Factors affecting the air-sea CO2 flux were statistically analysed using structured equation modelling (SEM). An a priori selection of candidate explanatory variables and model structure (direct and indirect relationships between the variables) were based on the principle of parsimony and scientific plausibility (Wang & Cai, 2004; de la Paz et al., 2007; Gupta et al., 2009; Hunt et al., 2011). We used the software package R (3.0.0) and the SEM library.
Results
Air-sea CO2 flux
Our results showed that the air-sea CO2 fluxes were variable and depended on the measurement timescale and season of the year. Monthly air-sea CO2 fluxes at both the boreal site (Furen lagoon) and the subtropical site (Fukido estuary) measured by the eddy covariance system were negative (i.e. from the atmosphere into the water) in the summer (Furen: −1.46 ± 0.38 μmol-C m−2 s−1; Fukido: −1.00 ± 0.11 μmol-C m−2 s−1; mean ± 95% confidence interval, the same hereafter; Fig.2a and c). We also found the air-sea CO2 fluxes to be negative when measured by alternative methods on diurnal timescales at the boreal site (bulk formula: −0.12 ± 0.09 μmol-C m−2 s−1; floating chamber: −0.07± 0.03 μmol-C m−2 s−1; Fig.3a) but not at the subtropical site (bulk formula: 0.12 ± 0.06 μmol-C m−2 s−1; floating chamber: 0.12 ± 0.05 μmol-C m−2 s−1; Fig.3c). In winter, the CO2 gas exchange flux was also negative at the temperate site (Kurihama Bay) (bulk formula: −2.90 × 10⁻² ± 1.55 × 10⁻²), but the boreal site was a source of atmospheric CO2 (eddy covariance: 0.42 ± 0.15 μmol-C m−2 s−1; bulk formula: 0.01 ± 0.01μmol-C m−2 s−1; floating chamber: 0.06 ± 0.10 μmol-C m−2 s−1,) (Fig.2b and Fig.3b). The estimated annual air-sea CO2 flux at the boreal site was also negative (bulk formula: −1.76 × 10⁻² ± 1.50 × 10² μmol-C m−2s−1; Fig.4), even though the winter flux was positive on a diurnal basis.
Figure 2.
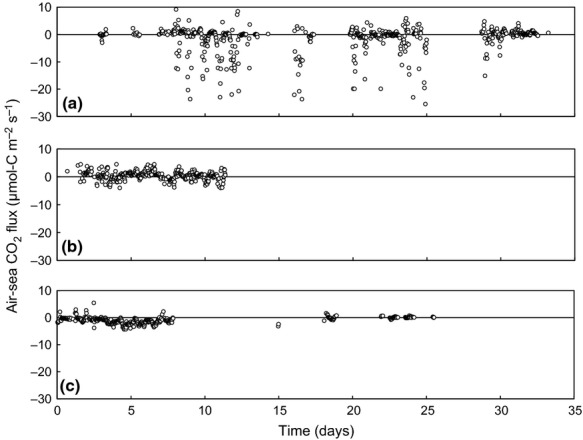
The air-sea CO2 flux measured by the eddy covariance method at the boreal site (Furen lagoon) in the summer (a) and winter (b) of 2010, and at the subtropical site (Fukido estuary) in the summer of 2011 (c).
Figure 3.
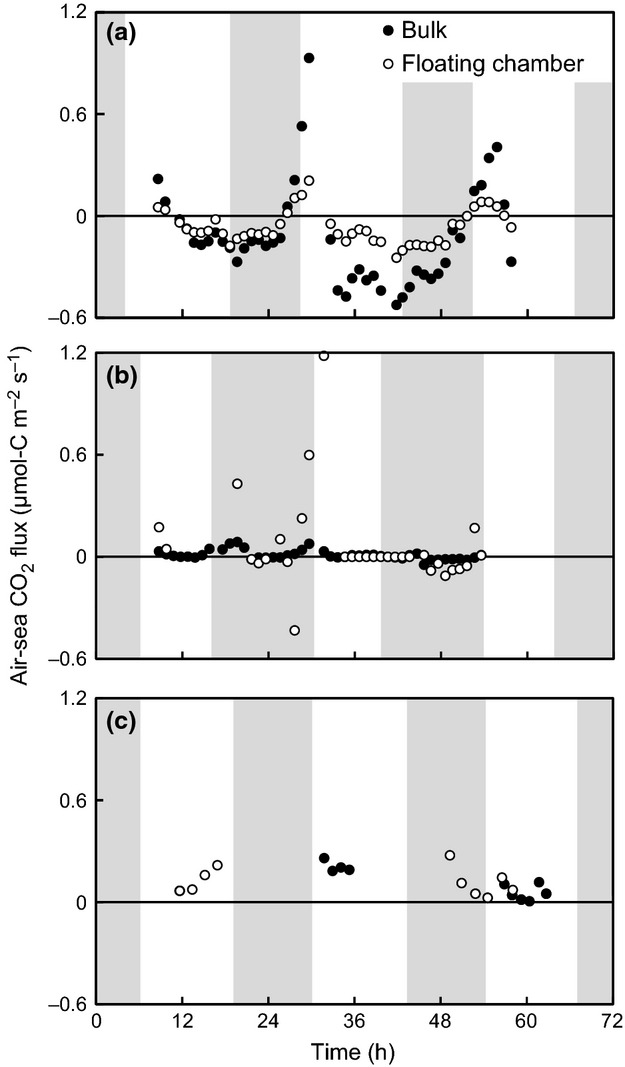
Diurnal air-sea CO2 fluxes measured by the bulk formula method and the floating chamber method. (a): Boreal site (Furen lagoon) in summer (bulk formula: −0.12 ± 0.09 μmol-C m−2 s−1; floating chamber: −0.07 ± 0.03 μmol-C m−2 s−1, mean ± 95% confidence interval), (b): Boreal site (Furen lagoon) in winter (bulk formula: 0.01 ± 0.01 μmol-C m−2 s−1; floating chamber: 0.06 ± 0.10 μmol-C m−2 s−1; mean ± 95% confidence interval), (c): Subtropical site (Fukido estuary) in summer (bulk formula: 0.12 ± 0.06 μmol-C m−2 s−1; floating chamber: 0.12 ± 0.05 μmol-C m−2 s−1, mean ± 95% confidence interval). Shading indicates the periods of darkness.
Figure 4.
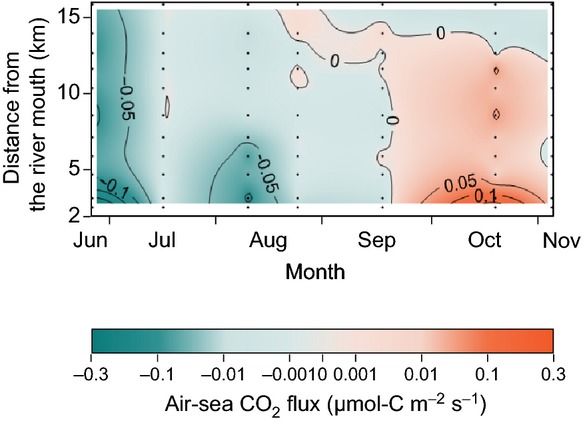
Annual air-sea CO2 flux at the boreal site determined by the bulk formula method. Units: μmol-C m−2 s−1. Negative fluxes (influx of CO2 into seawater) are indicated by blue, and positive fluxes by red. The annual average of the air-sea CO2 flux at the boreal site was negative (−1.76 × 10⁻² ±1.50 × 10⁻² μmol-C m−2 s−1), the indication being that the boreal site was a net sink of atmospheric CO2. The growing season for seagrasses is from May to August, and the decay season is from September to November at the site (unpublished data). The seawater was frozen from December to April at the site.
Factors affecting air-sea CO2 fluxes
There was a significant positive correlation between the air–water CO2 flux and the measured ΔDIC (P < 0.0001) (Fig.5). SEM showed that the variability of our air-sea CO2 flux results at the boreal and temperate sites (i.e. the extent to which and whether the system was a sink or source of overlying atmospheric CO2) was determined by geophysical and geographical factors such as wind speed, temperature, salinity, and TA, as well as indirectly by ΔDIC (the extent of biogeochemical processes such as ecosystem production and respiration; positive: heterotrophy; negative: autotrophy) (Fig.6).
Figure 5.
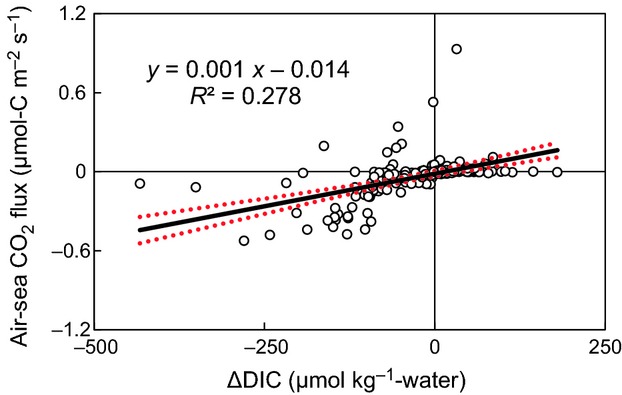
Air-sea CO2 flux vs ΔDIC (n = 170) at the boreal and temperate sites. ΔDIC is the difference between the observed DIC change and the value estimated from the mixing ratio and the DIC change due to calcification. The value of ΔDIC thus indicates the extent of biogeochemical processes such as ecosystem production and respiration (positive: heterotrophy; negative: autotrophy). The air-sea CO2 fluxes, including both the monthly and diurnal fluxes, were measured by using the bulk formula method. The 95% confidence limits to the regression line are indicated by the red dashed curves.
Figure 6.
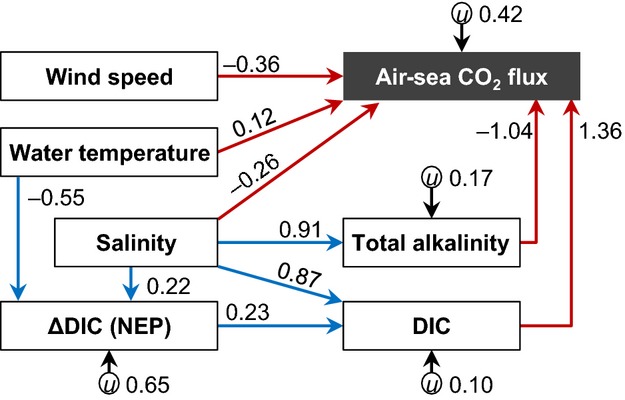
Result of the SEM analysis (n = 170) showing direct factors (red arrows) and indirect factors (blue arrows) affecting the air-sea CO2 flux at the boreal and temperate sites. The value of a coefficient indicates the relative influence of the path. All the path coefficients are statistically significant (P < 0.05). The parameter u represents unknown factors.
Net ecosystem production (NEP)
The fitting of the photosynthesis–irradiance curve to measured NEP was statistically significant (P < 0.0001) at the boreal site in summer; the estimated summer maximal NEP and respiration were 27.2 mmol-C m−2 h−1 (7.56 μmol-C m−2 s−1) and 21.3 mmol-C m−2 h−1 (5.92 μmol-C m−2 s−1) respectively (Fig.7a and 8a). In turn, in winter, the fitting of the photosynthesis–irradiance curve to measured NEP was not statistically significant (P > 0.05) at the boreal site (Fig.7b and 8b). At the boreal site in summer, the estimated compensation light intensities (NEP = 0) was 41.1 μmol-photons m−2 s−1, and the initial slopes of the photosynthesis–irradiance curves was 0.154 ([mmol-C m−2 h−1]/[μmol-photons m−2 s−1]).
Figure 7.
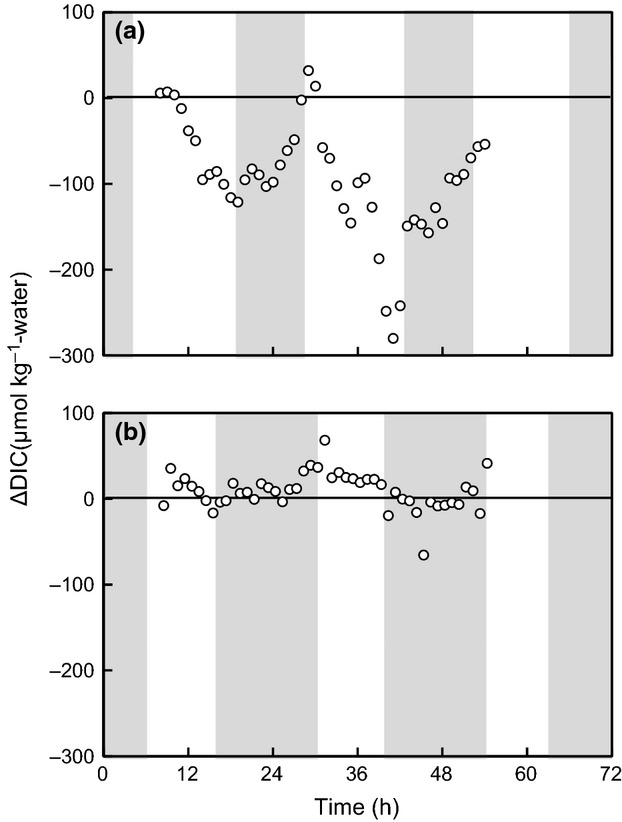
Diurnal ΔDIC changes at the boreal site in summer (a) and winter (b). Shading indicates the periods of darkness.
Figure 8.
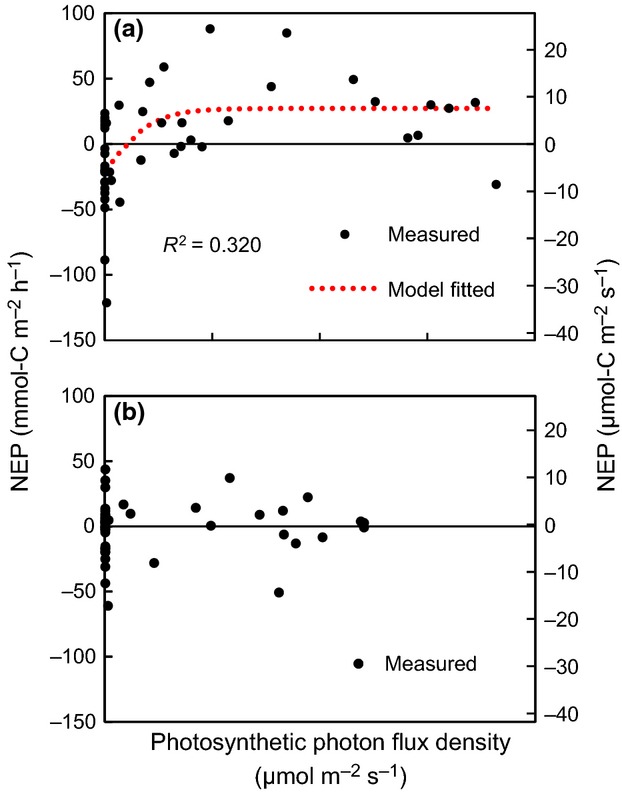
Net ecosystem production (NEP) at the boreal site in summer (a) and winter (b). The fitting of the photosynthesis–irradiance curve (red lines) to measured NEP was statistically significant (P < 0.0001) in summer but not in winter (P > 0.05).
Carbon burial rate
The sedimentation rate calculated from the linear average 14C age of the entire cores was 3.7 ± 1.8 mm yr−1 (n = 3). The mass accumulation rate was estimated to be 238 ± 107 g m−2 yr−1 (n = 3). The TOC content of the top 1 cm of sediment was 2.8 ± 1.4% (n = 9). The carbon burial rate estimated from the sedimentation rate and the TOC content was then estimated to be 458 ± 156 mmol-C m−2 yr−1 (0.348 ± 0.119 μmol-C m−2 s−1) (n = 9).
Discussion
This study revealed that SAV systems, which hitherto have been regarded as a source of atmospheric CO2, can function as a CO2 sink by directly absorbing and sequestering atmospheric CO2 (Fig.9). The direct sink of atmospheric CO2 in shallow coastal water with SAV is regulated by the ecosystem metabolism, carbon input from land, and associated mineralization and respiration.
Figure 9.
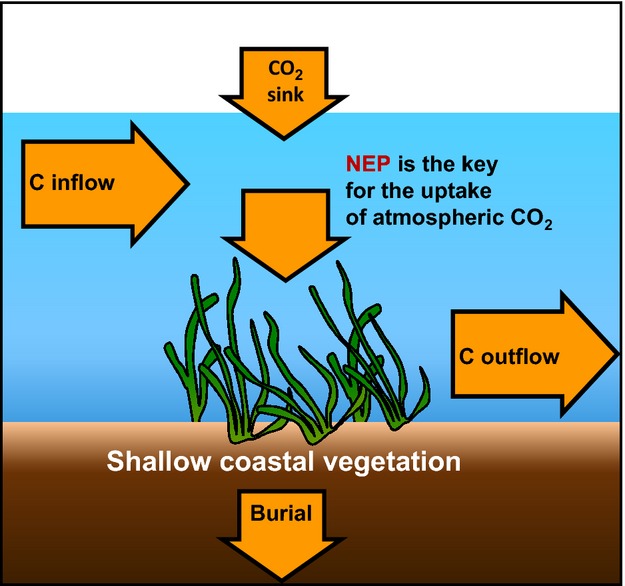
Summary of this study. The system of submerged aquatic vegetation (SAV) in shallow coastal waters was functionally a sink of overlying atmospheric CO2. The key factor determining whether coastal ecosystems directly take up atmospheric CO2 may be net ecosystem production.
We believe that the design of our measurements can provide a conservative estimate of a negative flux, i.e. the system functioned as a sink of atmospheric CO2, although we acknowledge that estimation of an annual flux based on discrete measurements is associated with considerable uncertainty (Fig.4). The conservative nature of the estimate is based on our finding that seawater fCO2 values were higher (lower influx of atmospheric CO2 into the seawater) from early morning to noon, when the samples were taken, than during the afternoon (Fig.10a). These diurnal changes are explained by the net autotrophy of the biological community from sunrise to sunset, the result being a continuous uptake of DIC and fCO2. Thus, our estimation of the net annual influx of atmospheric CO2 at the boreal site, based on data collected from early morning to noon (including cloudy days), is basically conservative, given the fact that the flux is zero or slightly negative during the freezing season (Nomura et al., 2010).
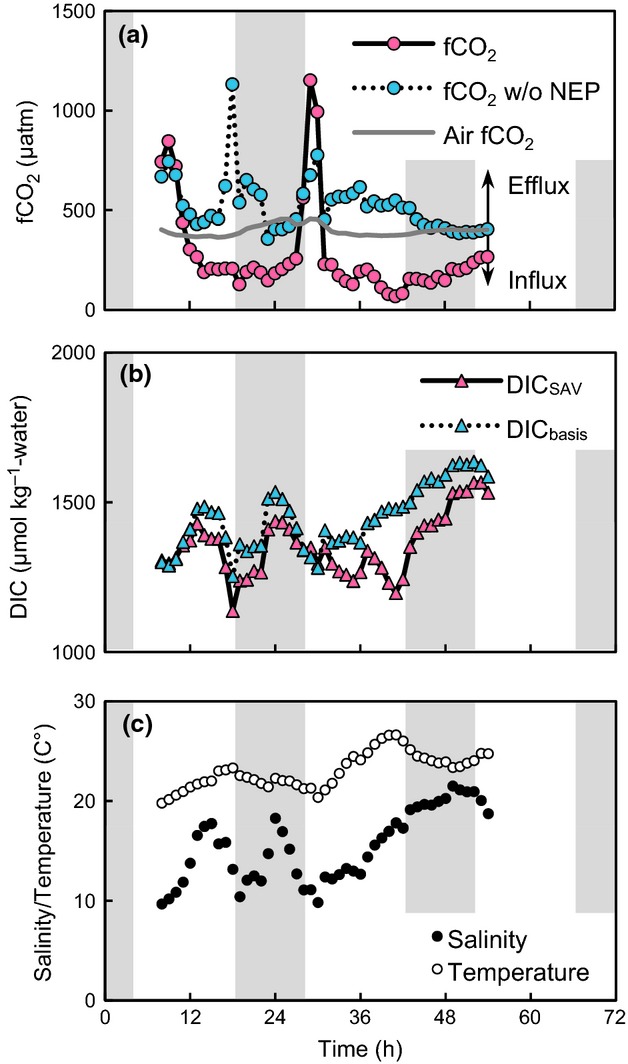
Representative data for the diurnal cycle of observed fCO2 in the water and estimated fCO2 in the water on the assumption that the NEP was zero (fCO2 without NEP) at the boreal site in the summer of 2010 (a). Parameters related to fCO2 in the water, such as DIC (DICSAV and DICbasis in Eqn 4) (b), water temperature, and salinity (c) are also presented. Shading indicates the period of darkness. The peaks of fCO2 in the water at about 10 and 30 h were caused by an intermittently high fCO2 water inflow from the river, as indicated by the low salinity and moderate DIC at the time.
The difference in the air-sea CO2 flux results between the three methods might stem from differences in the spatial scales of the measurements and differences in the exact positions of the measurement between the methods, in addition to differences associated with the advantages and limitations of each method (see Materials and methods). For example, the measurement area of the floating chamber method (<1 m2) was much smaller than that of the eddy covariance method (several hundred m2 to several km2). This difference in area can highlight the possible spatial dependence of the real fluxes. Moreover, the footprint of the eddy covariance measurement is, in reality, located on the windward side of the instrument because of the nature of the measurement, the result being that the position representative of the measured flux might be offset from the other methods. We feel that quantitative analysis of the differences in flux values between methods, a phenomenon that has also been shown elsewhere (e.g. Zemmelink et al., 2009), should be a focus of future studies.
The importance of NEP as a sink for atmospheric CO2 is supported by the significant correlation between the air-sea CO2 flux and ΔDIC (Fig.5). SEM also showed that the variability in the air-sea CO2 flux results was determined by geophysical and geographical factors as well as by ΔDIC (Fig.6). One of the major factors determining NEP is light intensity, which is implicitly included as an ‘unknown factor’ in the model. The diurnal changes of ΔDIC showed clear patterns that were related to light intensity (Figs7 and 8) as has also been indicated elsewhere (Gazeau et al., 2005).
Because the relative influence of DIC on ΔDIC was not high compared to the influence of other factors (Fig.6), it appears that NEP is less important than other factors in determining whether a body of water is a sink or source of CO2 to the overlying atmosphere. However, NEP did contribute very much to the influx of atmospheric CO2 by changing the balance of the two most important factors, TA and DIC, in the overall air-sea CO2 flux. Below we use a theoretical analysis to deduce the impact of NEP on the air-sea CO2 flux. Because DICbasis and TAbasis (see Eqn 4) were estimated from the mixing of only river water and open ocean water, the fCO2 values calculated on the basis of chemical equilibrium with DICbasis and TAbasis ignore NEP. This fCO2 without NEP (524 ± 10 μatm) at the boreal site in summer was higher than atmospheric fCO2 (397 ± 3 μatm) during most of the measurement period (Fig.10). The implication of this result is that the site would be a net source of atmospheric CO2 without NEP. Note that the net sink of atmospheric CO2 at our sites is not due to incoming river water because in all three of the systems studied, the fCO2 of the incoming river water (Furen: 3214 ± 2776 ppm; Kurihama: 642 ppm; Fukido: 910 ± 216 ppm) was higher than the fCO2 at the measurement sites.
The balance of carbon input, NEP, buffer effect, and the residence time of water masses should be a driver of fCO2 change in SAV systems and, consequently should determine whether the SAVs are a net sink or source of atmospheric CO2 (Gazeau et al., 2005). However, the capacity of SAVs to take up atmospheric CO2 may be underestimated in this study compared with the average capacity of seagrass meadows globally (Duarte et al., 2013). Even if one assumes that the annual average NEP at the boreal site equals the average of the estimated NEP in summer and winter (13 mmol-C m−2 day−1; Fig.8a, b), the annual NEP is smaller than the global average (Duarte et al., 2013) (Table1). Considering the previously discussed importance of NEP to the air-sea CO2 flux, the global average atmospheric CO2 influx may be higher than the average of our sites, given that the fact that the global average NEP is larger than the NEP of our sites. However, some sites have been reported to be atmospheric CO2 sources, even under autotrophic conditions (e.g. Gazeau et al., 2005), a consequence of the high carbon input and the short residence time of the water masses.
Table 1.
Comparison of various rates related to carbon flow in different shallow vegetated ecosystems (mean ± standard error: mmol-C m−2 day−1)
| GPP | R | NEP | GPP/R | Carbon burial | Air–water CO2 flux | |
|---|---|---|---|---|---|---|
| Global Mangroves | 476* | 426* | 50* | 1.12 | 32* | 51§ |
| Global Salt marshes | 820* | 459* | 361* | 1.79 | 34* | 59§ |
| Global Seagrasses | 225 ± 11† | 188 ± 10†,¶ | 27 ± 6† | 1.20 | 0.6–45.2‡ | ND |
| Boreal site (this study) | 560 (summer) | 509 (summer) | −21–52** | 0.60–1.10 | 0.80–2.43 | (−10–0.8: BF) |
| (−6–5: FC) | ||||||
| (−126–36: EC)†† | ||||||
| Temperate site (this study) | ND | ND | ND | ND | ND | (−3: BF)†† |
| Subtropical site (this study) | 230–570‡‡ | 181–570‡‡ | −123–49‡‡ | 0.73–1.27‡‡ | ND | (10: BF) |
| (10: FC) | ||||||
| (−86: EC)†† |
GPP, gross primary production; R, net ecosystem respiration; NEP, net ecosystem production; ND, not determined. GPP in this study was calculated as NEP + R, assuming that R was the same during the day and night (Duarte et al., 2010).
From Duarte et al. (2005).
Converted from oxygen-based units (Duarte et al., 2010) to carbon-based units, assuming that both photosynthetic quotients and respiratory quotients are equal to 1.
From Duarte et al. (2013).
From Borges et al. (2005).
As net community respiration, i.e. excluding abiotic processes (Duarte et al., 2010).
Diurnally averaged value of estimated NEP.
Averaged value of the bulk formula method (BF), the floating chamber method (FC), and the eddy covariance method (EC).
From Watanabe (2004).
Interannual measurement and numerical simulation of carbon flows in SAVs are required, given the inherently complex and dynamic environment of SAV systems (Champenois & Borges, 2012). For example, continuous measurements of incoming water carbonate systems and current velocities are needed to reduce uncertainty in the relationship between coastal carbon flows and SAVs.
We propose that the air-sea CO2 flux is an important carbon sequestration process that should be taken into consideration. To date, carbon burial rates have been considered to be the most important flow for the stock of carbon because some atmospheric carbon can be sequestered in sediments for millennia (Mateo et al., 1997; McLeod et al., 2011; Fourqurean et al., 2012). However, the air-sea CO2 flux is determined by the net carbon balance of the other fluxes: input, export, NEP, and burial (Fig.9). This implies that even if a certain SAV system is autotrophic (NEP >0) and evidences a high carbon burial rate, the system can function as a net source of atmospheric CO2 if the carbon input rate is high. Our findings indicate that coastal conservation and restoration can be a means of mitigating climate change. Furthermore, our results should add a new ecosystem service to coastal ecosystems as a direct atmospheric CO2 sink.
Acknowledgments
We thank T. Inoue, S. Shibanuma, H. Kimoto, K. Kinoshita, and S. Matsushita for help in measurements, and we thank A. V. Borges and an anonymous reviewer for helpful comments on the manuscript. Part of this study was performed as the cooperative research programme of the Center for Advanced Marine Core Research (CMCR), Kochi University (12B041).This study was supported by a Canon Foundation grant to T. K. and a Grant-in-Aid for Challenging Exploratory Research (No. 24656316) from the Japan Society for the Promotion of Science (JSPS) to T. K.
References
- Barrón C, Duarte CM, Frankignoulle F, Borges AV. Organic carbon metabolism and carbonate dynamics in a Mediterranean seagrass (Posidonia oceanica) meadow. Estuaries and Coasts. 2006;29:417–426. [Google Scholar]
- Berg P, Røy H, Janssen F, Meyer V, Jørgensen BB, Huettel M, De Beer D. Oxygen uptake by aquatic sediments measured with a novel non-invasive eddy-correlation technique. Marine Ecology Progress Series. 2003;261:75–83. [Google Scholar]
- Borges AV, Delille B, Schiettecatte LS, Gazeau F, Abril G, Frankignoulle M. Gas transfer velocities of CO2 in three European estuaries (Randers Fjord, Scheldt, and Thames) Limnology and Oceanography. 2004;49:1630–1641. [Google Scholar]
- Borges AV, Delille B, Frankignoulle M. Budgeting sinks and sources of CO2 in the coastal ocean: diversity of ecosystem counts. Geophysical Research Letters. 2005;32:L14601. [Google Scholar]
- Borges AV, Schiettecatte LS, Abril G, Delille B, Gazeau F. Carbon dioxide in European coastal waters. Coastal and Shelf Science. 2006;70:375–387. [Google Scholar]
- Bouillon S, Dehairs F, Velimirov B, Abril G, Borges AV. Dynamics of organic and inorganic carbon across contiguous mangrove and seagrass systems (Gazi Bay, Kenya) Journal of Geophysical Research G: Biogeosciences. 2007;112:G02018. [Google Scholar]
- Cai WJ. Estuarine and coastal ocean carbon paradox: CO2 sinks or sites of terrestrial carbon incineration? Annual Review of Marine Science. 2011;3:123–145. doi: 10.1146/annurev-marine-120709-142723. [DOI] [PubMed] [Google Scholar]
- Champenois W, Borges AV. Seasonal and inter-annual variation of community metabolism rates of a Posidonia oceanica seagrass meadow. Limnology and Oceanography. 2012;57:347–361. [Google Scholar]
- Chen CTA, Borges AV. Reconciling opposing views on carbon cycling in the coastal ocean: continental shelves as sinks and near-shore ecosystems as sources of atmospheric CO2. Deep-Sea Research II. 2009;56:578–590. [Google Scholar]
- Chen CTA, Huang TH, Chen YC, Bai Y, He X, Kang Y. Air-sea exchange of CO2 in world's coastal seas. Biogeoscience Discuss. 2013;10:5041–5105. [Google Scholar]
- Dickson AG, Sabine C, Christian JR. Guide to Best Practices for Ocean CO2 Measurements. Sidney: PICES Special Publication; 2007. [Google Scholar]
- Duarte CM, Middelburg JJ, Caraco N. Major role of marine vegetation on the oceanic carbon cycle. Biogeosciences. 2005;2:1–8. [Google Scholar]
- Duarte CM, Marbà N, Gacia E, Fourqurean JW, Beggins J, Barrón C, Apostolaki ET. Seagrass community metabolism: assessing the carbon sink capacity of seagrass meadows. Global Biogeochemical Cycles. 2010;24:GB4032. [Google Scholar]
- Duarte CM, Kennedy H, Marbà N, Hendriks I. Assessing the capacity of seagrass meadows for carbon burial: current limitations and future strategies. Ocean and Coastal Management. 2013;83:32–38. [Google Scholar]
- Fourqurean JW, Duarte CM, Kennedy H, et al. Seagrass ecosystems as a globally significant carbon stock. Nature Geoscience. 2012;5:505–509. [Google Scholar]
- Frankignoulle M. Field-measurements of air sea CO2 exchange. Limnology and Oceanography. 1988;33:313–322. [Google Scholar]
- Gazeau F, Duarte CM, Gattuso JP, et al. Whole-system metabolism and CO2 fluxes in a Mediterranean Bay dominated by seagrass beds (Palma Bay, NW Mediterranean) Biogeosciences. 2005;2:43–60. [Google Scholar]
- Gupta GVM, Thottathil SD, Balachandran KK, Madhu NV, Madeswaran P, Nair S. CO2 supersaturation and net heterotrophy in a tropical estuary (Cochin, India): influence of anthropogenic effect: carbon dynamics in tropical estuary. Ecosystems. 2009;12:1145–1157. [Google Scholar]
- Hunt CW, Salisbury JE, Vandemark D, McGillis W. Contrasting carbon dioxide inputs and exchange in three adjacent new England estuaries. Estuaries and Coasts. 2011;34:68–77. [Google Scholar]
- Huotari J, Ojala A, Peltomaa E, et al. Long-term direct CO2 flux measurements over a boreal lake: five years of eddy covariance data. Geophysical Research Letters. 2011;38:L18401. [Google Scholar]
- Jähne B, Heinz G, Dietrich W. Measurement of the diffusion-coefficients of sparingly soluble gases in water. Journal of Geophysical Research. C. Oceans. 1987;92:10767–10776. [Google Scholar]
- Jassby AD, Platt T. Mathematical formulation of the relationship between photosynthesis and light for phytoplankton. Limnology and Oceanography. 1976;21:540–547. [Google Scholar]
- Jiang LQ, Cai WJ, Wang Y. A comparative study of carbon dioxide degassing in river- and marine-dominated estuaries. Limnology and Oceanography. 2008;53:2603–2615. [Google Scholar]
- Kayanne H, Suzuki A, Saito H. Diurnal changes in the partial pressure of carbon dioxide in coral reef water. Science. 1995;269:214–216. doi: 10.1126/science.269.5221.214. [DOI] [PubMed] [Google Scholar]
- Kimoto H, Nozaki K, Kudo S, Kato K, Negishi A, Kayanne H. Achieving high time-resolution with a new flow-through type analyzer for total inorganic carbon in seawater. Analytical Sciences. 2002;18:247–253. doi: 10.2116/analsci.18.247. [DOI] [PubMed] [Google Scholar]
- Kondo J. Atmosphere Science near the Ground Surface. Tokyo: University of Tokyo Press; 2000. [Google Scholar]
- Kondo F, Tsukamoto O. Air-sea CO2 flux by eddy covariance technique in the equatorial Indian Ocean. Journal of Oceanography. 2007;63:449–456. [Google Scholar]
- Koné YJM, Abril G, Kouadio KN, Delille B, Borges AV. Seasonal variability of carbon dioxide in the rivers and lagoons of ivory coast (West Africa) Estuaries and Coasts. 2009;32:246–260. [Google Scholar]
- Kuwae T, Kamio K, Inoue T, Miyoshi E, Uchiyama Y. Oxygen exchange flux between sediment and water in an intertidal sandflat, measured in situ by the eddy-correlation method. Marine Ecology Progress Series. 2006;307:59–68. [Google Scholar]
- Laruelle GG, Dürr HH, Slomp CP, Borges AV. Evaluation of sinks and sources of CO2 in the global coastal ocean using a spatially-explicit typology of estuaries and continental shelves. Geophysical Research Letters. 2010;37:L15607. [Google Scholar]
- Lee X, Massman W, Law B. Handbook of Micrometeorology -A Guide for Surface Flux Measurement and Analysis. Dordrecht: Kluwer Academic Publishers; 2004. [Google Scholar]
- Massman WJ. A simple method for estimating frequency response corrections for eddy covariance systems. Agricultural and Forest Meteorology. 2000;104:185–198. [Google Scholar]
- Mateo MA, Romero J, Pérez M, Littler MM, Littler DS. Dynamics of millenary organic deposits resulting from the growth of the Mediterranean seagrass Posidonia oceanica. Estuarine, Coastal and Shelf Science. 1997;44:103–110. [Google Scholar]
- McGillis WR, Edson JB, Ware JD, Dacey JWH, Hare JE, Fairall CW, Wanninkhof R. Carbon dioxide flux techniques performed during GasEx-98. Marine Chemistry. 2001;75:267–280. [Google Scholar]
- McLeod E, Chmura GL, Bouillon S, et al. A blueprint for blue carbon: toward an improved understanding of the role of vegetated coastal habitats in sequestering CO2. Frontiers in Ecology and the Environment. 2011;9:552–560. [Google Scholar]
- McMillen RT. An eddy correlation technique with extended applicability to non-simple terrain. Boundary-Layer Meteorology. 1988;43:231–245. [Google Scholar]
- Montani S, Managaki Y, Shibanuma S. The structural change in biological productivity due to the progress of dairy in Lake Furen. Bulletin on Coastal Oceanography. 2011;49:59–67. (in Japanese) [Google Scholar]
- Nellemann C, Corcoran E, Duarte CM, Valdes L, DeYoung C, Fonseca L, Grimsditch G. Blue Carbon A Rapid Response Assessment. Birkeland: United Nations Environmental Programme, GRID-Arendal, Birkeland Trykkeri AS; 2009. [Google Scholar]
- Nomura D, Yoshikawa-Inoue H, Toyota T, Shirasawa K. Effects of snow, snowmelting and refreezing processes on air-sea-ice CO2 flux. Journal of Glaciology. 2010;56:262–270. [Google Scholar]
- de la Paz M, Gómez-Parra A, Forja J. Inorganic carbon dynamic and air-water CO2 exchange in the Guadalquivir Estuary (SW Iberian Peninsula) Journal of Marine Systems. 2007;68:265–277. [Google Scholar]
- Polsenaere P, Lamaud E, Lafon V, et al. Spatial and temporal CO2 exchanges measured by eddy covariance over a temperate intertidal flat and their relationships to net ecosystem production. Biogeosciences. 2012;9:249–268. [Google Scholar]
- Raymond PA, Cole JJ. Gas exchange in rivers and estuaries: choosing a gas transfer velocity. Estuaries. 2001;24:312–317. [Google Scholar]
- Regnier P, Friedlingstein P, Ciais P, et al. Anthropogenic perturbation of the carbon fluxes from land to ocean. Nature Geoscience. 2013;6:597–607. [Google Scholar]
- Saito H, Tamura N, Kitano H, Mito A, Takahashi C, Suzuki A, Kayanne H. A compact seawater pCO2 measurement system with membrane equilibrator and nondispersive infrared gas analyzer. Deep-Sea Research Part I: Oceanographic Research Papers. 1995;42:2025–2033. [Google Scholar]
- Schuepp PH, Leclerc MY, MacPherson JI, Desjardins RL. Footprint prediction of scalar fluxes from analytical solutions of the diffusion equation. Boundary-Layer Meteorology. 1990;50:355–373. [Google Scholar]
- Smith SV. Marine macrophytes as a global carbon sink. Science. 1981;211:838–840. doi: 10.1126/science.211.4484.838. [DOI] [PubMed] [Google Scholar]
- Takahashi T, Sutherland SC, Wanninkhof R, et al. Climatological mean and decadal change in surface ocean pCO2, and net sea-air CO2 flux over the global oceans. Deep-Sea Research Part II: Topical Studies in Oceanography. 2009;56:554–577. [Google Scholar]
- Tokoro T, Watanabe A, Kayanne H, et al. Measurement of air-water CO2 transfer at four coastal sites using a chamber method. Journal of Marine Systems. 2007;66:140–149. [Google Scholar]
- Tokoro T, Kayanne H, Watanabe A, et al. High gas-transfer velocity in coastal regions with high energy-dissipation rates. Journal of Geophysical Research C: Oceans. 2008;113:C11006. [Google Scholar]
- Tsunogai S, Watanabe S, Sato T. Is there a ‘continental shelf pump’ for the absorption of atmospheric CO2. Tellus, Series B: Chemical and Physical Meteorology. 1999;51:701–712. [Google Scholar]
- Vachon D, Prairie YT, Cole JJ. The relationship between near-surface turbulence and gas transfer velocity in freshwater systems and its implications for floating chamber measurements of gas exchange. Limnology and Oceanography. 2010;55:1723–1732. [Google Scholar]
- Vesala T, Huotari J, Rannik Ü, et al. Eddy covariance measurements of carbon exchange and latent and sensible heat fluxes over a boreal lake for a full open-water period. Journal of Geophysical Research D: Atmospheres. 2006;111:D11101. [Google Scholar]
- Wang ZA, Cai WJ. Carbon dioxide degassing and inorganic carbon export from a marsh-dominated estuary (the Duplin River): a marsh CO2 pump. Limnology and Oceanography. 2004;49:341–354. [Google Scholar]
- Wanninkhof R. Relationship between wind-speed and gas-exchange over the ocean. Journal of Geophysical Research. C. Oceans. 1992;97:7373–7382. [Google Scholar]
- Watanabe A. Process of seawater CO2 system formation and biological community metabolism in coral reefs and brackish estuaries. Tokyo: the University of Tokyo; 2004. Unpublished PhD thesis. [Google Scholar]
- Watanabe A, Kayanne H, Nozaki K, et al. A rapid, precise potentiometric determination of total alkalinity in seawater by a newly developed flow-through analyzer designed for coastal regions. Marine Chemistry. 2004;85:75–87. [Google Scholar]
- Webb EK, Pearman GI, Leuning R. Correction of flux measurements for density effects due to heat and water vapour transfer. Quarterly Journal Royal Meteorological Society. 1980;106:85–100. [Google Scholar]
- Weiss RF. Carbon dioxide in water and seawater: the solubility of a nonideal gas. Marine Chemistry. 1974;2:203–215. [Google Scholar]
- Zeebe RE, Wolf-Gladrow D. CO2 in Seawater: Equilibrium, Kinetics, Isotopes. Amsterdam: Elsevier; 2001. [Google Scholar]
- Zemmelink HJ, Slagter HA, Van Slooten C, et al. Primary production and eddy correlation measurements of CO2 exchange over an intertidal estuary. Geophysical Research Letters. 2009;36:L19606. [Google Scholar]


