Abstract
A multiplex RT-qPCR was developed to examine CYP1A2, CYP2D6, and CYP3A4 induction properties of compounds from food and herbal sources. The induction of drug metabolizing enzymes is an important pharmacokinetic interaction with unique features in comparison with inhibition of metabolizing enzymes. Cytochrome induction can lead to serious drug–drug or drug–food interactions, especially if the coadministered drug plasma level is critical as it can reduce therapeutic effects and cause complications. Using this optimized multiplex RT-qPCR, cytochrome induction properties of andrographolide, curcumin, lycopene, bergamottin, and resveratrol were determined. Andrographolide, curcumin, and lycopene produced no significant induction effects on CYP1A2, CYP2D6, and CYP3A4. However, bergamottin appeared to be a significant in vitro CYP1A2 inducer starting from 5 to 50 μmol/L with induction ranging from 60 to 100-fold changes. On the other hand, resveratrol is a weak in vitro CYP1A2 inducer. Examining the cytochrome induction properties of food and herbal compounds help complement CYP inhibition studies and provide labeling and safety caution for such products.
Keywords: CYP1A2, CYP2D6, CYP3A4, drug–food interactions, multiplex RT-qPCR
Introduction
Drug–food interactions or drug–nutrient interactions are gaining much attention recently as such interactions have the ability to influence patient outcome. These interactions need to be recognized, understood, predicted, and then managed as necessary as drug–drug interactions (Boullata 2013). Drug–food or drug–nutrient interaction is considered clinically significant if it alters therapeutic drug response and/or compromises nutrition status (Boullata and Hudson 2012; Boullata 2013). The severity of drug–food interactions can vary the same manner as drug–drug interactions. Specific food and nutrients are known to elicit changes in drug absorption, distribution, metabolism, and elimination (ADME) properties, often through specific mechanisms, and affecting the components of drug metabolism enzymes is common. For example, furanocoumarins from grapefruit juice such as bergamottin can cause irreversible inhibition of the cytochrome P450 enzyme, CYP3A4, mainly in the small intestine (Lown et al. 1997; Pirmohamed 2013). The clinical effects of grapefruit juice include a significant reduction in the presystemic metabolism of drugs metabolized by the CYP3A4 enzyme, resulting in an increase in systemic exposure, leading to adverse drug reactions and toxicity. In addition, flavonoids found in grapefruit juice such as naringin and hesperidin also inhibit the influx transporter protein family, namely organic anion transporting peptide and the overall effects include reduced bioavailability and subsequent decreased systemic and tissue concentrations of the affected drug (Dolton et al. 2012). It is said that inhibition of CYP3A4 is irreversible and it can last for longer than 3 days after ingestion of grape fruit juice until new enzyme has been synthesized in the gut wall (Pirmohamed 2013).
Cytochrome P450 (CYP) enzymes are a group of hem-containing enzymes playing a key role in the metabolism of a variety of chemically diverse compounds, including pharmaceutical agents, xenobiotics, and endogenous compounds. These enzymes are expressed in most tissues, with the highest abundance and largest number of individual CYP isoforms present in the liver. Among the CYP families, CYP1, CYP2, and CYP3 are most relevant for human drug metabolism and are responsible for the biotransformation of a large proportion of the commonly prescribed drugs in the United States (Venkatakrishnan et al. 2001; Zlokarnik et al. 2005). A large number of marketed drugs are metabolized by CYP1A2, CYP2D6, and CYP3A4 (Shimada et al. 1994; Nelson et al. 1996; Hellum et al. 2006). CYP1A2 represents about 13% CYP enzymes in the human liver and is involved in the metabolism of acetaminophen, clomipramine, and imipramine (Yan and Caldwell 2001). CYP2D6 constitutes ∼2% of total hepatic CYP and metabolizes cardiovascular drugs, antidepressants, and antipsychotics (Yan and Caldwell 2001; Zanger et al. 2004). It is an important CYP isoform as it accounts for the metabolism of more than 30% of drugs approved by the FDA, USA (Yan and Caldwell 2001; Gurley et al. 2008). CYP3A4 is the most abundant CYP isoform in adult liver and intestines, constituting about 29% of total CYP protein and catalyzes the metabolism for nearly 50% of marketed drugs, and therefore is the most important enzyme in drug metabolism (Yan and Caldwell 2001).
Drug metabolism enzymes govern drug the ADME process in the human body. Inhibition or induction of CYP enzymes by natural compounds or food components can alter the ADME process of the coadministered drugs. Inhibition of CYP enzymes will result in the increase in drug plasma level, which may lead to toxicity. In the case of grapefruit juice, it is known to increase the oral bioavailability of CYP3A4 substrates, including felodipine, verapamil, amiodarones, and a whole range of drugs (Jauregui-Garrido and Jauregui-Lobera 2012). On the other hand, enhancement of metabolic clearance by induction of CYP enzyme may lower plasma drug level to that below the therapeutic level. These interactions can lead to potentially severe and even life-threatening adverse reactions. For example, St. John's wort extract or Hypericum perforatum L. is among the most commonly used herbal medications in the United States and clinical reports indicate that it induces the CYP3A4 enzyme and reduces plasma concentrations of substrate drugs (Roby et al. 2000; Komoroski et al. 2004). Interactions between warfarin and St. John's wort, danshen, dong quai, ginseng, and gingko in patients on constant warfarin therapy and severe toxicity such as postoperative bleeding were reported (Zhou et al. 2007). Therefore, predicting the ability of a natural compound or food component affecting CYP expression will reduce the risk of adverse food–drug interactions and helps provide appropriate safety labeling and awareness to both consumers and healthcare professionals.
The induction of drug metabolizing enzymes is considered to be a case of pharmacokinetic interactions with unique features in comparison with inhibition of metabolizing enzymes (Hukkanen 2012). It is known that induction of a CYP enzyme is a slower process, and takes longer time to affect drug metabolism as compared to CYP inhibition, which can happen quickly. An additional concern is the increased risk of reactive metabolite toxicity due to an induction-mediated imbalance of detoxification and activation (Walsky and Boldt 2008). For example, in prodrugs, enhanced metabolic activation by induction can lead to increased toxicity, especially when the increase in metabolism of the parent compound leads to an increase in exposure of the toxic metabolite (Hukkanen 2012). In the clinical setting, the outcome of adding an inducer to the patient's established regimen can be difficult to detect (Hukkanen 2012). To determine whether a new chemical entity is a CYP inducer, the mRNA changes are to be measured (FDA 2012). According to Fahmi et al. (2010), the mRNA fold induction data results are more sensitive and informative as compared with enzymatic activity data. The RT-qPCR method is a robust and quantitative way of determining mRNA levels in assays.
In this study, a multiplex RT-qPCR assay using hydrolysis probes was developed and validated to quantitate the mRNA expression of CYP1A2, CYP2D6, and CYP3A4 in a single reaction. Subsequently, this multiplex assay was used to determine the effects of a group of food components on the cytochromes at the transcriptional level. Briefly, andrographolide is a diterpenoid component of Andrographis paniculata Nees, a tropical herb widely used for various health conditions. Bergamottin is a component of grapefruit juice and a known CYP3A4 inhibitor at the enzymatic level; however, its effects on the CYP1A2, 2D6, and CYP3A4 at the transcriptional level are currently unknown. Curcumin is a well-known dietary component derived from Curcuma longa L., a widely used spice. On the other hand, lycopene is a phytonutrient found in red fruits and vegetables, and resveratrol is a polyphenolic compound found in grape skin and peanuts. Despite public interest and widespread consumption of these food components, little is known about the ability of these components to induce cytochrome P450 expression. These compounds were evaluated systematically for their possible induction effects on CYP1A2, CYP2D6, and CYP3A4 mRNA, and protein expressions in HepG2 cells.
Material and Methods
Materials
Minimal essential medium (MEM), fetal bovine serum (FBS), penicillin and streptomycin solution, and 0.25% (v/v) trypsin-EDTA were purchased from Gibco (Carlsbad, CA). Sodium pyruvate, sodium bicarbonate, and nonessential amino acids were purchased from Sigma-Aldrich (St. Louis, MO). Furafylline, β-naphthoflavone, omeprazole, dexamethasone, ketoconazole, dimethylsulfoxide (DMSO), methanol, and natural compounds such as andrographolide, bergamottin, curcumin, lycopene, and resveratrol were purchased from Sigma-Aldrich. The iScript™ One-Step RT-PCR Kit With SYBR® Green was purchased from Bio-Rad Laboratories (Hercules, CA), QIAshredder™, RNeasy® Mini Kit, QuantiFast® Multiplex RT-PCR kit, HotStarTaq® Plus DNA polymerase, and dNTPs mix was obtained from Qiagen (Venlo, Limburg, Netherlands). Primary antibodies against CYP1A2, CYP2D6, and CYP3A4 were bought from Millipore (Billerica, MA) while the primary antibody for β-actin and secondary antibody (anti-rabbit IgG, HRP-linked) was obtained from Cell Signaling Technology (Beverly, MA). Primers were synthesized by Bioneer (Daejeon, Korea) and probes were synthesized by Sigma-Aldrich.
Cell culture and treatment conditions
HepG2 cells were obtained from the American Type Culture Collection (ATCC, Manassas, VA). Cells were cultured in T25 flask in MEM (Gibco) supplemented with 10% (v/v) FBS (Gibco), 100 U/mL of penicillin, 100 μg/mL of streptomycin, 1% (v/v) sodium pyruvate, 1% (v/v) sodium bicarbonate, and 1% (v/v) nonessential amino acid. Cultures were maintained in a humidified incubator supplemented with 5% (v/v) CO2 at 37°C. To determine the effects of control drugs and natural compounds on the mRNA expression and protein expression of CYP1A2, CYP2D6, and CYP3A4, HepG2 cells were treated with various concentrations of these compounds. Briefly, the cells were cultured in reduced-serum medium containing 0.5% (v/v) FBS for 4 h and subsequently treated with various concentrations of these compounds (0.1–25 μmol/L) for 48 h. Omeprazole (50 μmol/L) and dexamethasone (5 μmol/L) were used as positive controls (inducers) for CYP1A2 and CYP3A4, respectively. The concentrations for the positive controls were optimized prior to the experiments. All compounds were diluted with concentrated DMSO. The concentration of DMSO in treated cells did not exceed 0.1% (v/v). Control cells were treated with DMSO (50% v/v) to yield a final concentration of 0.1% (v/v). There are no known CYP2D6 inducers; therefore, no positive controls for induction were used. However, in the western blot analysis for CYP2D6, quinidine (5 μmol/L) was used as a control for CYP2D6 inhibition. After 48 h of treatment, either the total RNA or total protein was isolated and subjected to multiplex qRT-PCR analysis or western blot analysis, respectively.
Primer and probe design
All primers and hydrolysis probe sequences were designed using Beacon Designer software, Version 7.7 (Premier Biosoft International, Palo Alto, CA) (Table 1). Nucleotide sequences for the four targets were retrieved from the National Center of Biotechnology Information (NCBI). Primer pairs for the four targets were designed to have similar melting temperature (Tm). The hydrolysis probes were designed with Tm about 10°C higher than the primers. Both primers and probe sets were designed to minimize secondary structure and primer dimers (Table 1). Basic Local Alignment Search Tool (BLAST®) was performed to confirm the specificity of the primers and probes. Fluorophores for probe labeling were chosen to minimize overlaps in their emission spectra. Selected fluorophores were 6-FAM™ (6-carbonyl fluorescein), HEX™ (hexachloro-carbonyl fluorescein), Texas Red®, and Cy5®. Black Hole Quencher™ (BHQ™) was matched for each fluorophore.
Table 1.
Primers sequences used for the RT-qPCR multiplex assay
| Name | Oligonucleotide sequence (5′–3′) | Working concentration (nmol/L) | Accession number | Position | Amplification size (bp) |
|---|---|---|---|---|---|
| CYP1A2 | TACTTGGAGGCCTTCATC (F) | 400 | NM_000761.3 | 1163–1180 | 130 |
| TTACGAAGACACAGCATTT(R) | 400 | 1274–1292 | |||
| CYP2D6 | ATGAGAACCTGTGCATAG (F) | 400 | NM_000106.4 | 812–829 | 101 |
| CGGATGTAGGATCATGAG (R) | 400 | 895–912 | |||
| CYP3A4 | GGTCCAGTGGGATTTATG (F) | 400 | NM_017460.3 | 429–446 | 82 |
| TTGGAGACAGCAATGATC (R) | 400 | 493–510 | |||
| β-actin | ATCACCATTGGCAATGAG (F) | 400 | NM_001101.3 | 826–843 | 105 |
| GATGGAGTTGAAGGTAGTT(R) | 400 | 912–930 |
RNA isolation and RT-qPCR assay
Cells were homogenized by centrifugation using QIAshredder™ and total RNA were isolated using the RNeasy® Mini Kit according to the manufacturer's instructions. Total RNA were quantitated using a spectrophotometer and the purity was assessed from the 260:280 nm ratio. Gel electrophoresis was carried out with 1% (w/v) agarose gel to confirm the integrity of the RNA sample. Two sharp bands of 18S and 28S rRNA indicate intact RNA. The total RNA was subjected to DNase treatment using RQ1 RNase-free DNase (Promega, Madison, WI) according to the manufacturer's protocol prior to RT-PCR.
The RT-qPCR reactions were carried out using CFX96 Real-Time PCR Detection System and analyzed with CFX Manager™ software, version 1.5 (Bio-Rad Laboratories). Melt-curve analysis was carried out using iScript™ One-Step RT-PCR Kit with SYBR® Green while the multiplex assays were carried out using QuantiFast® Multiplex RT-PCR kit according to the manufacturer's protocol. All the reactions were one-step RT-qPCR and performed using 200 ng of total RNA in a single reaction volume of 25 μL.
Optimization of multiplex RT-qPCR assay
The performances of the individual primer pairs were verified by using iScript™ One-Step RT-PCR Kit with SYBR® Green assay. Gradient RT-qPCR (duplex) was first carried out to narrow down the annealing temperature (Ta) for the primer pairs, followed by melt-curve analysis to check the specificity of each primer pair. The hydrolysis probes were synthesized once the specificity of the primer pairs was confirmed. Primers and probes found to be nonspecific were redesigned and reoptimized. Subsequently, gradient RT-qPCR was carried out for the multiplex assay to select the optimum Ta to amplify the four primer pairs and probes simultaneously. Due to low expression of CYP1A2 in HepG2 cells, total RNA isolated from HepG2 cells treated with omeprazole (50 μmol/L) for 48 h was used for optimization purposes. For the optimization of the multiplex assay, the amount of HotStarTaq® Plus DNA polymerase, the concentration of Mg2+, and dNTP mix were varied while the primer and probe concentration remained unaltered. Once the reactions were optimized, PCR amplification efficiency was determined using five points of twofold serial dilution of total RNA (500, 250, 125, 62.5, and 31.25 ng). Subsequently, all PCR assays were carried out using the corrected PCR efficiency. The thermal profile used for the amplification was 20 min at 50°C for reverse transcription, 5 min at 95°C for HotStarTaq® Plus DNA polymerase activation follow by a two-step PCR protocol for 40 cycles (15 sec of denaturation at 95°C and 30 sec at 56.1°C for combined optimized annealing-extension with fluorescent data acquisition).
Calculation of copy number and statistical analysis
The final multiplex assay does not detect the presence of CYP1A2 mRNA expression in control (untreated) cells. Hence, to standardize the presentation of data, the mRNA expressions of the CYP isoform were represented in copy number (Cn). A standard curve was generated from a dilution series of total RNA induced with omeprazole (50 μmol/L). Since the relationship between log Cn and Ct is linear, the Ct values obtained were compared to the standard curve to generate the copy number for CYP1A2, CYP2D6, and CYP3A4 using interpolation. The reference gene, β-actin, was used to provide an internal marker of mRNA integrity within the experiment. All data were presented as mean copy number ± standard deviation of two independent experiments performed in triplicate (n = 6). Statistical analysis between the untreated and the treated group was calculated using one-way Anova and posthoc Dunnett's test, with an α value of 0.05 (GraphPad Prism software, Version 3.0, La Jolla, CA).
Relative quantification of gene expression was calculated according to the Pfaffl mathematical model, where appropriate, and the assumption of baseline Ct value of 33 was made for CYP1A2 in untreated control (Ct values undetected; Ct value of 33 was obtained during duplex amplification). Cells treated with DMSO served as the untreated control. However, for CYP1A2 mRNA expression, the furafylline–omeprazole-treated cells were compared to omeprazole-only-treated cells instead of untreated cells. The percentage of changes (as compared to positive controls) was calculated by dividing the fold changes for each concentration of the test compound over the fold changes of the positive control used in the experiment.
Evaluation of multiplex qRT-PCR assay using known inducers and inhibitors and subsequent determination of the effects of food compounds on these CYP isoforms
Evaluation of the multiplex assay was carried out using several known inducers and inhibitors of the CYP isoforms. Briefly, cells were plated onto 6-wells and upon 80–90% confluence, cells were cultured in medium containing 0.5% FBS (v/v) for 4 h and subsequently treated with a series of concentrations of the following: β-naphthoflavone (CYP1A2 inducer), omeprazole (CYP1A2 inducer), furafylline (CYP1A2 inhibitor), dexamethasone (CYP3A4 inducer), and ketoconazole (CYP3A4 inhibitor). Similarly, resveratrol, bergamottin, andrographolide, curcumin, and lycopene were used to treat the cells as described above. The range of concentrations used was between 0.1 and 50 μmol/L for all the compounds, except for ketoconazole, for which the maximum concentration used was 25 μmol/L. The plates were further incubated for 48 h prior to the assessment of mRNA and protein expression as described previously. There were no known clinical inducers of CYP2D6 mRNA; therefore, it will be interesting to know if there are possible inducers for this enzyme. To determine the inhibitory effect of furafylline on CYP1A2 mRNA expression, cells were first treated with furafylline for 2 h before omeprazole treatment.
Western blot analysis
Total protein was isolated using ProteoJET™ mammalian cell lysis buffer (Fermentas, Pittsburgh, PA) according to the manufacturer's protocol. Protein concentration was measured using Biorad DC Protein Assay and Protein Standard II BSA (Bio-Rad Laboratories). The protein samples were separated using sodiumdodecyl sulphate polyacrylamide gel electrophoresis (SDS-PAGE) gel with 4% (v/v) stacking and 10% (v/v) resolving gels before transferred to Immobilon-P polyvinylidene difluoride membrane (Millipore). Membranes were first blocked with 3% (w/v) nonfat dry milk at room temperature for 2 h and probed with optimized dilution of primary antibodies against CYP1A2 (1:1000), CYP2D6 (1:2000), CYP3A4 (1:1000), and β-actin (1:1000), respectively, at 4°C, overnight. Secondary antibodies were probed at room temperature for 2 h. Chemiluminescence detection was performed using horseradish peroxidase-conjugated secondary antibodies and ECL™ Western Blotting Detection Reagents (GE Healthcare, Little Chalfont, Buckinghamshire, U.K.) followed by imaging using ChemiDoc™ XRS Imaging System (Bio-Rad Laboratories). Western blot analyses were carried out in duplicate for at least two independent experiments. Densitometry scanning of the bands was carried out using Image Lab software (Version 4.0; Bio-Rad). All the isoforms were normalized to β-actin and data were presented as relative protein expression (n = 4). Statistical analysis between the untreated and the treated group was calculated similarly as described earlier.
Results
Verification of design of primers and probes
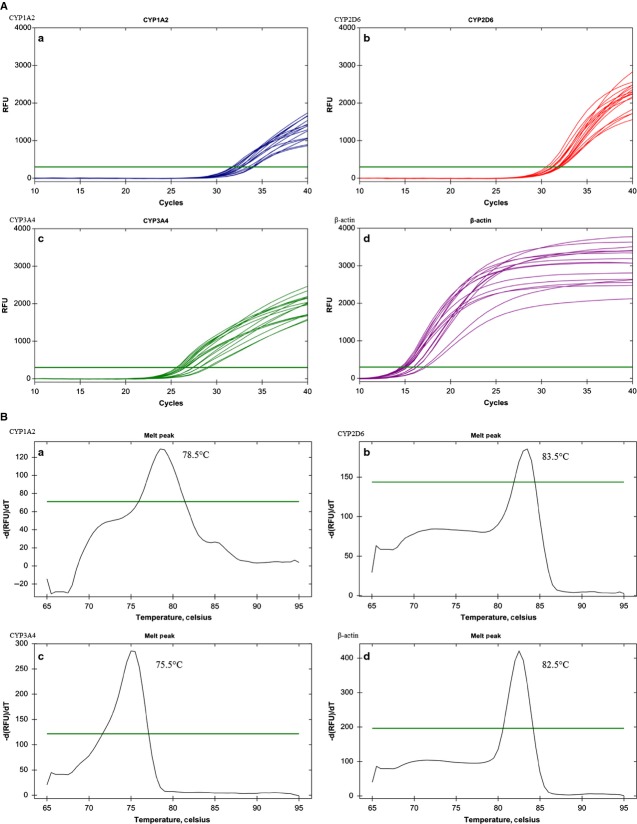
Primer and probe sequences examined using the NCBI gene BLAST algorithm (http://www.ncbi.nlm.nih.gov/blast) revealed specificity of target amplification with query coverage and maximum identity of 100%. Based on an initial gradient RT-qPCR (duplex; 46.0–60.0°C) using iScript™ One-Step RT-PCR Kit with SYBR® Green, a narrower optimum annealing temperature range (Ta) was obtained (51.0–59°C). Melt-curve analysis revealed a single peak for each of the target gene indicating that the primer pairs were specific to the target and that formation of primer dimers was unlikely. Tm for all the four primer sets was near to one another (75.5–83.5°C) (Fig. 1A,B).
Figure 1.
(A) PCR gradient amplification cycles for three isoforms and β-actin. (B) A representative melt-curve analysis of three isoforms and β-actin at specific temperature.
Optimization of multiplex qRT-PCR assay
Subsequently, a gradient qRT-PCR (multiplex) was carried out to obtain the optimum Ta for the four targets simultaneously. The final optimum cycling condition was 20 min at 50°C for reverse transcription, followed by 5 min at 95°C for DNA polymerase activation, 15 sec at 95°C for denaturation, and 30 sec at 56.1°C for annealing, followed by extension consisting of 40 cycles/run. The final optimized multiplex assay consists of 1X QuantiFast® Multiplex RT-PCR master mix, 0.25 μL/reaction of QuantiFast® RT mix, 400 nmol/L of each primer, 200 nmol/L of each probe and an additional 2 U/reaction of HotStarTaq® Plus DNA polymerase, 3 mmol/L/reaction of MgCl2, and 400 μmol/L/reaction of dNTP. A PCR efficiency evaluation carried out using the optimized condition yielded percentage of efficiency ranging from 84.2 to 100.9°C. The PCR efficiency for CYP1A2, CYP2D6, and β-actin was generally more than 95% whereas for CYP3A4, it was ∼84%.
Effects of known inducers and inhibitors on CYP mRNA and protein expression
HepG2 cells were treated with various inducers or inhibitors of CYP isoforms. The mRNA expression level of CYP1A2, CYP2D6, and CYP3A4 was measured after 48 h treatment. β-Naphthoflavone, a known CYP1A2 inducer, up-regulates the mRNA expression of CYP1A2 as expected. A clear induction of the CYP1A2 expression was detected in the multiplex qPCR assay, where Ct values were obtained for β-naphthoflavone-treated cells starting from 5 μmol/L onwards, while remaining undetected for untreated cells (Fig. 2). The mRNA expression of CYP1A2 was up-regulated significantly in a concentration-dependent manner. Based on the assumption of a Ct value of 33 (control; untreated), the estimated up-regulation was a more than sixfold change at 5 μmol/L and went up as high as a 26-fold change at 50 μmol/L. A similar pattern was observed in the protein expression of CYP1A2 (Fig. 3). The mean relative intensity was significantly higher in cells treated with 5 μmol/L or higher of β-naphthoflavone. On the other hand, the mRNA and protein expression of CYP2D6 and CYP3A4 remained either unchanged or there were slight changes that were statistically insignificant.
Figure 2.
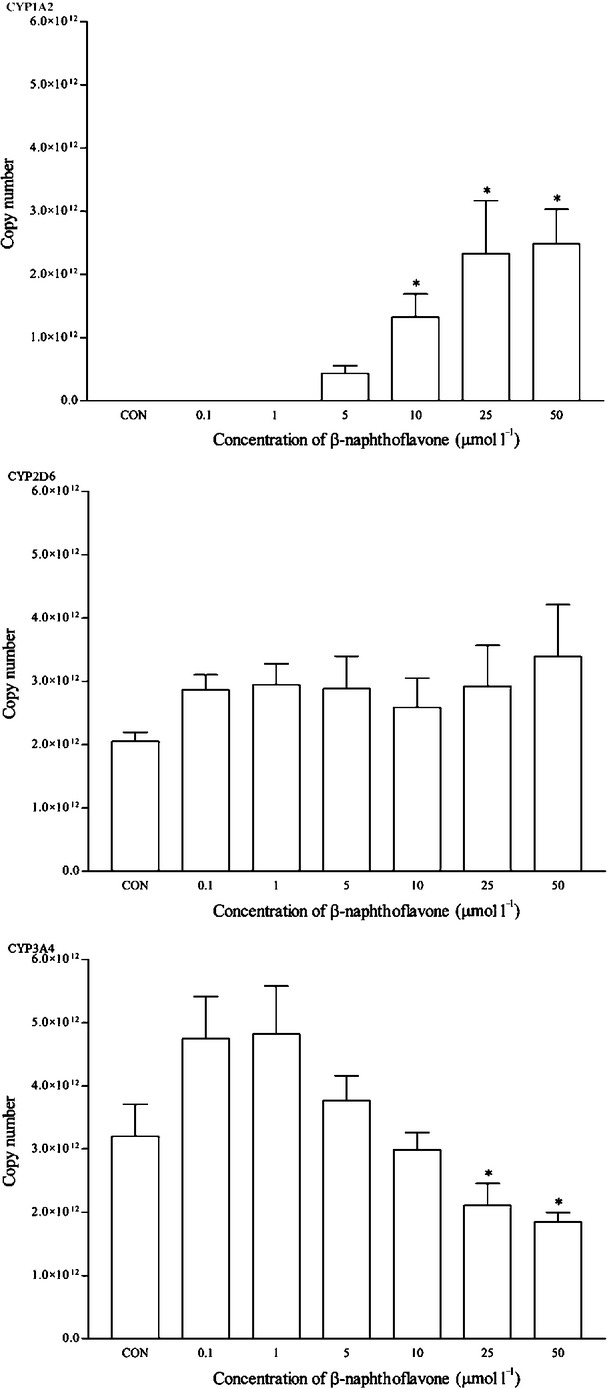
The effects of β-naphthoflavone on the mRNA expression of (A) CYP1A2, (B) CYP2D6, and (C) CYP3A4 in HepG2 cells after 48 h of treatment. Data are presented as mean copy number ± standard deviation of three independent experiments (n = 9). *P < 0.05. CON, control.
Figure 3.

The effects of β-naphthoflavone on the protein expression of (A) CYP1A2, (B) CYP2D6, and (C) CYP3A4 in HepG2 cells after 48 h of treatment. Densitometry scanning data are presented as relative intensity of protein bands ± standard deviation of cytochrome over β-actin of two independent experiments (n = 4). Images of western blot analysis are representative of each isoform *P < 0.05. CON, control.
Omeprazole is a known clinical CYP1A2 inducer. As expected, a clear dose-dependent induction in the mRNA expression of CYP1A2 was observed and it was statistically significant from 10 μmol/L onwards. CYP1A2 was up-regulated to 24-fold changes at this concentration (Fig. 4). A similar trend was observed for the CYP1A2 protein expression, even though it was statistically insignificant (Fig. 5). Omeprazole appeared to have no effects on the mRNA and protein expression of CYP2D6. However, it significantly induced the expression of CYP3A4 at 0.1 μmol/L (<1.5-fold change) and protein expression at 1 and 5 μmol/L, respectively.
Figure 4.
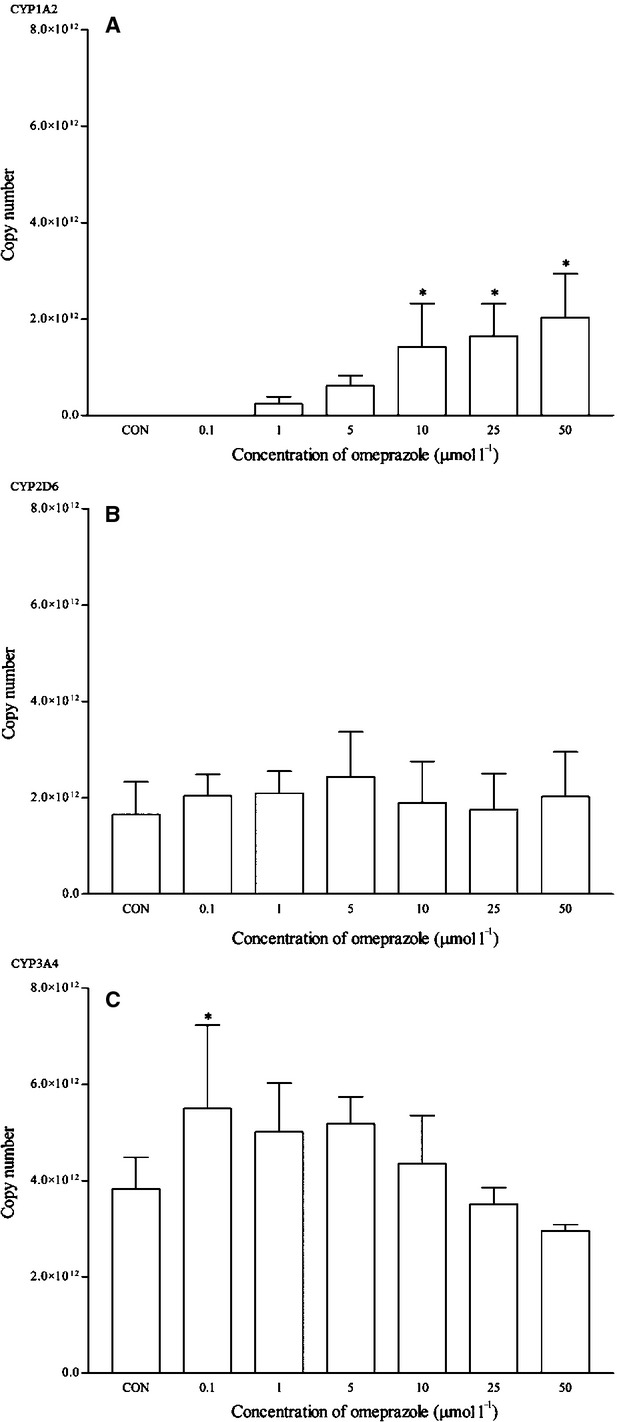
The effects of omeprazole on the mRNA expression of (A) CYP1A2, (B) CYP2D6, and (C) CYP3A4 in HepG2 cells after 48 h of treatment. Data are presented as mean copy number ± standard deviation of three independent experiments (n = 9) *P < 0.05. CON, control.
Figure 5.

The effects of omeprazole on the protein expression of (A) CYP1A2, (B) CYP2D6, and (C) CYP3A4 in HepG2 cells after 48 h of treatment. Densitometry scanning data are presented as relative intensity of protein bands ± standard deviation of cytochrome over β-actin of two independent experiments (n = 4). Images of western blot analysis are representative of each isoform *P < 0.05. CON, control.
Furafylline is a known inhibitor for CYP1A2 enzymatic activity. However, it is not known if furafylline inhibits the mRNA expression of CYP1A2. Interestingly, when the cells were concomitantly treated with furafylline and omeprazole, furafylline attenuated the ability of omeprazole to induce CYP1A2. The mRNA expression of CYP1A2 was significantly reduced in cells concomitantly treated with furafylline (at most concentrations) and omeprazole as compared with omeprazole-treated cells (control) (Fig. 6). However, the same cannot be said for the corresponding protein expression as the reduction was statistically insignificant (Fig. 7). On the other hand, no significant changes were observed for the rest of the isoforms.
Figure 6.
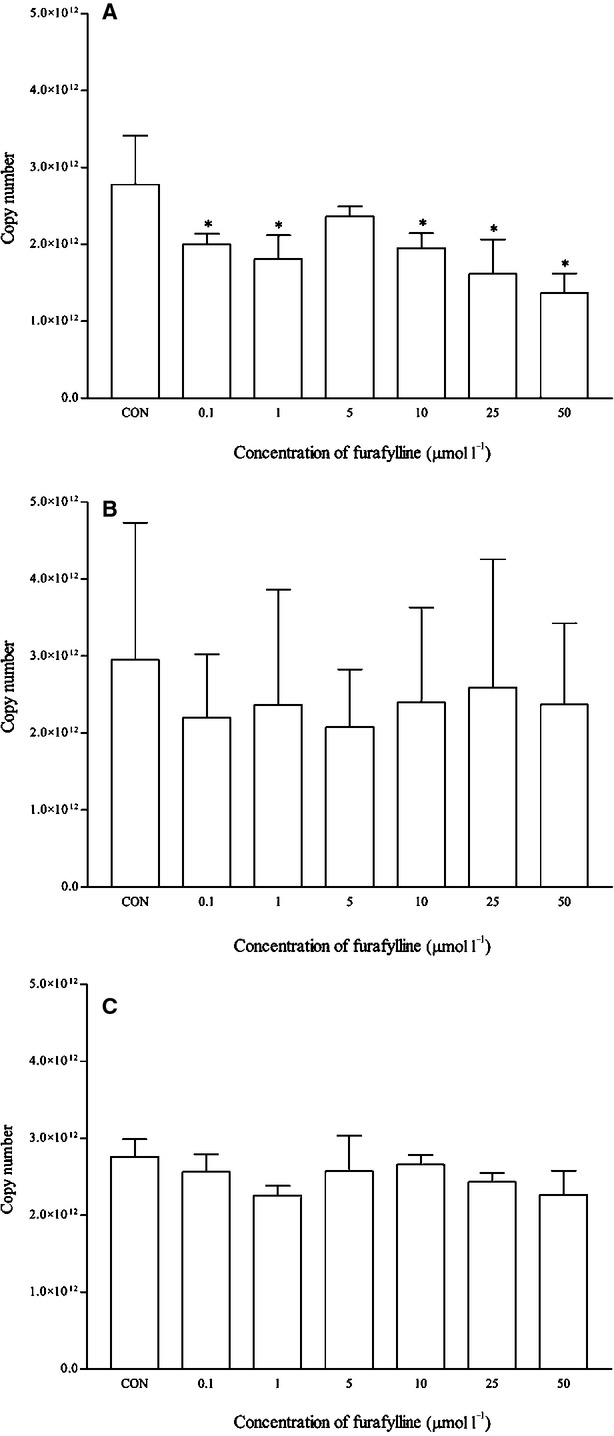
The effects of furafylline on the mRNA expression of (A) CYP1A2, (B) CYP2D6, and (C) CYP3A4 in HepG2 cells after 48 h of treatment. Data are presented as mean copy number ± standard deviation of three independent experiments (n = 9). *P < 0.05. CON, control; treated with omeprazole.
Figure 7.

The effects of furafylline on the protein expression of (A) CYP1A2, (B) CYP2D6, and (C) CYP3A4 in HepG2 cells after 48 h of treatment. Densitometry scanning data are presented as relative intensity of protein bands ± standard deviation of cytochrome over β-actin of two independent experiments (n = 4). Images of western blot analysis are representative of each isoform. CON, control; treated with omeprazole.
Dexamethasone is a known clinical inducer of CYP3A4. As expected, dexamethasone significantly induced the mRNA expression of CYP3A4 from 0.1 μmol/L and onwards. Dexamethasone at 5 μmol/L produced the highest induction at approximately twofold changes (Fig. 8). This was also observed in the CYP3A4 protein expression at the same concentration (Fig. 9). The expression of other isoforms was not affected by this drug. Ketoconazole is the known clinical inhibitor of the CYP3A4 enzyme and its activities on mRNA expression are largely uncertain. As seen in Figure 10, the effects of ketoconazole on the mRNA expression of CYP3A4 are largely insignificant except at the highest concentration, that is 25 μmol/L. Although there was a similar trend for the corresponding protein expression, the differences were not proved to be significant (Fig. 11). A significant reduction in CYP2D6 mRNA expression was also noticed at the same concentration; otherwise, it remained insignificant.
Figure 8.
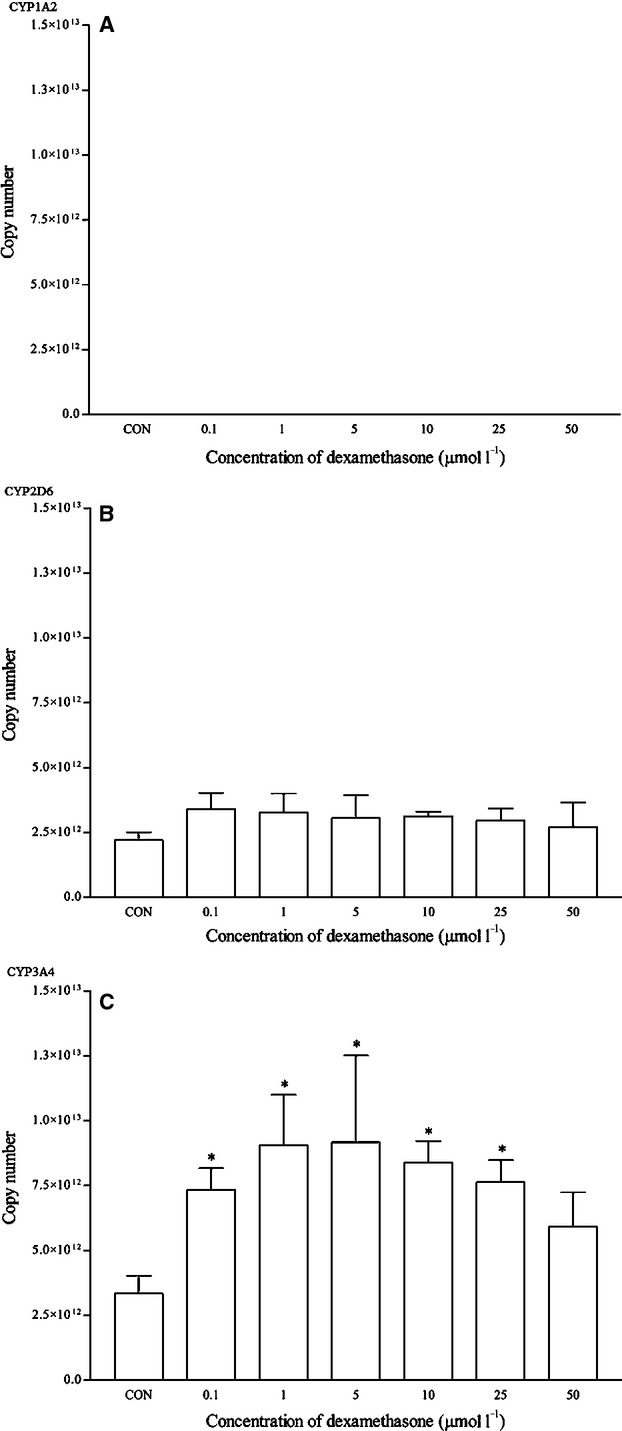
The effects of dexamethasone on the mRNA expression of (A) CYP1A2, (B) CYP2D6, and (C) CYP3A4 in HepG2 cells after 48 h of treatment. Data are presented as mean copy number ± standard deviation of three independent experiments (n = 9). *P < 0.05. CON, control.
Figure 9.
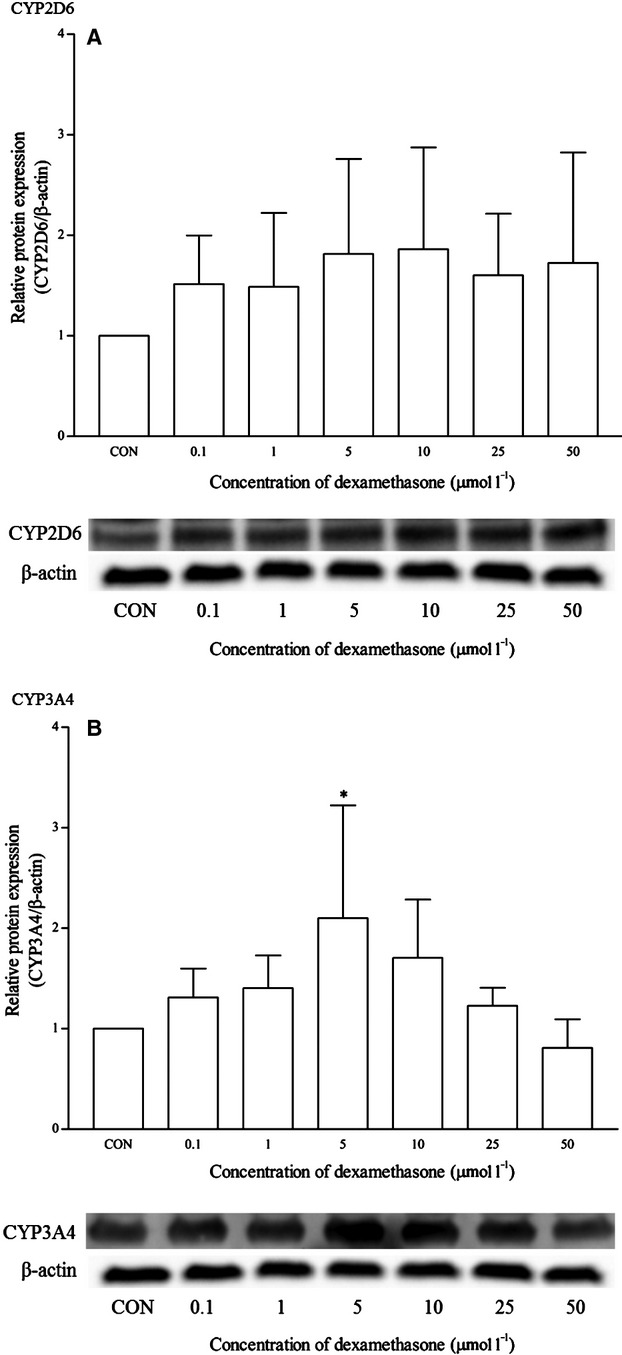
The effects of dexamethasone on the protein expression of (A) CYP2D6 and (B) CYP3A4 in HepG2 cells after 48 h of treatment. Densitometry scanning data are presented as relative intensity of protein bands ± standard deviation of cytochrome over β-actin of two independent experiments (n = 4). Images of western blot analysis are representative of each isoform *P < 0.05. CON, control.
Figure 10.
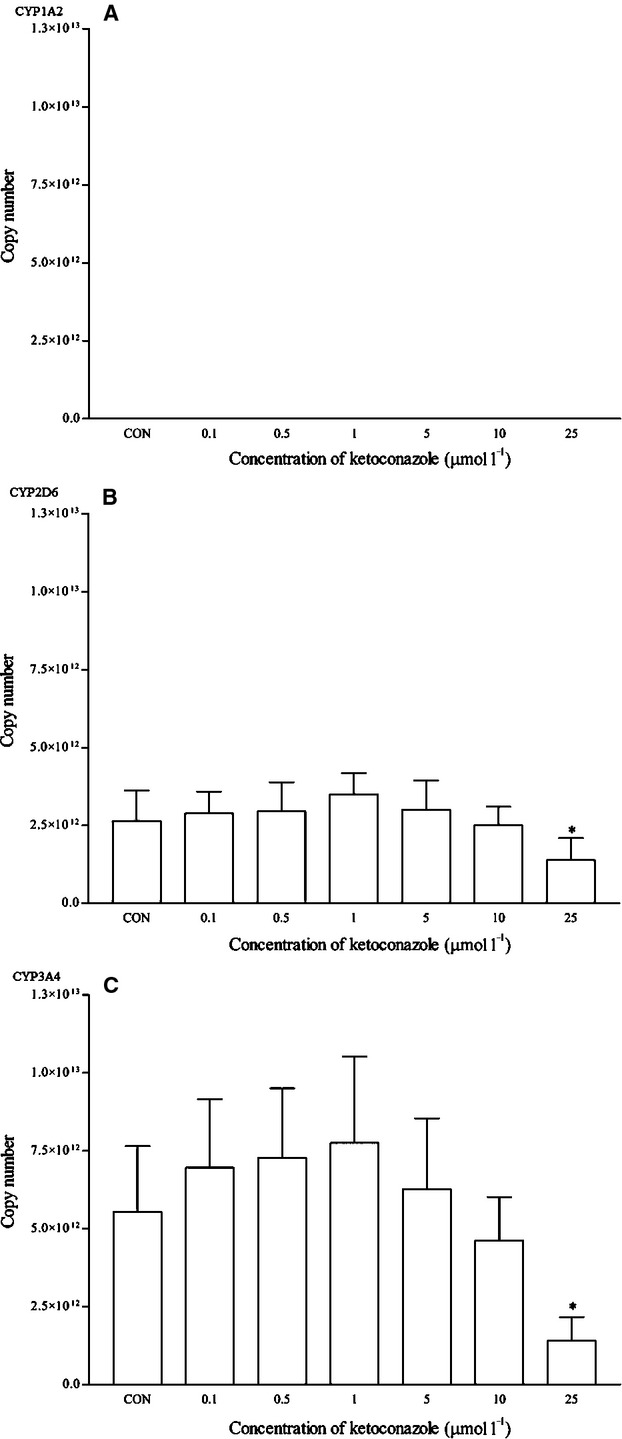
The effects of ketoconazole on the mRNA expression of (A) CYP1A2, (B) CYP2D6, and (C) CYP3A4 in HepG2 cells after 48 h of treatment. Data are presented as mean copy number ± standard deviation of three independent experiments (n = 9). *P < 0.05. CON, control.
Figure 11.
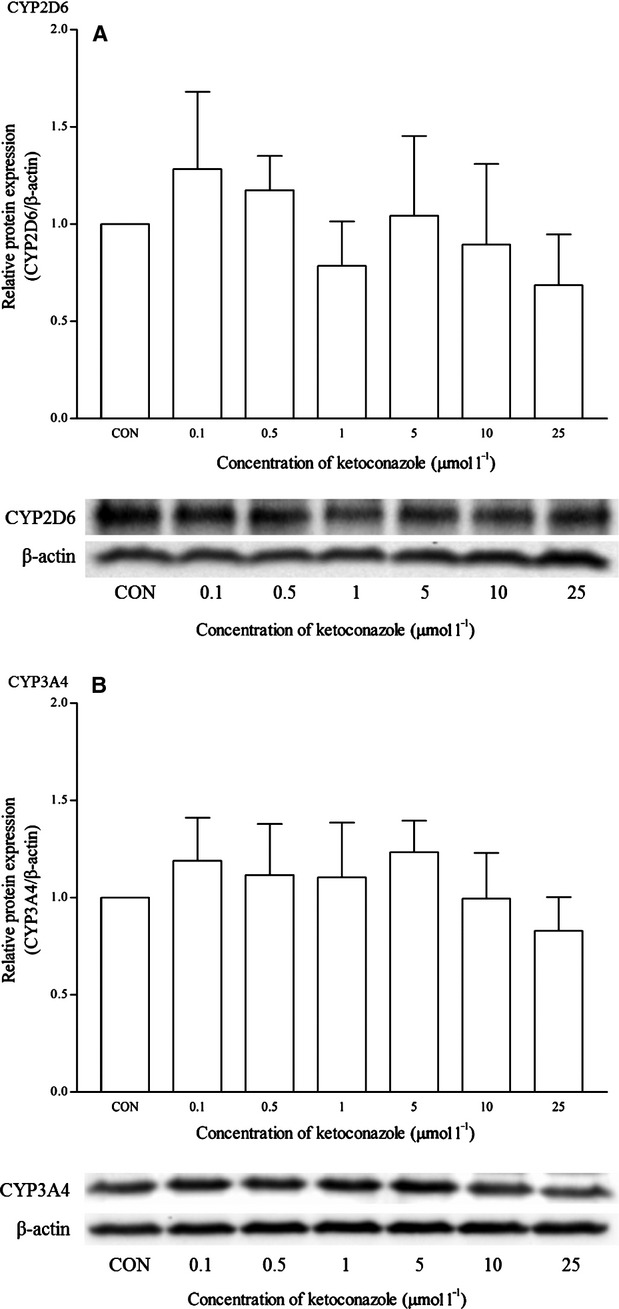
The effects of ketoconazole on the protein expression of (A) CYP2D6 and (B) CYP3A4 in HepG2 cells after 48 h of treatment. Densitometry scanning data are presented as relative intensity of protein bands ± standard deviation of cytochrome over β-actin of two independent experiments (n = 4). Images of western blot analysis are representative of each isoform. CON, control.
Effects of food and herbal compounds on CYP mRNA and protein expression
Andrographolide at all concentrations produced no effects on the mRNA expression of CYP1A2, as no amplifications or Ct values were detected (Fig. 12). Interestingly, CYP2D6 protein expression was up-regulated within the range of concentration tested with significant values from 1 to 5 μmol/L, even though the up-regulation of the mRNA levels was not statistically significant (Figs. 12, 13). The mean up-regulation of the CYP2D6 protein was all less than twofold changes. As for CYP3A4, andrographolide did not affect both mRNA and protein expression.
Figure 12.
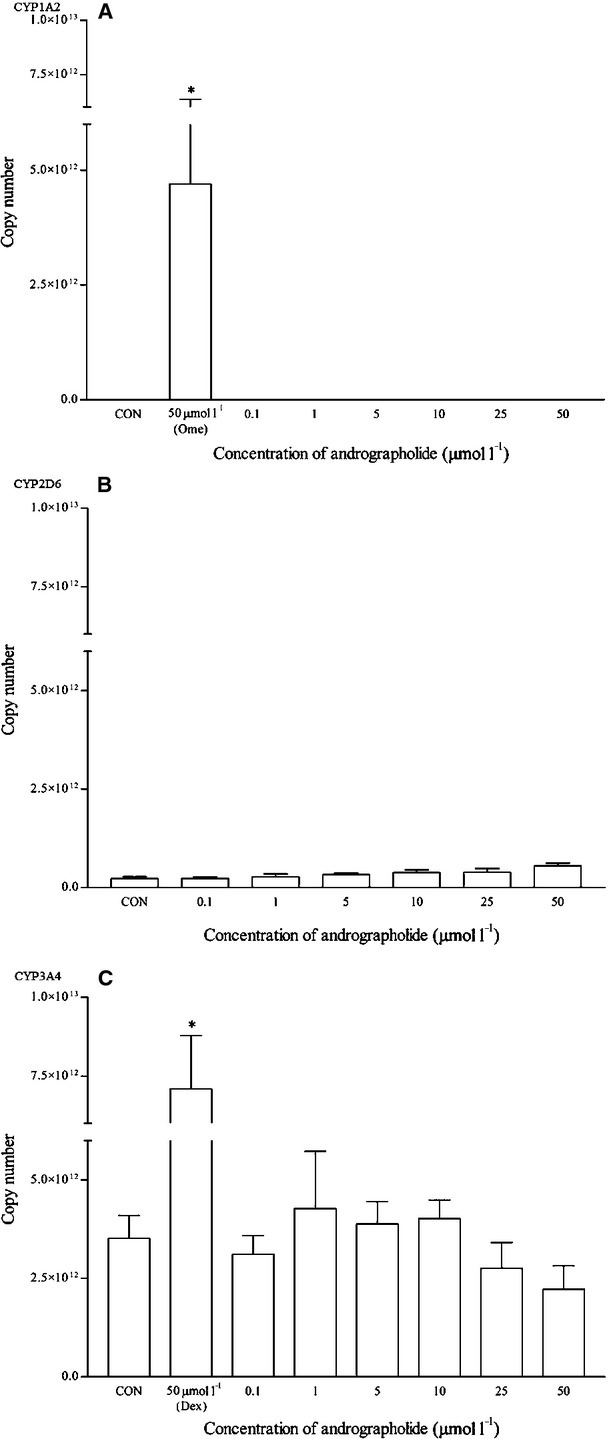
The effects of andrographolide on the mRNA expression of (A) CYP1A2, (B) CYP2D6, and (C) CYP3A4 in HepG2 cells after 48 h of treatment. Data are presented as mean copy number ± standard deviation of three independent experiments (n = 9). *P < 0.05. CON, control; Ome, omeprazole; Dex, dexamethasone.
Figure 13.
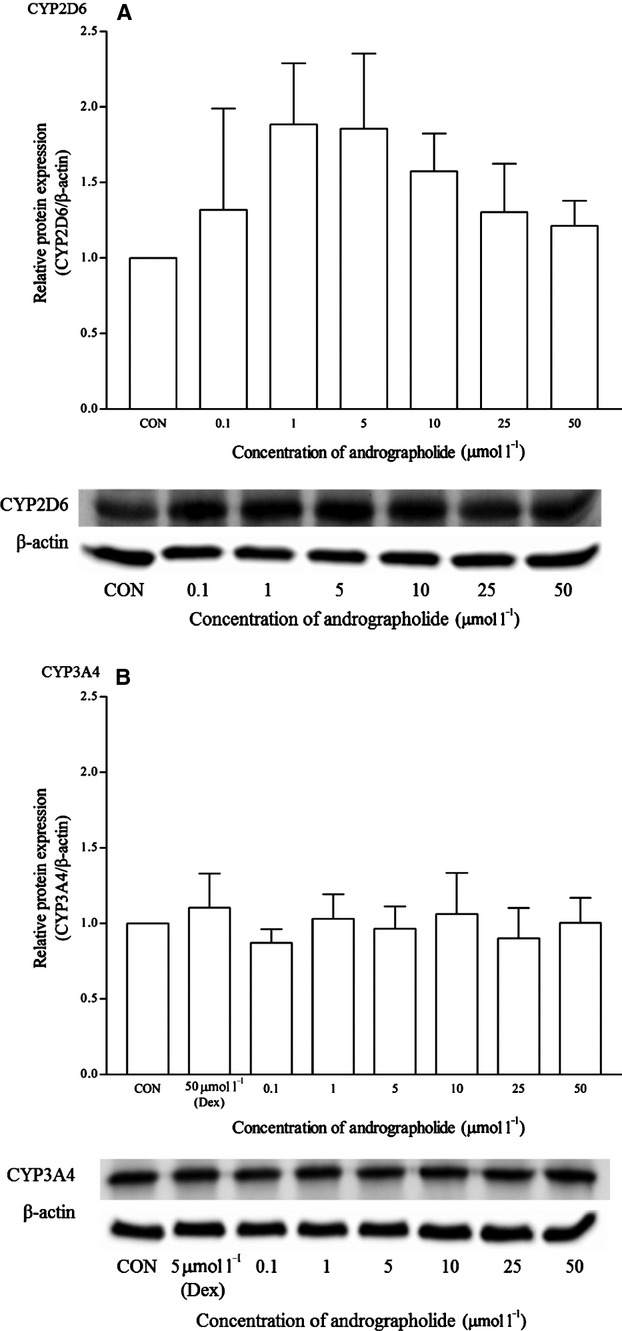
The effects of andrographolide on the protein expression of (A) CYP2D6, and (B) CYP3A4 in HepG2 cells after 48 h of treatment. Densitometry scanning data are presented as relative intensity of protein bands ± standard deviation of cytochrome over β-actin of two independent experiments (n = 4). Images of western blot analysis are representative of each isoform. CON, control; Dex, dexamethasone.
On the other hand, bergamottin significantly induced the mRNA of CYP1A2 from 5 to 50 μmol/L (ranging from 60 to 100-fold changes) (Fig. 14). Interestingly, only a slight induction of CYP1A2 protein was observed and the magnitudes were statistically insignificant (Fig. 15). Bergamottin did not affect the expression of CYP2D6 and CYP3A4. Dexamethasone (5 μmol/L) too did not significantly induce the protein expression of CYP3A4 as compared with the RT-qPCR and earlier western blot results.
Figure 14.
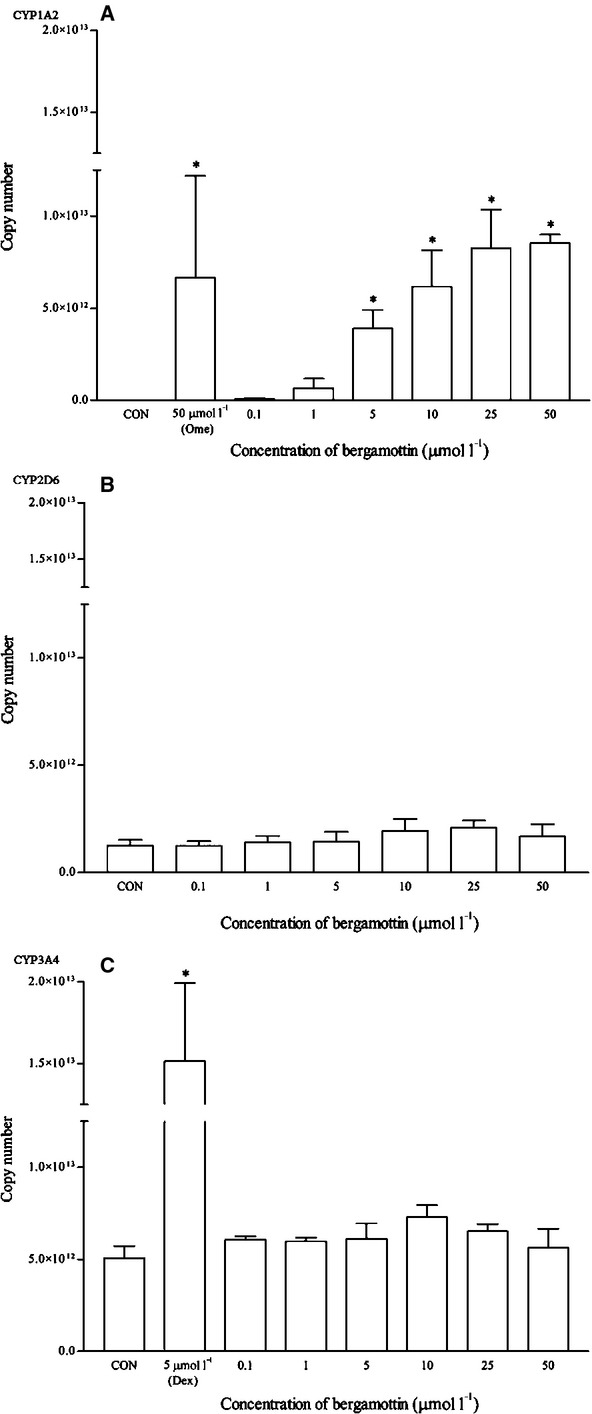
The effects of bergamottin on the mRNA expression of (A) CYP1A2, (B) CYP2D6, and (C) CYP3A4 in HepG2 cells after 48 h of treatment. Data are presented as mean copy number ± standard deviation of three independent experiments (n = 9). *P < 0.05. CON, control; Ome, omeprazole; Dex, dexamethasone.
Figure 15.

The effects of bergamottin on the protein expression of (A) CYP1A2, (B) CYP2D6, and (C) CYP3A4 in HepG2 cells after 48 h of treatment. Densitometry scanning data are presented as relative intensity of protein bands ± standard deviation of cytochrome over β-actin of two independent experiments (n = 4). Images of western blot analysis are representative of each isoform. CON, control; Ome, omeprazole; Dex, dexamethasone.
Similar to andrographolide, curcumin-treated cells did not exhibit detectable levels of CYP1A2 mRNA (Fig. 16). It does not affect significantly the mRNA and protein expression of CYP2D6 as well. However, there was significant induction of both mRNA and protein expression of CYP3A4 between the concentration range of 0.1 and 1 μmol/L (Figs. 16, 17). However, the mRNA induction at all concentrations was <20% as compared to dexamethasone. On the other hand, the relative protein expression of CYP3A4 was also less than twofold changes for the same range of concentrations.
Figure 16.

The effects of curcumin on the mRNA expression of (A) CYP1A2, (B) CYP2D6, and (C) CYP3A4 in HepG2 cells after 48 h of treatment. Data are presented as mean copy number ± standard deviation of three independent experiments (n = 9). *P < 0.05. CON, control; Ome, omeprazole; Dex, dexamethasone.
Figure 17.
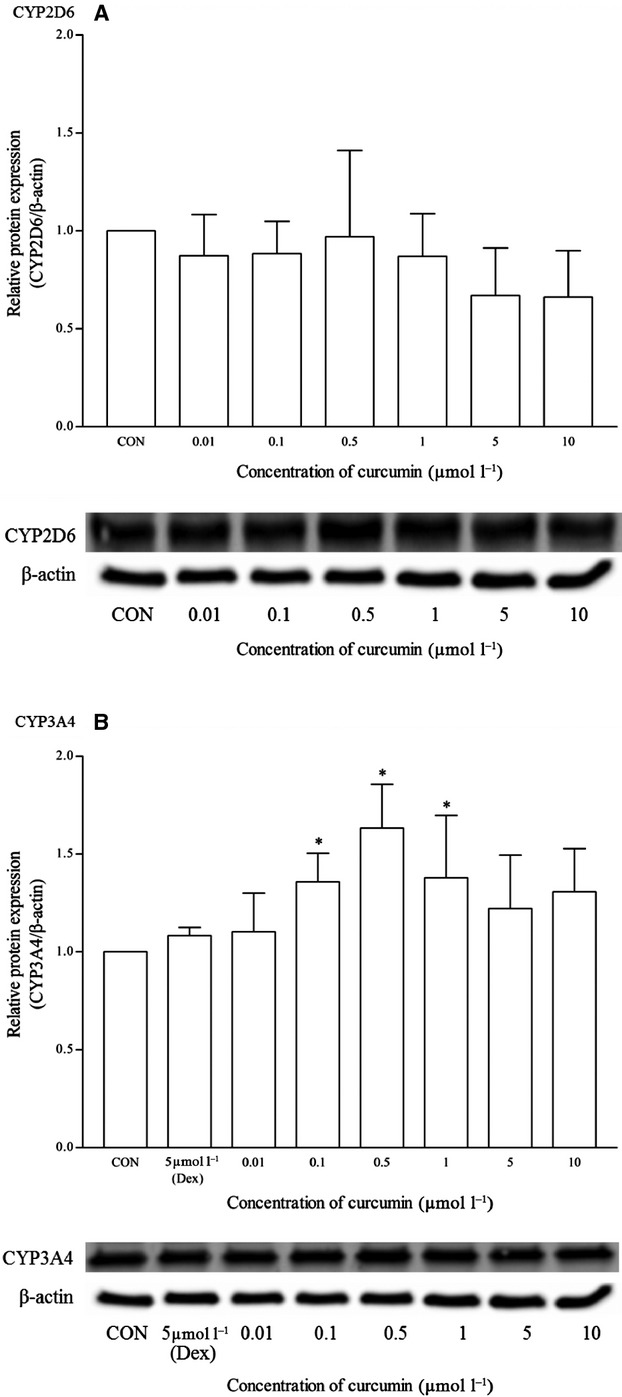
The effects of curcumin on the protein expression of (A) CYP2D6, and (B) CYP3A4 in HepG2 cells after 48 h of treatment. Densitometry scanning data are presented as relative intensity of protein bands ± standard deviation of cytochrome over β-actin of two independent experiments (n = 4). Images of western blot analysis are representative of each isoform *P < 0.05. CON, control; Dex, dexamethasone.
Lycopene did not appear to have any effects on the mRNA and protein expression of all the isoforms (Figs. 18, 19). As for resveratrol, only the highest concentration of 50 μmol/L elicited a significant mRNA CYP1A2 induction but remains insignificant at the protein expression level (Fig. 20). Resveratrol has no significant effects on both CYP2D6 and CYP3A4 mRNA expression, even though the CYP2D6 protein expression pattern suggests otherwise (Figs. 20 21). A statistically significant CYP2D6 protein induction was observed from 0.1 to 5 μmol/L in resveratrol-treated cells, with more than twofold changes in average at 0.1 μmol/L. Similarly, with the rest of the experiments, dexamethasone does not appear to produce a significant protein expression of CYP3A4 using western blot analysis.
Figure 18.
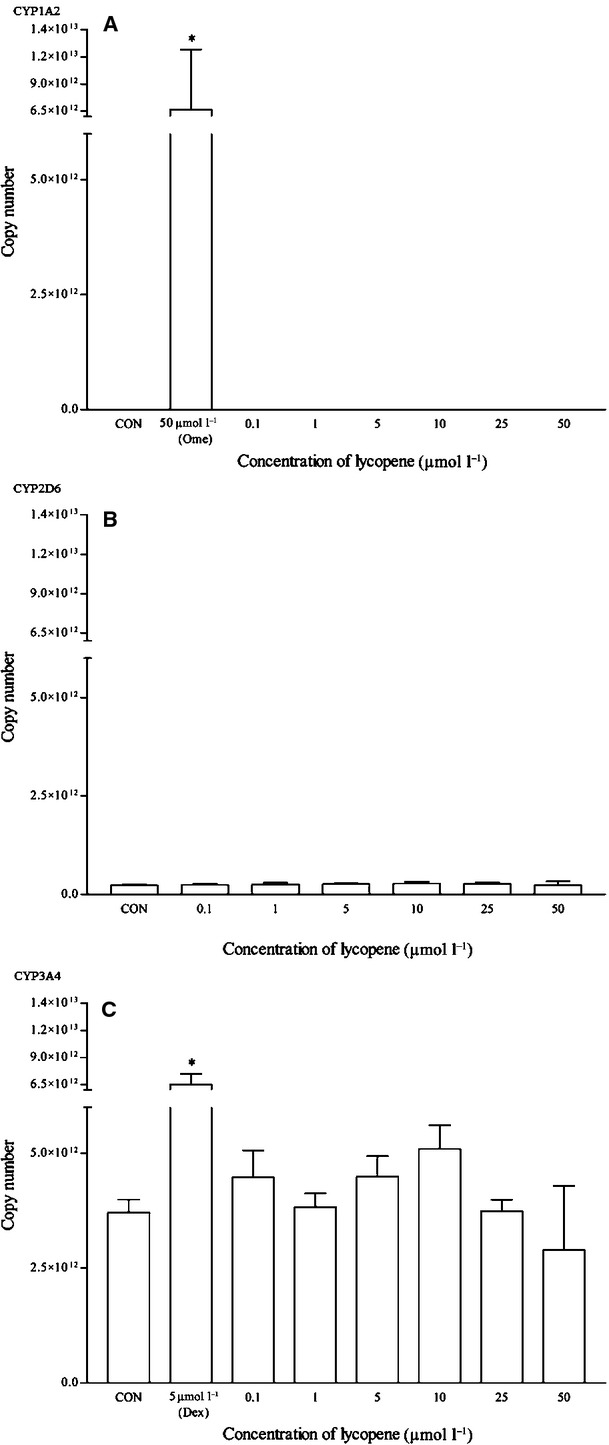
The effects of lycopene on the mRNA expression of (A) CYP1A2, (B) CYP2D6 and (C) CYP3A4 in HepG2 cells after 48 h of treatment. Data are presented as mean copy number ± standard deviation of three independent experiments (n = 9). *P < 0.05. CON, control; Ome, omeprazole; Dex, dexamethasone.
Figure 19.

The effects of lycopene on the protein expression of (A) CYP2D6 and (B) CYP3A4 in HepG2 cells after 48 h of treatment. Densitometry scanning data are presented as relative intensity of protein bands ± standard deviation of cytochrome over β-actin of two independent experiments (n = 4). Images of western blot analysis are representative of each isoform. CON, control; Dex, dexamethasone.
Figure 20.
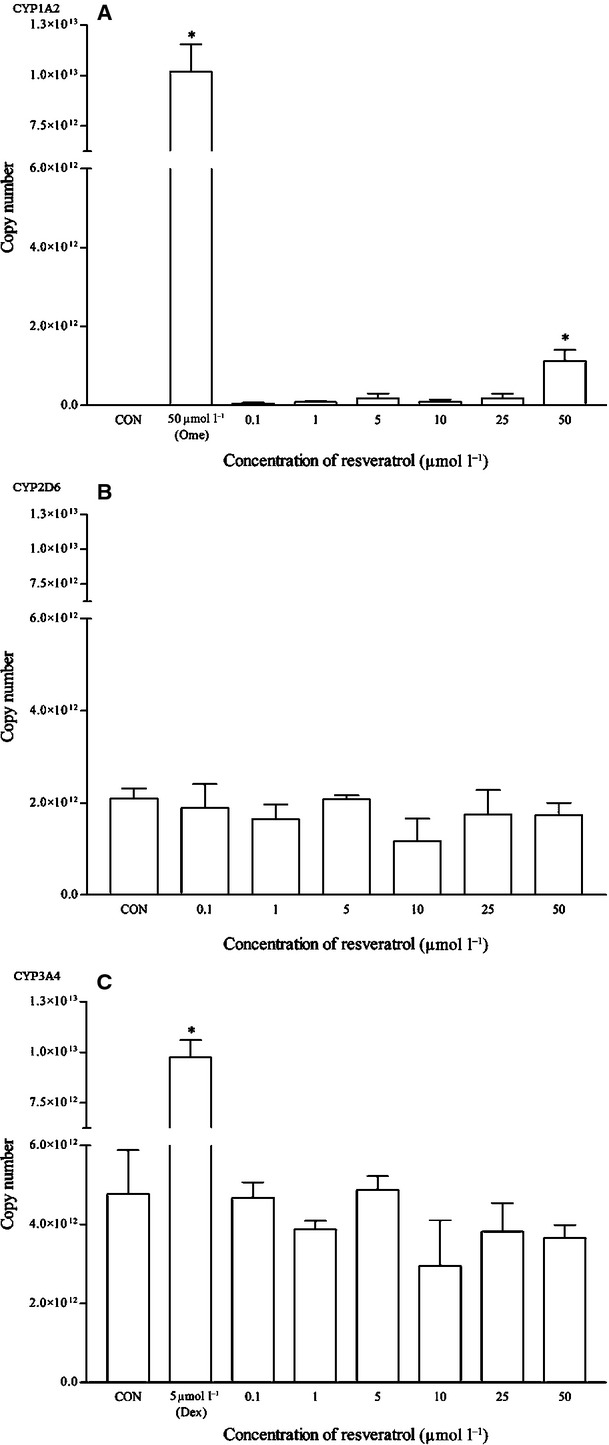
The effects of resveratrol on the mRNA expression of (A) CYP1A2, (B) CYP2D6, and (C) CYP3A4 in HepG2 cells after 48 h of treatment. Data are presented as mean copy number ± standard deviation of three independent experiments (n = 9). *P < 0.05. CON, control; Ome,omeprazole; Dex, dexamethasone.
Figure 21.

The effects of resveratrol on the protein expression of (A) CYP1A2, (B) CYP2D6, and (C) CYP3A4 in HepG2 cells after 48 h of treatment. Densitometry scanning data are presented as relative intensity of protein bands ± standard deviation of cytochrome over β-actin of two independent experiments (n = 4). Images of western blot analysis are representative of each isoform. CON, control; Ome, omeprazole; Dex, dexamethasone.
Discussion
Quantitative real-time PCR utilizing hydrolysis probes is an indirect assay system which yields fluorescence signals during primer extension in PCR amplification. It is a robust and quantitative way of determining mRNA levels in assays. In this study, a multiplex qRT-PCR was developed to simultaneously detect three major CYP isoforms and a reference gene. This assay was able to quantify the effects of various chemical entities on the mRNA expression of CYP isoforms in a rapid and economical manner. Cytochrome P450 enzymes play important roles in the metabolism of a variety of chemically diverse compounds and xenobiotics (Bowen et al. 2000; Wrighton et al. 2000). Pertubations in CYP metabolism can lead to drug interactions which may be clinically fatal, leading to significant toxicity or resulting in treatment failures (Rodeiro et al. 2008). Drug interaction mechanisms involving the CYP enzymes are categorized as either CYP enzyme inhibition or CYP enzyme induction. Although many important drug interactions are resulted from CYP450 inhibition, the effect on CYP450 induction-mediated interaction is another major concern for the healthcare industry (Lin 2006). Unlike inhibition of CYP450, induction is a slow regulatory process and occurs at the transcriptional level. CYP450 induction causes rapid CYP450 metabolism activity of a coadministered drug, resulting in subtherapeutic drug concentration and a reduction in therapeutic efficacy, which can lead to life-threatening incidences (Lin 2006). Xenobiotics in general have the ability to induce the mRNA expression of CYP isoforms and according to the FDA draft guideline for drug–drug interaction studies, the cytochrome induction properties of any xenobiotics or compounds can be determined by examining their mRNA levels in suitable test models (FDA 2006, 2012). Fahmi et al. (2010) stated that a fourfold and twofold cutoff of a mean fold maximum increase in CYP450 mRNA and enzymatic activity from human hepatocytes produced the lowest rates of false negatives as compared with using a cutoff maximum induction achieving 20–40% of the effects of a positive control. These criteria could be used as cutoff points for in vitro studies before proceeding to clinical trials.
In order to evaluate the multiplex qRT-PCR assay, mRNA expression profiles of CYP1A2, CYP2D6, and CYP3A4 by both known inducers and inhibitors were determined. Omeprazole and β-naphthoflavone are known inducers for CYP1A2 which induce the transcription of CYP1A2 via AhR activation (Diaz et al. 1990; Madan et al. 2003; Westerink and Schoonen 2007). As expected, both positive controls induced CYP1A2 mRNA expression and these were clearly observed from the multiplex RT-qPCR profile. Although omeprazole induced the mRNA expression of CYP1A2 from 1 μmol/L onwards and as high as 24-fold changes at 10 μmol/L, the same cannot be said for the corresponding protein expression (Figs. 3, 4). Omeprazole at 50 μmol/L was subsequently used a positive control for CYP1A2 induction in the following experiments with other compounds. Omeprazole produced no effects on the mRNA and protein expression of CYP2D6 but it significantly induced the expression of CYP3A4 at 0.1 μmol/L (<1.5-fold change) and protein expression at 1 and 5 μmol/L respectively. However, these effects were unlikely to be clinically significant for CYP3A4. On the contrary, omeprazole and its metabolite, 5′-O-desmethylomeprazole, are found to be time-dependent inhibitors of CYP3A4 (Shirasaka et al. 2013). On the other hand, furafylline is a potent and selective inhibitor of CYP1A2 in humans (Sesardic et al. 1990; Kelly and Sussman 2000). In this study, furafylline attenuated the mRNA CYP1A2 induction activity of omeprazole. These results clearly indicate the reliability of the multiplex RT-qPCR for detecting both CYP1A2 inducers and inhibitors at the transcriptional level.
Currently, there is no known clinical inducer for CYP2D6 at the transcriptional level (Ogu and Maxa 2000; Lynch and Price 2007; Pelkonen et al. 2008). Therefore, no specific control drug was used for CYP2D6. Only quinidine, which is a typical inhibitor for CYP2D6 that inhibits the enzymatic activity of CYP2D6, is used in CYP inhibition studies (Bramer and Suri 1999; Shin et al. 1999). In the RT-qPCR reactions, none of the controls used in this study affects the mRNA and protein expression of CYP2D6 significantly. However, ketoconazole was found to inhibit the mRNA expression of CYP2D6 significantly at high concentration (25 μmol/L). On the other hand, dexamethasone as a positive inducer of CYP3A4 clearly induced the mRNA expression of CYP3A4 at most concentrations tested and dexamethasone at 5 μmol/L concentration was used a positive control for subsequent experiments involving food and nutraceutical compounds. Results for both mRNA and western blot analysis appeared to be consistent in this case. Ketoconazole is shown to bind directly with the iron atom of the heme component within the CYP3A4 active site and is a potent inhibitor of the CYP3A4 enzyme (Ekroos and Sjogren 2006). On the other hand, ketoconazole is also found to inhibit the activation of PXR (Pregnane-X receptor) which is involved in the regulation of CYP3A4 mRNA expression (Duret et al. 2006; Huang et al. 2007). Interestingly, using the multiplex RT-qPCR, ketoconazole behaved like a CYP3A4 inhibitor at the transcriptional level only at a high concentration (25 μmol/L). The CYP1A2, CYP2D6, and CYP3A4 mRNA expression profile observed with the control drugs appeared to correspond well to previous studies. However, the same cannot be said for the western blot analysis. Omeprazole induces the mRNA expression of CYP1A2 but insignificantly for the protein expression. On the other hand, dexamethasone induces both the mRNA and protein expression of CYP3A4 significantly. Western blot appears to be an unreliable method to evaluate CYP protein expression. Recent investigations have revealed a rather poor correlation between mRNA and protein profiles (Ideker et al. 2001; Tian et al. 2004). Translation efficiency, protein half-life, experimental noises, and techniques used prominently influence the correlation between mRNA and protein abundance (Maier et al. 2009).
Andrographolide, a diterpenoid, did not show significant induction effects on all three isoforms using the multiplex RT-qPCR. These results were rather consistent with published results on CYP1A2 and CYP3A4 isoforms. Instead, both ethanolic extract and andrographolide are found to decrease the mRNA expression of CYP1A2, 2C9, and 3A4 in human hepatocytes (Pekthong et al. 2009). As for evaluating the effects of andrographolide on CYP enzymatic activities, Pekthong et al. (2008) derived IC50 and Ki values for CYP1A2, CYP2C9, and CYP3A4 using CYP inhibition assays and utilizing human microsomes. In the CYP1A2 assay, the IC50 value for β-naphthoflavone (positive control, inhibitor) in human microsomes was 0.085 μmol/L as compared with >100 μmol/L for andrographolide. Similarly for CYP2C9, the IC50 value for sulfaphenazole (positive control, inhibitor) was 1.01 μmol/L as compared with >100 μmol/L for andrographolide. As for CYP3A4, the effect of andrographolide was negligible (IC50 >200 μmol/L), as compared with ketoconazole (0.11 μmol/L). Andrographolide does not seem to have a significant inhibitory effect on CYP1A2, CYP2C9, and CYP3A4 at the enzymatic level as well.
On the other hand, bergamottin induced the mRNA expression of CYP1A2 from 1 μmol/L onwards with significant copy number values from 5 to 50 μmol/L. The fold changes were ∼11-fold increase at 1 μmol/L and this clearly indicates the CYP1A2 induction properties of this food compound. Our results clearly corresponded with another study, of which a 48 h exposure of cultured human hepatocytes to bergamottin resulted in increased levels of CYP1A2 protein and mRNA (Wen et al. 2002). Bergamottin, a furanocoumarin component of grapefruit juice, is a clinically known mechanism-based inactivator of CYP3A4 and contributes, in part, to the grapefruit juice–drug interaction. Grapefruit juice decreases presystemic metabolism via a mechanism-based inhibition of gut wall CYP3A4 and furanocoumarins are mainly involved in the pharmacokinetic interactions leading to increased side effects and toxicity of coadministered drugs (Diaconu et al. 2011; Lin et al. 2012). However, in this study, bergamottin does not appear to produce significant induction effects on either CYP2D6 or CYP3A4 using the multiplex PCR. Interestingly, bergamottin is a significant in vitro CYP1A2 inducer and in view that the induction could be clinically significant, appropriate clinical trials involving human subjects would be recommended.
Both curcumin and lycopene produce no significant or relevant induction effects on all three isoforms in the HepG2 cells. These results appear to concur with both in vivo (human trial) and in vitro experiments. A standardized curcuminoid/piperine preparation given orally to healthy subjects produced no meaningful changes in plasma Cmax, area under curve, clearance, elimination half-life or metabolite levels of midazolam, flurbiprofen, or paracetamol, indicating that this piperine-enhanced curcuminoid preparation is unlikely to result in a clinically significant interaction involving CYP3A, CYP2C9, or the paracetamol conjugation enzymes (Volak et al. 2013). In another experiment, both curcuma extracts and curcumin did not affect the mRNA expression of CYP3A4 significantly in intestinal cells (Graber-Maier et al. 2010). On the other hand, lycopene was also reported to have no activation potential on PXR-responsive genes like CYP3A4 in HepG2 cells (Ruhl et al. 2004). In addition, lycopene too does not inhibit the cytochrome P450 (CYP) 3A4-mediated drug metabolism (Sunaga et al. 2012). Lycopene, a member of the carotenoid family, found commonly in red pigmented fruit and vegetables is known to have significant antioxidant and pro-oxidant properties and is available in the market as supplements.
Resveratrol, a natural stilbene derivative compound commonly found in red wine or red grape extract is well known for its antioxidant and antiaging activities. It is known to be a mechanism-based inactivator of cytochrome P450 3A4 (CYP3A4) and inhibits significantly human CYP3A4-dependent transformation of cyclosporine, a CYP3A4 substrate (Regev-Shoshani et al. 2004). It is also a well-characterized aryl hydrocarbon receptor antagonist in mammalian cell lines (Aluru and Vijayan 2006). Resveratrol intervention in healthy subjects was found to inhibit the phenotypic indices of CYP3A4, CYP2D6, and CYP2C9 but induces the phenotypic index of 1A2, indicating the potential drug interactions in pharmacological doses (Chow et al. 2010). In the healthy subjects, 4 weeks of 1 g daily resveratrol administration resulted in a 16% decrease in the caffeine/paraxanthine metabolic ratio, suggesting an induction of CYP1A2 activity. It is worth noting that the decrease did not achieve 50% from the baseline, indicating weak to moderate induction. Using this multiplex PCR, only the highest concentration of 50 μmol/L elicited a significant effect on CYP1A2 mRNA expression, although induction was observed as low as 0.1 μmol/L and results appear to correspond with the published data.
In conclusion, a reliable multiplex RT-qPCR can be easily utilized to measure the CYP1A2, 2D6, and CYP3A4 induction properties of food and herbal compounds. Andrographolide, curcumin, and lycopene produced no significant cytochrome induction effects. On the other hand, bergamottin appeared to be a significant in vitro CYP1A2 inducer and resveratrol is a weak one. Examining the cytochrome induction properties of food and herbal compounds help complement CYP inhibition studies and provide proper labeling and safety caution for such products.
Acknowledgments
The authors would like to acknowledge the R&D Initiative Grant for supporting the drug–herb and drug–food interactions studies at IPharm.
Conflict of Interest
None declared.
References
- Aluru N, Vijayan MM. Resveratrol affects CYP1A expression in rainbow trout hepatocytes. Aquat. Toxicol. 2006;77:291–297. doi: 10.1016/j.aquatox.2005.12.010. [DOI] [PubMed] [Google Scholar]
- Boullata JI. Drug and nutrition interactions: not just food for thought. J. Clin. Pharm. Ther. 2013;38:269–271. doi: 10.1111/jcpt.12075. [DOI] [PubMed] [Google Scholar]
- Boullata JI, Hudson LM. Drug–nutrient interactions: a broad view with implications for practice. J. Acad. Nutr. Diet. 2012;112:506–517. doi: 10.1016/j.jada.2011.09.002. [DOI] [PubMed] [Google Scholar]
- Bowen WP, Carey JE, Miah A, McMurray HF, Munday PW, James RS, et al. Measurement of cytochrome P450 gene induction in human hepatocytes using quantitative real-time reverse transcriptase-polymerase chain reaction. Drug Metab. Dispos. 2000;28:781–788. [PubMed] [Google Scholar]
- Bramer SL, Suri A. Inhibition of CYP2D6 by quinidine and its effects on the metabolism of cilostazol. Clin. Pharmacokinet. 1999;37(Suppl. 2):41–51. doi: 10.2165/00003088-199937002-00005. [DOI] [PubMed] [Google Scholar]
- Chow HH, Garland LL, Hsu CH, Vining DR, Chew WM, Miller JA, et al. Resveratrol modulates drug- and carcinogen-metabolizing enzymes in a healthy volunteer study. Cancer Prev. Res. (Phila) 2010;3:1168–1175. doi: 10.1158/1940-6207.CAPR-09-0155. [DOI] [PMC free article] [PubMed] [Google Scholar]
- Diaconu CH, Cuciureanu M, Vlase L, Cuciureanu R. Food–drug interactions: grapefruit juice. Rev. Med. Chir. Soc. Med. Nat. Iasi. 2011;115:245–250. [PubMed] [Google Scholar]
- Diaz D, Fabre I, Daujat M, Saint Aubert B, Bories P, Michel H, et al. Omeprazole is an aryl hydrocarbon-like inducer of human hepatic cytochrome P450. Gastroenterology. 1990;99:737–747. doi: 10.1016/0016-5085(90)90963-2. [DOI] [PubMed] [Google Scholar]
- Dolton MJ, Roufogalis BD, McLachlan AJ. Fruit juices as perpetrators of drug interactions: the role of organic anion-transporting polypeptides. Clin. Pharmacol. Ther. 2012;92:622–630. doi: 10.1038/clpt.2012.159. [DOI] [PubMed] [Google Scholar]
- Duret C, Daujat-Chavanieu M, Pascussi JM, Pichard-Garcia L, Balaguer P, Fabre JM, et al. Ketoconazole and miconazole are antagonists of the human glucocorticoid receptor: consequences on the expression and function of the constitutive androstane receptor and the pregnane X receptor. Mol. Pharmacol. 2006;70:329–339. doi: 10.1124/mol.105.022046. [DOI] [PubMed] [Google Scholar]
- Ekroos M, Sjogren T. Structural basis for ligand promiscuity in cytochrome P450 3A4. Proc. Natl. Acad. Sci. USA. 2006;103:13682–13687. doi: 10.1073/pnas.0603236103. [DOI] [PMC free article] [PubMed] [Google Scholar]
- Fahmi OA, Kish M, Boldt S, Obach RS. Cytochrome P450 3A4 mRNA is a more reliable marker than CYP3A4 activity for detecting pregnane X receptor-activated induction of drug-metabolizing enzymes. Drug Metab. Dispos. 2010;38:1605–1611. doi: 10.1124/dmd.110.033126. [DOI] [PubMed] [Google Scholar]
- FDA. Guidance for Industry: Drug Interaction Studies — Study Design, Data Analysis, Implications for Dosing, and Labeling Recommendations - Draft Guidelines. 2006. MD Food and Drug Administration, Silver Spring.
- FDA. Guidance for Industry: Drug Interaction Studies —Study Design, Data Analysis, Implications for Dosing, and Labeling Recommendations - Draft Guidelines. 2012. MD Food and Drug Administration, Silver Spring.
- Graber-Maier A, Buter KB, Aeschlimann J, Bittel C, Kreuter M, Drewe J, et al. Effects of Curcuma extracts and curcuminoids on expression of P-glycoprotein and cytochrome P450 3A4 in the intestinal cell culture model LS180. Planta Med. 2010;76:1866–1870. doi: 10.1055/s-0030-1249980. [DOI] [PubMed] [Google Scholar]
- Gurley BJ, Swain A, Hubbard MA, Williams DK, Barone G, Hartsfield F, et al. Clinical assessment of CYP2D6-mediated herb–drug interactions in humans: effects of milk thistle, black cohosh, goldenseal, kava kava, St. John's wort, and Echinacea. Mol. Nutr. Food Res. 2008;52:755–763. doi: 10.1002/mnfr.200600300. [DOI] [PMC free article] [PubMed] [Google Scholar]
- Hellum BH, Hu Z, Nilsen OG. The induction of CYP1A2, CYP2D6 and CYP3A4 by six trade herbal products in cultured primary human hepatocytes. Basic Clin. Pharmacol. Toxicol. 2006;100:8. doi: 10.1111/j.1742-7843.2007.00011.x. [DOI] [PubMed] [Google Scholar]
- Huang H, Wang H, Sinz M, Zoeckler M, Staudinger J, Redinbo MR, et al. Inhibition of drug metabolism by blocking the activation of nuclear receptors by ketoconazole. Oncogene. 2007;26:258–268. doi: 10.1038/sj.onc.1209788. [DOI] [PubMed] [Google Scholar]
- Hukkanen J. Induction of cytochrome P450 enzymes: a view on human in vivo findings. Expert Rev. Clin. Pharmacol. 2012;5:569–585. doi: 10.1586/ecp.12.39. [DOI] [PubMed] [Google Scholar]
- Ideker T, Thorsson V, Ranish JA, Christmas R, Buhler J, Eng JK, et al. Integrated genomic and proteomic analyses of a systematically perturbed metabolic network. Science. 2001;292:929–934. doi: 10.1126/science.292.5518.929. [DOI] [PubMed] [Google Scholar]
- Jauregui-Garrido B, Jauregui-Lobera I. Interactions between antiarrhythmic drugs and food. Nutr. Hosp. 2012;27:1399–1407. doi: 10.3305/nh.2012.27.5.5925. [DOI] [PubMed] [Google Scholar]
- Kelly JH, Sussman NL. A fluorescent cell-based assay for cytochrome P-450 isozyme 1A2 induction and inhibition. J. Biomol. Screen. 2000;5:249–254. doi: 10.1177/108705710000500407. [DOI] [PubMed] [Google Scholar]
- Komoroski BJ, Zhang S, Cai H, Hutzler JM, Frye R, Tracy TS, et al. Induction and inhibition of cytochromes P450 by the St. John's wort constituent hyperforin in human hepatocyte cultures. Drug Metab. Dispos. 2004;32:512–518. doi: 10.1124/dmd.32.5.512. [DOI] [PubMed] [Google Scholar]
- Lin JH. CYP induction-mediated drug interactions: in vitro assessment and clinical implications. Pharm. Res. 2006;23:1089–1116. doi: 10.1007/s11095-006-0277-7. [DOI] [PubMed] [Google Scholar]
- Lin HL, Kenaan C, Hollenberg PF. Identification of the residue in human CYP3A4 that is covalently modified by bergamottin and the reactive intermediate that contributes to the grapefruit juice effect. Drug Metab. Dispos. 2012;40:998–1006. doi: 10.1124/dmd.112.044560. [DOI] [PMC free article] [PubMed] [Google Scholar]
- Lown KS, Bailey DG, Fontana RJ, Janardan SK, Adair CH, Fortlage LA, et al. Grapefruit juice increases felodipine oral availability in humans by decreasing intestinal CYP3A protein expression. J. Clin. Investig. 1997;99:2545–2553. doi: 10.1172/JCI119439. [DOI] [PMC free article] [PubMed] [Google Scholar]
- Lynch T, Price A. The effect of cytochrome P450 metabolism on drug response, interactions, and adverse effects. Am. Fam. Physician. 2007;76:391–396. [PubMed] [Google Scholar]
- Madan A, Graham RA, Carroll KM, Mudra DR, Burton LA, Krueger LA, et al. Effects of prototypical microsomal enzyme inducers on cytochrome P450 expression in cultured human hepatocytes. Drug Metab. Dispos. 2003;31:421–431. doi: 10.1124/dmd.31.4.421. [DOI] [PubMed] [Google Scholar]
- Maier T, Guell M, Serrano L. Correlation of mRNA and protein in complex iological samples. FEBS Lett. 2009;583:3966–3973. doi: 10.1016/j.febslet.2009.10.036. [DOI] [PubMed] [Google Scholar]
- Nelson DR, Koymans L, Kamataki T, Stegeman JJ, Feyereisen R, Waxman DJ, et al. P450 superfamily: update on new sequences, gene mapping, accession numbers and nomenclature. Pharmacogenetics. 1996;6:1–42. doi: 10.1097/00008571-199602000-00002. [DOI] [PubMed] [Google Scholar]
- Ogu CC, Maxa JL. Drug interactions due to cytochrome P450. Proc. (Bayl. Univ. Med. Cent.) 2000;13:421–423. doi: 10.1080/08998280.2000.11927719. [DOI] [PMC free article] [PubMed] [Google Scholar]
- Pekthong D, Martin H, Abadie C, Bonet A, Heyd B, Mantion G, et al. Differential inhibition of rat and human hepatic cytochrome P450 by Andrographis paniculata extract and andrographolide. J. Ethnopharmacol. 2008;115:432–440. doi: 10.1016/j.jep.2007.10.013. [DOI] [PubMed] [Google Scholar]
- Pekthong D, Blanchard N, Abadie C, Bonet A, Heyd B, Mantion G, et al. Effects of Andrographis paniculata extract and Andrographolide on hepatic cytochrome P450 mRNA expression and monooxygenase activities after in vivo administration to rats and in vitro in rat and human hepatocyte cultures. Chem. Biol. Interact. 2009;179:247–255. doi: 10.1016/j.cbi.2008.10.054. [DOI] [PubMed] [Google Scholar]
- Pelkonen O, Turpeinen M, Hakkola J, Honkakoski P, Hukkanen J, Raunio H. Inhibition and induction of human cytochrome P450 enzymes: current status. Arch. Toxicol. 2008;82:667–715. doi: 10.1007/s00204-008-0332-8. [DOI] [PubMed] [Google Scholar]
- Pirmohamed M. Drug-grapefruit juice interactions. BMJ. 2013;346:f1. doi: 10.1136/bmj.f1. [DOI] [PubMed] [Google Scholar]
- Regev-Shoshani G, Shoseyov O, Kerem Z. Influence of lipophilicity on the interactions of hydroxy stilbenes with cytochrome P450 3A4. Biochem. Biophys. Res. Commun. 2004;323:668–673. doi: 10.1016/j.bbrc.2004.08.141. [DOI] [PubMed] [Google Scholar]
- Roby CA, Anderson GD, Kantor E, Dryer DA, Burstein AH. St. John's wort: effect on CYP3A4 activity. Clin. Pharmacol. Ther. 2000;67:451–457. doi: 10.1067/mcp.2000.106793. [DOI] [PubMed] [Google Scholar]
- Rodeiro I, Donato MT, Lahoz A, Garrido G, Delgado R, Gomez-Lechon MJ. Interactions of polyphenols with the P450 system: possible implications on human therapeutics. Mini. Rev. Med. Chem. 2008;8:97–106. doi: 10.2174/138955708783498131. [DOI] [PubMed] [Google Scholar]
- Ruhl R, Sczech R, Landes N, Pfluger P, Kluth D, Schweigert FJ. Carotenoids and their metabolites are naturally occurring activators of gene expression via the pregnane X receptor. Eur. J. Nutr. 2004;43:336–343. doi: 10.1007/s00394-004-0475-1. [DOI] [PubMed] [Google Scholar]
- Sesardic D, Boobis AR, Murray BP, Murray S, Segura J, de la Torre R, et al. Furafylline is a potent and selective inhibitor of cytochrome P450IA2 in man. Br. J. Clin. Pharmacol. 1990;29:651–663. doi: 10.1111/j.1365-2125.1990.tb03686.x. [DOI] [PMC free article] [PubMed] [Google Scholar]
- Shimada T, Yamazaki H, Mimura M, Inui Y, Guengerich FP. Interindividual variations in human liver cytochrome P-450 enzymes involved in the oxidation of drugs, carcinogens and toxic chemicals: studies with liver microsomes of 30 Japanese and 30 Caucasians. J. Pharmacol. Exp. Ther. 1994;270:414–423. [PubMed] [Google Scholar]
- Shin JG, Soukhova N, Flockhart DA. Effect of antipsychotic drugs on human liver cytochrome P-450 (CYP) isoforms in vitro: preferential inhibition of CYP2D6. Drug Metab. Dispos. 1999;27:1078–1084. [PubMed] [Google Scholar]
- Shirasaka Y, Sager JE, Lutz JD, Davis C, Isoherranen N. Inhibition of CYP2C19 and CYP3A4 by omeprazole metabolites and their contribution to drug–drug interactions. Drug Metab. Dispos. 2013;41:1414–1424. doi: 10.1124/dmd.113.051722. [DOI] [PMC free article] [PubMed] [Google Scholar]
- Sunaga K, Ohkawa K, Nakamura K, Ohkubo A, Harada S, Tsuda T. Mechanism-based inhibition of recombinant human cytochrome P450 3A4 by tomato juice extract. Biol. Pharm. Bull. 2012;35:329–334. doi: 10.1248/bpb.35.329. [DOI] [PubMed] [Google Scholar]
- Tian Q, Stepaniants SB, Mao M, Weng L, Feetham MC, Doyle MJ, et al. Integrated genomic and proteomic analyses of gene expression in mammalian cells. Mol. Cell. Proteomics. 2004;3:960–969. doi: 10.1074/mcp.M400055-MCP200. [DOI] [PubMed] [Google Scholar]
- Venkatakrishnan K, Von Moltke LL, Greenblatt DJ. Human drug metabolism and the cytochromes P450: application and relevance of in vitro models. J. Clin. Pharmacol. 2001;41:1149–1179. doi: 10.1177/00912700122012724. [DOI] [PubMed] [Google Scholar]
- Volak LP, Hanley MJ, Masse G, Hazarika S, Harmatz JS, Badmaev V, et al. Effect of a herbal extract containing curcumin and piperine on midazolam, flurbiprofen and paracetamol (acetaminophen) pharmacokinetics in healthy volunteers. Br. J. Clin. Pharmacol. 2013;75:450–462. doi: 10.1111/j.1365-2125.2012.04364.x. [DOI] [PMC free article] [PubMed] [Google Scholar]
- Walsky RL, Boldt SE. In vitro cytochrome P450 inhibition and induction. Curr. Drug Metab. 2008;9:928–939. doi: 10.2174/138920008786485128. [DOI] [PubMed] [Google Scholar]
- Wen YH, Sahi J, Urda E, Kulkarni S, Rose K, Zheng X, et al. Effects of bergamottin on human and monkey drug-metabolizing enzymes in primary cultured hepatocytes. Drug Metab. Dispos. 2002;30:977–984. doi: 10.1124/dmd.30.9.977. [DOI] [PubMed] [Google Scholar]
- Westerink WM, Schoonen WG. Cytochrome P450 enzyme levels in HepG2 cells and cryopreserved primary human hepatocytes and their induction in HepG2 cells. Toxicol. In Vitro. 2007;21:1581–1591. doi: 10.1016/j.tiv.2007.05.014. [DOI] [PubMed] [Google Scholar]
- Wrighton SA, Schuetz EG, Thummel KE, Shen DD, Korzekwa KR, Watkins PB. The human CYP3A subfamily: practical considerations. Drug Metab. Rev. 2000;32:339–361. doi: 10.1081/dmr-100102338. [DOI] [PubMed] [Google Scholar]
- Yan Z, Caldwell GW. Metabolism profiling, and cytochrome P450 inhibition & induction in drug discovery. Curr. Top. Med. Chem. 2001;1:403–425. doi: 10.2174/1568026013395001. [DOI] [PubMed] [Google Scholar]
- Zanger U, Raimundo S, Eichelbaum M. Cytochrome P450 2D6: overview and update on pharmacology, genetics, biochemistry. Naunyn Schmiedebergs Arch. Pharmacol. 2004;369:23–37. doi: 10.1007/s00210-003-0832-2. [DOI] [PubMed] [Google Scholar]
- Zhou SF, Zhou ZW, Li CG, Chen X, Yu X, Xue CC, et al. Identification of drugs that interact with herbs in drug development. Drug Discov. Today. 2007;12:664–673. doi: 10.1016/j.drudis.2007.06.004. [DOI] [PubMed] [Google Scholar]
- Zlokarnik G, Grootenhuis PD, Watson JB. High throughput P450 inhibition screens in early drug discovery. Drug Discov. Today. 2005;10:1443–1450. doi: 10.1016/S1359-6446(05)03580-4. [DOI] [PubMed] [Google Scholar]


