

Abstract
Aims
To compare efficacy and safety of two, once-daily basal insulin formulations [insulin lispro protamine suspension (ILPS) vs. insulin glargine (glargine)] added to oral antihyperglycaemic medications (OAMs) and exenatide BID in suboptimally controlled type 2 diabetes (T2D) patients.
Methods
This 24-week, open-label, multicentre trial randomized patients to bedtime ILPS (n = 171) or glargine (n = 168). Non-inferiority of ILPS versus glargine was assessed by comparing the upper limit of 95% confidence intervals (CIs) for change in haemoglobin A1c (HbA1c) from baseline to week 24 (adjusted for baseline HbA1c) with non-inferiority margin 0.4%.
Results
Non-inferiority of ILPS versus glargine was demonstrated: least-squares mean between-treatment difference (ILPS minus glargine) (95% CI) was 0.22% (0.06, 0.38). Mean HbA1c reduction was less for ILPS- versus glargine-treated patients (−1.16 ± 0.84 vs. −1.40 ± 0.97%, p = 0.008). Endpoint HbA1c < 7.0% was achieved by 53.7% (ILPS) and 61.7% (glargine) (p = NS). Overall hypoglycaemia rates (p = NS) and severe hypoglycaemia incidence (p = NS) were similar. Nocturnal hypoglycaemia rate was higher in patients treated with ILPS versus glargine (p = 0.004). Weight gain was similar between groups (ILPS: 0.27 ± 3.38 kg; glargine: 0.66 ± 3.93 kg, p = NS). Endpoint total insulin doses were lower in patients treated with ILPS versus glargine (0.30 ± 0.17 vs. 0.37 ± 0.17 IU/kg/day, p < 0.001).
Conclusions
ILPS was non-inferior to glargine for HbA1c change over 24 weeks, but was associated with less HbA1c reduction and more nocturnal hypoglycaemia. Treat-to-target basal insulin therapy improves glycaemic control and is associated with minimal weight gain when added to OAMs and exenatide BID for suboptimally controlled T2D.
Keywords: exenatide, glucagon-like peptide-1 receptor agonist therapy, glycaemic control, HbA1c, hypoglycaemia, insulin glargine, insulin lispro protamine suspension, type 2 diabetes
Introduction
Many therapies are available for treatment of type 2 diabetes (T2D), and various clinical algorithms have been proposed to aid clinicians in the management of patients with T2D. Treatment usually starts with patient education, lifestyle-directed interventions to promote weight loss and increase physical activity, and with initiation of metformin (MET) [1, 2]. As metabolic deterioration occurs over time, additional glucose-lowering agents are usually required to achieve and maintain targeted haemoglobin A1c (HbA1c) goals [1, 2]. Initiation of insulin therapy is necessary for most T2D patients as β-cell function declines 1–3.
In addition to glycaemic efficacy, glucagon-like peptide-1 receptor agonist (GLP-1 RA) therapy has potential for weight loss with low risk of hypoglycaemia 4–14. In the comprehensive diabetes management algorithm for T2D by the American Association of Clinical Endocrinologists (AACE), GLP-1 RA therapy in combination with MET is a recommended option for treatment of patients with HbA1c values ≥7.5% or in combination with two oral antihyperglycaemic medications (OAMs) for asymptomatic patients with HbA1c > 9.0% 2. Exenatide twice daily (BID) monotherapy or in combination with OAMs suppresses post-breakfast and post-dinner glycaemic excursions, but has limited impact on fasting plasma glucose (FPG) levels 5,11–14. The combination of basal insulin with short-acting GLP-1 RA offers the advantage of complementary pharmacologic effects to control both fasting and postprandial plasma glucose (PPG) levels, respectively 1,2,4,6–14.
Once-daily ‘treat-to-target’ basal insulin regimens, which are focused on titration of doses to achieve an FPG target, have become the standard for initiation of insulin in T2D patients 1–3,15. For patients with persistently elevated FPG and HbA1c values despite treatment with a GLP-1 RA and OAMs, clinicians are faced with the choice of initiating basal insulin therapy with discontinuation of the GLP-1 RA [6, 7] or addition of insulin to the GLP-1 RA/OAM regimen 7–14. A recent nationwide audit by the Association of British Clinical Diabetologists (ABCD) in UK reported nearly 40% of exenatide patients were also taking concomitant insulin therapy, along with continued use of OAMs 7. The order of addition of exenatide and insulin was not assessed in this study 7. Two other observational cohort studies found that 25–30% of patients who received exenatide and basal insulin were started on basal insulin after exenatide. Patients in these studies experienced 0.4–1.2% HbA1c reduction irrespective of treatment order 8,9. Additional studies have shown improvement in glycaemic control in subjects who have insulin added to GLP-1 RA therapy 10–14,16.
The aim of this study was to evaluate and compare the efficacy and safety of two basal insulin analogues in T2D patients who have suboptimal glycaemic control while receiving stable doses of exenatide and one or two OAMs. The insulins used, insulin lispro protamine suspension (ILPS), a protamine-based basal insulin analogue (available in some European countries, Israel and Japan [17, 18]) and insulin glargine (glargine), have similar duration of glucose-lowering activity when administered once daily (at 0.8 IU/kg) 19.
Materials and Methods
Study Design and Objectives
This study was an open-label, randomized, active-control, parallel, 24-week clinical trial conducted between November 2007 and December 2009 at 49 study centres in the USA and Puerto Rico (NCT00560417, F3Z-US-IOPB). The primary objective was to determine whether ILPS was non-inferior to glargine as measured by change in HbA1c from baseline to 24-week endpoint [last observation carried forward (LOCF)] in T2D patients treated with exenatide BID plus MET with or without sulphonylurea (SU) or pioglitazone (PIO). Secondary measures included: percentage of patients with HbA1c < 7.0% and ≤6.5% at endpoint; seven-point self-monitored plasma glucose (SMPG) profiles; rate and incidence of patient-reported hypoglycaemia (overall, nocturnal, non-nocturnal and severe); weight change; insulin dose; adverse events (AEs) and treatment-emergent adverse events (TEAEs). The study was conducted in accordance with the International Conference on Harmonisation Guidelines for Good Clinical Practice and the Declaration of Helsinki. All patients provided written informed consent.
Patients were 18–74 years of age with T2D, taking exenatide 10 µg twice-daily plus MET (1500–2500 mg/day) with or without either SU (at least one-half maximal dose) or PIO (30–45 mg/day) for at least 3 months, with HbA1c ≥ 7.0% and ≤10% and body mass index (BMI) ≤45 kg/m2. Doses of OAMs at study entry were maintained throughout the trial, except that reduction or discontinuation of SU was allowed at investigator discretion if patients experienced hypoglycaemia not attributed to other common occurrences such as missed meals, short-term changes in diet or exercise or excess insulin treatment.
Patients were excluded from the study if they had a history of insulin therapy (outside of pregnancy or acute short-term use) in the prior 2 years, clinically significant haematologic, oncologic, renal, cardiac, hepatic or gastrointestinal disease, more than one episode of severe hypoglycaemia in the prior 6 months, or were receiving other antihyperglycaemic or weight loss drugs or chronic systemic glucocorticoids.
After an initial 2-week screening period, patients were randomly assigned to receive either ILPS or glargine once-daily at bedtime while continuing their pre-study OAM(s) and exenatide (Figure 1). Randomization was stratified by SU use and baseline HbA1c (≤8.5% or >8.5%). Insulin was started with 6 IU daily, and titrated using dosing algorithms to achieve FPG targets of 4.4–5.5 mmol/l for ILPS and 4.1–5.5 mmol/l for insulin glargine.
Figure 1.
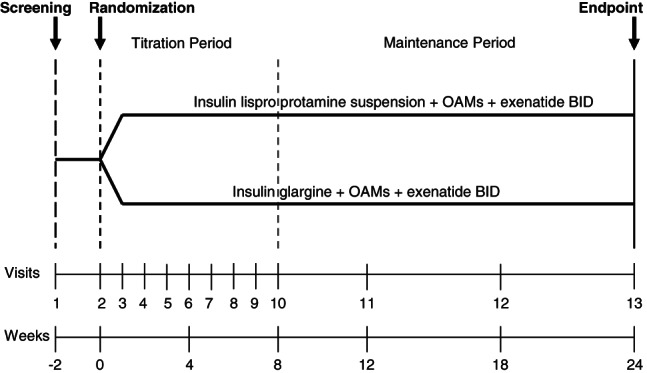
Study diagram.
ILPS and glargine have different pharmacokinetic/pharmacodynamic (PK/PD) profiles [19, 20]. Therefore, different dose adjustments based on FPG levels were used for these two insulins in order to optimize treatment for patients in both groups. The dose algorithm for ILPS (increments +6 to −4 units every week) was adapted from Fogelfeld et al. 2010 21 and Strojek et al. 2010 22. The dose algorithm for glargine (increments from +8 to −4 units every week) was adapted from Riddle et al. 2003 3 (Table 1).
Table 1.
Insulin dosing algorithms
| Insulin lispro protamine suspension | Insulin glargine | ||
|---|---|---|---|
| Fasting plasma glucose values (mmol/l) | Dose change (U) | Fasting plasma glucose values (mmol/l) | Dose change (U) |
| <3.1‡ | −4 | <3.1‡ | −4 |
| 3.1–4.4‡ | −2 | 3.1–4.0‡ | −2 |
| 4.4–5.5§ | 0 | 4.1–5.5§ | 0 |
| 5.5–7.7§ | +2 | 5.5–6.6§ | +2 |
| 7.8–10.0§ | +4 | 6.7–7.7§ | +4 |
| >10.0§ | +6 | 7.8–9.9§ | +6 |
| ≥10.0§ | +8 | ||
Adapted from Ref. 3.
At least one fasting plasma glucose since the last assessment.
During the dose titration period (first 8 weeks), dose adjustments were made at least weekly based on daily fasting plasma glucose levels until target level was reached or nocturnal/fasting hypoglycaemia occurred; during dose maintenance period, titrations were continued per respective algorithm as clinically needed.
During the first 8 weeks of the study, insulin dose was adjusted at least weekly to achieve an optimized dose for each patient. Thereafter, dose adjustments were performed if clinically needed according to the appropriate titration algorithm. HbA1c levels were measured by a central laboratory using high-pressure liquid chromatography (Bio-Rad Variant Turbo/Variant II; Bio-Rad Laboratories, Hercules, CA, USA and Dundee, Scotland). SMPG was measured by patients and recorded twice-daily before breakfast and dinner, and seven-point SMPG profiles [three pre-meal (including fasting before breakfast), three 2-h post-meal and one nocturnal (03:00 hours) were performed on three separate days in the 2 weeks prior to visits at baseline and at weeks 4, 8, 12, 18 and 24.
Safety was monitored throughout the study, and the occurrence and nature of AEs were recorded. Serious AEs were defined as events resulting in death, life-threatening experience, hospitalization or significant disability. Hypoglycaemia was defined as one or more signs or symptoms typically associated with hypoglycaemia, or plasma glucose (PG) ≤ 3.9 mmol/l 23. Severe hypoglycaemia was defined as any occurrence of neuroglycopaenic symptoms requiring assistance from another person with either a PG < 2.8 mmol/l or prompt recovery after oral carbohydrate, glucagon or intravenous glucose 23,24. Nocturnal hypoglycaemia was defined as any hypoglycaemic event between bedtime and waking. Non-nocturnal hypoglycaemia was defined as any event between waking and bedtime.
Statistical Methods
Power calculation indicated that 168 patients per treatment arm would provide 80% power to determine if ILPS is non-inferior to glargine when added to OAMs and exenatide BID, with a pre-specified margin of 0.4% difference in least-squares (LS) mean HbA1c change, assuming no true difference, 15% dropout rate and a standard deviation (s.d.) of 1.2 at a significance level of 0.05. This non-inferiority margin has been used in other treat-to-target basal insulin studies 21,22,25–29. All analyses were performed on the intention-to-treat population who had at least one post-baseline assessment by the LOCF method. The primary outcome (change in HbA1c from baseline to endpoint) was analysed using the analysis of covariance (ancova) model with treatment, baseline HbA1c and stratification variables [SU use and baseline HbA1c strata (≤8.5% and >8.5%)]. Non-inferiority of ILPS versus glargine in HbA1c change from baseline would be claimed if the upper limit of 95% confidence interval (CI) for treatment difference (ILPS minus glargine) was less than 0.4%. The endpoint SMPG profiles (average over 3-day values) were analysed with an ancova model with factors of treatment, stratification variables and baseline. No adjustments were made for multiple comparisons. Other continuous variables (weight and insulin dose) were analysed similarly using an ancova model with factors of treatment, stratification variables and baseline (if applicable). Hypoglycaemia rate was analysed with a negative binomial model. A logistic regression model was used to analyse the proportion of subjects achieving HbA1c targets of <7.0% and ≤6.5%. Other categorical variables were analysed using Fisher’s exact test to compare treatments.
Results
Patient Disposition
Three hundred and thirty-nine patients were randomized, and 171 were assigned to ILPS and 168 to glargine (Figure 2). Approximately 90% of ILPS- and glargine-treated patients completed the study. Reasons for discontinuation from the study were similar for the two insulin treatment groups.
Figure 2.
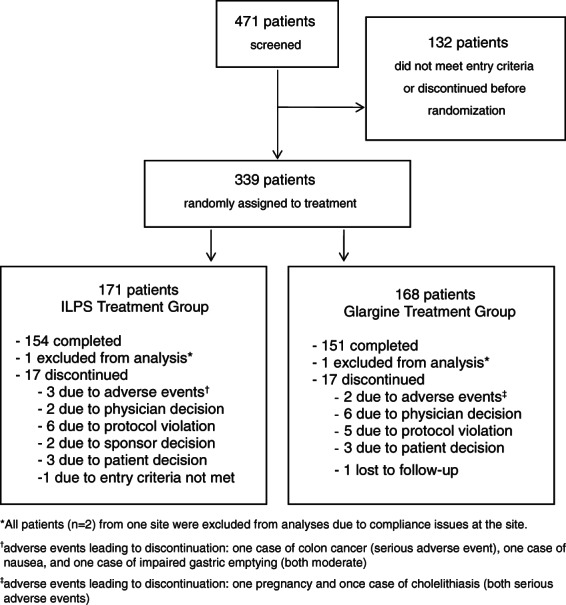
Patient disposition diagram.
Patient Demographics and Baseline Characteristics
Baseline demographics and disease characteristics of the cohort are presented in Table 2. Overall, the mean age was 56.4 years with 50.1% women. Mean BMI was 34.9 kg/m2. Mean duration of diabetes was 9.9 years. Mean baseline HbA1c was 8.2 ± 0.8%. The two treatment groups were largely comparable, although more ILPS-treated patients were women (p = 0.051) and more received concomitant treatment with MET/PIO (p = 0.0289), and more glargine-treated patients received MET only (p = 0.033). Distribution by ethnicity was similar between the two treatment groups.
Table 2.
Baseline demographics and characteristics of randomized patients*
| ILPS(n = 171) | Glargine(n = 168) | p Value | Overall(n = 339) | |
|---|---|---|---|---|
| Age, years | 56.5 ± 9.7 | 56.2 ± 9.3 | 0.797 | 56.4 ± 9.5 |
| Sex, n (%) | ||||
| Men | 76 (44.4) | 93 (55.4) | 0.051 | 169 (49.9) |
| Women | 95 (55.6) | 75 (44.6) | 170 (50.1) | |
| Ethnicity, n (%) | ||||
| African American | 13 (7.6) | 14 (8.3) | 0.756 | 27 (8.0) |
| Asian | 7 (4.1) | 6 (3.6) | 13 (3.8) | |
| Hispanic | 21 (12.3) | 17 (10.1) | 38 (11.2) | |
| Native American | - | 1 (0.6) | 1 (0.3) | |
| White | 130 (76.0) | 130 (77.4) | 260 (76.7) | |
| Duration of diabetes, years | 9.5 ± 6.0 | 10.3 ± 6.6 | 0.245 | 9.9 ± 6.3 |
| Baseline HbA1c, % | 8.21 ± 0.79 | 8.22 ± 0.80 | 0.888 | 8.22 ± 0.79 |
| Baseline weight, kg | 101.6 ± 18.7 | 102.3 ± 19.7 | 0.718 | 102.0 ± 19.2 |
| Baseline body mass index, kg/m2 | 34.9 ± 5.2 | 34.8 ± 5.2 | 0.800 | 34.9 ± 5.2 |
| Concomitant OAMs, n (%) | ||||
| Metformin only | 40 (23.4) | 47 (28.0) | 0.033 | 87 (25.7) |
| Metformin/sulphonylurea | 105 (61.4) | 104 (61.9) | 0.949 | 209 (61.7) |
| Metformin/pioglitazone | 22 (12.9) | 10 (6.0) | 0.029 | 32 (9.4) |
HbA1c, haemoglobin A1c; ILPS, insulin lispro protamine suspension; OAMs, oral antihyperglycaemic medications; s.d., standard deviation.
Values are presented as mean ± s.d. unless otherwise noted. p Values compare ILPS and glargine treatment groups.
Glycaemic Control
At 24-week endpoint, LS mean difference in HbA1c change from baseline between treatment groups (ILPS minus glargine) was 0.22% (95% CI: 0.06–0.38), demonstrating non-inferiority of ILPS to glargine. Mean reduction in HbA1c was less for ILPS-treated patients than glargine-treated patients (Table 3). There was no significant difference in the percentage of patients from both treatment groups who achieved HbA1c <7.0% or ≤6.5%. Endpoint FPG levels were similar between treatment groups; however, mean endpoint postprandial PG values were higher in patients treated with ILPS versus glargine (Table 3; Figure 3). SMPG values post-morning meal, and before and after the evening meal were significantly higher for ILPS- versus glargine-treated patients (Figure 3).
Table 3.
Endpoint and change at endpoint values for efficacy and safety assessments*
| ILPS (n = 171) | Glargine (n = 168) | p Value | |
|---|---|---|---|
| Endpoint HbA1c, % | 7.04 ± 0.81 | 6.83 ± 0.78 | 0.008 |
| Mean HbA1c change, % | −1.16 ± 0.84 | −1.40 ± 0.97 | 0.008 |
| Patients achieving HbA1c < 7.0%, n (%) | 87 (53.7) | 100 (61.7) | 0.177 |
| Patients achieving HbA1c < 7.0% with no hypoglycaemia, n (%) | 17 (10.0) | 19 (11.4) | 0.727 |
| Patients achieving HbA1c ≤ 6.5%, n (%) | 46 (28.4) | 63 (38.9) | 0.060 |
| Patients achieving HbA1c ≤ 6.5% with no hypoglycaemia, n (%) | 12 (7.1) | 12 (7.2) | 1.000 |
| Endpoint fasting plasma glucose, mmol/l | 7.20 ± 1.75 | 7.05 ± 1.61 | 0.179 |
| Endpoint postprandial plasma glucose, mmol/l | 8.78 ± 2.04 | 8.11 ± 1.69 | <0.001 |
| Overall hypoglycaemia incidence, n (%) | 120 (70.6) | 125 (74.9) | 0.394 |
| Overall number of hypoglycaemia episodes | 1248 | 1371 | 0.394 |
| Overall hypoglycaemia rate, episodes/patient/year | 16.27 ± 23.19 | 18.05 ± 24.59 | 0.570 |
| Nocturnal hypoglycaemia rate, episodes/patient/year | 4.88 ± 8.43 | 3.01 ± 7.21 | 0.004 |
| Non-nocturnal hypoglycaemia rate, episodes/patient/year | 11.36 ± 19.16 | 14.83 ± 21.00 | 0.044 |
| Severe hypoglycaemia incidence, n (%) | 3 (1.8) | 0 | 0.249 |
| Insulin dose, IU | 31.1 ± 18.9 | 37.9 ± 18.5 | <0.001 |
| Insulin dose, IU/kg/day | 0.30 ± 0.17 | 0.37 ± 0.17 | <0.001 |
| Weight gain, kg | 0.27 ± 3.38 | 0.66 ± 3.93 | 0.343 |
| Patients with ≥1 serious adverse event, n (%) | 9 (5.3) | 5 (3.0) | 0.414 |
HbA1c, haemoglobin A1c; ILPS, insulin lispro protamine suspension; s.d., standard deviation.
Values presented as mean ± s.d. unless otherwise indicated.
Figure 3.
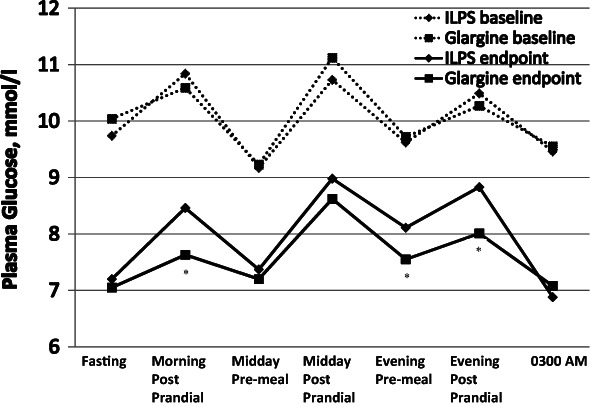
Self-monitored plasma glucose profiles. The asterisk indicates time periods when insulin lispro protamine suspension (ILPS) and glargine were significantly different (p < 0.05).
Hypoglycaemia and Safety Parameters
Overall hypoglycaemia rate and severe hypoglycaemia incidence in the ILPS and glargine treatment groups were similar (Table 3). Although a higher nocturnal hypoglycaemia rate was observed in patients treated with ILPS compared with patients treated with glargine, ILPS treatment was associated with a lower rate of non-nocturnal hypoglycaemia. The total daily insulin dose was significantly lower in patients treated with ILPS versus glargine. Mean weight gain was similar between groups.
Serious AEs during this trial and AEs leading to study discontinuation were infrequent, and the rates were similar in both treatment groups (Table 3 and Figure 2). Three patients treated with ILPS discontinued the study; reasons for discontinuation included one case of colon cancer, one case of nausea and one case of impaired gastric emptying (both moderate). Two patients treated with glargine discontinued the study; reasons for discontinuation were one pregnancy and one case of cholelithiasis. For TEAEs, 86 ILPS-treated patients (50.3%) experienced at least one TEAE versus 110 patients (65.5%) in the glargine treatment group (p = 0.006). The only individual TEAE that was significantly different between treatment groups was viral gastroenteritis [ILPS: 2 patients (1.2%), glargine: 12 patients (7.2%); p = 0.006]. No deaths occurred in this study.
Oral Antihyperglycaemia Medications
Concomitant OAM treatment was associated with clinical response in both treatment arms (Table 4). The MET/PIO subgroups showed 0.35–0.36% greater HbA1c reductions compared with MET/SU subgroups, but the difference was statistically significant only for the ILPS arm. In addition, the MET/PIO subgroup had lower endpoint insulin dose in both arms, but the differences were not statistically significant. Patients on MET-only lost weight, while patients on other OAM combinations gained weight. For both ILPS and glargine, overall hypoglycaemia rates were significantly lower for the MET-only subgroup versus the MET/SU subgroup. Among ILPS-treated patients, overall hypoglycaemia rates were also lower in the MET/PIO subgroup than in the MET/SU subgroup. Nocturnal hypoglycaemia was significantly lower for the MET-only subgroup versus MET/SU subgroup for ILPS-treated patients. For non-nocturnal hypoglycaemia, the MET-only subgroup had significantly lower rate versus MET/SU subgroup for both glargine- and ILPS-treated patients. The non-noctural hypoglycaemia rate was significantly lower for the MET/PIO subgroup versus MET/SU subgroup for ILPS-treated patients. Among patients treated with ILPS, there were two episodes of severe hypoglycaemia in the MET/SU subgroup, none in the MET-only subgroup, and one in the MET/PIO subgroup (p = 0.248 across all subgroups). No episodes of severe hypoglycaemia occurred in any of the glargine-treated subgroups. Despite comparable numbers of patients receiving SU (Table 2), only 13 ILPS-treated patients (12.0%) had their SU dose reduced or discontinued as compared with 28 glargine-treated patients (25.7%; p = 0.015).
Table 4.
Safety and efficacy endpoints by OAM subgroup
| Subgroup | Change in HbA1c (%) | Endpoint insulin dose (IU/kg/day) | Weight change (kg) | Hypo rate (episodes/patient/year) | Nocturnal hypo rate (episodes/patient/year) | Non-nocturnal hypo rate (episodes/patient/year) | |||||||
|---|---|---|---|---|---|---|---|---|---|---|---|---|---|
| Mean | p Value* | Mean | p Value* | Mean | p Value* | Mean | p Value* | Mean | p Value* | Mean | p Value* | ||
| ILPS-treated patients | MET/SU (n = 105) | −1.11 | — | 0.31 | — | 0.66 | — | 21.47 | — | 5.52 | — | 15.89 | — |
| MET (n = 40) | −1.14 | 0.642 | 0.34 | 0.290 | −1.07 | 0.013 | 1.66 | <0.001 | 0.41 | 0.001 | 1.03 | <0.001 | |
| MET/PIO (n = 22) | −1.47 | 0.005 | 0.22 | 0.099 | 0.72 | 0.980 | 6.57 | 0.009 | 3.93 | 0.627 | 2.64 | 0.003 | |
| Glargine-treated patients | MET/SU (n = 104) | −1.35 | — | 0.36 | — | 1.08 | — | 20.52 | — | 2.22 | — | 17.72 | — |
| MET (n = 47) | −1.43 | 0.141 | 0.40 | 0.084 | −0.24 | 0.201 | 2.70 | <0.001 | 0.48 | 0.061 | 2.22 | <0.001 | |
| MET/PIO (n = 10) | −1.70 | 0.115 | 0.30 | 0.568 | 0.50 | 0.906 | 16.06 | 0.682 | 0.85 | 0.454 | 15.21 | 0.848 | |
Hypo, hypoglycaemia; ILPS, insulin lispro protamine suspension; MET, metformin; OAM, oral anytihyperglycaemic medication; PIO, pioglitazone; SU, sulphonylurea.
p Values compare other (OAM) subgroups to MET/SU subgroup within each insulin treatment group.
Discussion
This study is the first randomized controlled trial to compare addition of once-daily basal insulins, ILPS or glargine, in T2D patients who are not at optimal glycaemic control with combined exenatide BID/OAM therapy. ILPS was found to be non-inferior to glargine in change in HbA1c from baseline to the 24-week endpoint based on a pre-specified margin of 0.4%, although glargine was associated with greater HbA1c change and lower endpoint HbA1c. The SMPG profiles with either basal insulin treatment group showed marked improvement in FPG and preprandial values from baseline (Figure 3). For both insulin treatment groups, postprandial excursions were similar at baseline and endpoint, indicating continued efficacy of exenatide BID. In studies where basal insulin was added to OAMs (without exenatide BID), T2D patients showed distinctly different SMPG profiles with greater post-breakfast and post-dinner glycaemic excursions 3,15,30–32. Endpoint FPG values were substantially above target levels for both treatment group; however, FPG values were within the range observed in previous treat-to-target studies (5.6–7.4 mmol/l) 3,15,30–32.
More than half of the patients in each treatment group achieved the target HbA1c of <7% (Table 3). Although there was no statistically significant difference between treatment groups, a greater percentage of glargine-treated patients achieved targets of HbA1c < 7.0% and ≤6.5%. In both treatment groups, only a small proportion of patients who achieved these HbA1c targets did so without experiencing hypoglycaemia. This suggests that concerns about hypoglycaemia may be the reason mean endpoint FPG concentrations were above target levels, although higher incidence of hypoglycaemia in both groups was probably related to the high proportion of SU use among patients in this study (Table 4).
Addition of basal insulins to ongoing exenatide/OAM treatment was associated with a small increase in weight (weight gain of <0.7 kg in both treatment groups) in this study. This weight gain was generally smaller than that reported in treat-to-target glargine/OAM trials (1.9–3.0 kg) 3,25–28 and less than what might have been expected for the change in HbA1c at endpoint (˜2 kg for every 1% decrease in HbA1c) 33. Data from head-to-head comparison studies of glargine and GLP-1 RAs (exenatide BID or QW or liraglutide) in patients with suboptimally controlled T2D indicated that ILPS treatment improved HbA1c and reduced weight as compared with glargine treatment 34. Mean insulin requirements for both basal analogue groups in this study (0.30–0.37 IU/kg/day) were generally lower than in other studies adding basal insulins to previous OAM therapy (0.40–0.80 IU/kg/day) 3,15,30–32.
A recent head-to-head PK/PD study demonstrated longer duration of action for patients treated with glargine versus ILPS (at 0.6 IU/kg) 20. This may account for the higher rate of non-nocturnal hypoglycaemia and greater need for SU dose adjustments with glargine, and more nocturnal hypoglycaemia in patients treated with ILPS observed in this trial, although concomitant SU use may have impacted these observed hypoglycaemia rates as mentioned. Significantly greater insulin exposure (area under the baseline-corrected serum insulin concentration versus time curve from time 0 to 24 h) with ILPS versus glargine 20, as well as differences in SU dosage adjustments, may have also contributed to the lower dose requirements for ILPS. It is also possible that nocturnal hypoglycaemia may have curtailed dose up-titrations of ILPS. The differing titration algorithms used in this study, with slightly more aggressive glycaemic targets for glargine (Table 1), may also have contributed to the differences in HbA1c and PPG reductions in patients treated with glargine, who may have experienced greater nocturnal hypoglycaemia than otherwise would have been observed with titrations identical to those in patients treated with ILPS.
Two trials of ILPS versus glargine as starter insulins in patients with T2D treated with OAMs (but not exenatide) have been reported. Esposito et al. 30 did not demonstrate any between-group differences in hypoglycaemia rates with once-daily ILPS versus glargine, possibly due to protocol-specified holding of evening SU doses; endpoint total daily dose was lower for patients treated with ILPS versus glargine (0.61 ± 0.15 and 0.67 ± 0.14 IU/kg/day; mean difference 0.06 IU/kg/day, CI −0.115 to −0.004) 30 as was observed in this study. Strojek et al. 22 found higher nocturnal hypoglycaemia rates (and more severe hypoglycaemia as well) in ILPS-treated patients. However, in that study, twice-daily ILPS therapy was allowed, with 55% of ILPS-treated patients requiring split therapy to bring pre-dinner PG levels to specified targets, and no SU dose adjustments were allowed per protocol 22. For patients receiving once-daily ILPS, total daily dose was significantly lower in patients treated with ILPS versus glargine (0.26 ± 0.14 vs. 0.35 ± 0.20 IU/kg; p < 0.001), and nocturnal hypoglycaemia rates did not differ 22.
Subgroup analyses for this study showed that, for both basal insulin groups, overall hypoglycaemia rate was higher with MET/SU and MET/PIO groups compared with MET-only group. Interestingly, hypoglycaemia rates in the MET/SU group were similar in the ILPS and glargine arms despite the fact that twice as many glargine-treated patients had their SU dose reduced or discontinued. Reduction by one-half or discontinuation of SU with initiation of exenatide therapy is generally recommended [4, 12, 35]. This may be even more important if the clinician contemplates adding basal insulins to exenatide/SU therapy in order to reduce the risk of daytime hypoglycaemia with glargine and nocturnal hypoglycaemia with ILPS treatment, and possibly also to minimize weight gain with either insulin.
The number of serious adverse events (SAEs) reported did not differ significantly among patients treated with ILPS versus glargine and the majority of SAEs were considered consistent with T2D. No new safety risks were identified and the safety risk profile for ILPS remains unchanged.
Basal insulin added to exenatide plus OAMs is consistent with the joint position statement of the American Diabetes Association and The European Association for the Study of Diabetes and the recent AACE comprehensive diabetes management algorithm on the management of hyperglycaemia in T2D 1,2, which list combination of MET plus GLP-1 RA as a dual therapy option and MET plus GLP-1 RA plus insulin as a possible triple therapy combination option. Further, these guidelines state that when advancing from dual to triple therapy, the use of insulin as the third therapy often gives the most robust response 1. Adding basal insulin to regimens containing GLP-1 RAs has been noted to be more logical than the converse order (GLP-1 RA added to basal insulin) when progressive antihyperglycaemic therapy in T2D is required 10.
Limitations of this study include the imbalance in concomitant OAM therapies that the patients in each treatment arm were taking at baseline and continued throughout the study, although importantly, randomization was stratified for SU use. Compared with ILPS-treated patients, significantly more glargine-treated patients received concomitant treatment with MET only and significantly fewer received treatment with MET/PIO. Reduction or discontinuation of SUs was allowed per protocol for hypoglycaemia; however, this was not balanced between comparator arms and might have resulted in differences in efficacy and safety outcomes between the two treatment groups. This study was not powered to allow for analyses of results by ethnic subgroups.
In conclusion, ILPS was non-inferior to glargine for HbA1c change over 24 weeks at the pre-specified non-inferiority margin of 0.4%. Compared with glargine, ILPS-treated patients achieved a smaller change in HbA1c with more nocturnal hypoglycaemia, but similar overall hypoglycaemia rate, and minimal weight gain. Clinicians must weigh the relative merits of differing therapies for their patients based on many factors (including efficacy, side effects, comorbidities and cost) and in relation to individualized glycaemic targets 1. Once-daily basal insulin added to exenatide plus OAMs was well-tolerated in this study and appears to substantially improve HbA1c and to allow a significant number of patients with suboptimally controlled T2D treated with OAMs and exenatide to reach glycaemic targets while experiencing minimal weight gain.
Acknowledgments
This study was funded by Eli Lilly and Company. We thank all investigators for their participation in this study (a list of all participating centres is provided as supplementary material). The authors would also like to thank Dr Byron J. Hoogwerf of Eli Lilly and Company for critical review and helpful comments on the manuscript; Kristine K. Schneider for her contributions to the design of the study and the interpretation of data; Barbara Nambu and Gina Coviello, MS of inVentiv Health Clinical for editorial assistance in preparing this manuscript.
Conflict of Interest
R. F. A., T. C. B., J. K. W. and D. R. L. were principal investigators for the study and contributed to the interpretation of data and the writing of the manuscript; H. H. J., S. A. M. and J. A. J. contributed to the design and analysis of the study, the interpretation of data and writing of the manuscript. J. G. J. contributed to the interpretation of data and writing of the manuscript. All authors approved the final version of the manuscript.
H. H. J., J. G. J., S. A. M. and J. A. J. are employees of Eli Lilly and Company and/or one of its subsidiaries and are minor stockholders of Eli Lilly and Company. R. F. A. has received research funding from Eli Lilly and Company, GlaxoSmithKline, Sanofi-Aventis, Novartis, Novo Nordisk Inc., Merck and Reata Pharmaceuticals, and serves on speaker’s bureaus for Bristol-Myers Squibb and AstraZeneca. T. C. B. has received clinical research support from Eli Lilly and Company, Amylin and Novo Nordisk Inc., and serves on speaker’s bureaus for Lilly, Amylin, Novo Nordisk, Novartis, Sanofi-Aventis and Merck. J. K. W. has received research funding from Eli Lilly and Company, Novartis and Novo Nordisk Inc., and serves on speaker’s bureaus for Eli Lilly and Company and Sanofi-Aventis. D. R. L. has no conflicts of interest to report. This study was funded by Eli Lilly and Company, Indianapolis, Indiana.
References
- 1.Inzucchi SE, Bergenstal RM, Buse JB. Management of hyperglycaemia in type 2 diabetes: a patient-centered approach. Position statement of the American Diabetes Association (ADA) and the European Association for the Study of Diabetes (EASD) Diabetologia. 2012;55:1577–1596. doi: 10.1007/s00125-012-2534-0. et al. [DOI] [PubMed] [Google Scholar]
- 2.Garber AJ, Abrahamson MJ, Barzilay JI. AACE comprehensive diabetes management algorithm. Endocr Pract. 2013;19:327–336. doi: 10.4158/endp.19.2.a38267720403k242. et al. [DOI] [PubMed] [Google Scholar]
- 3.Riddle MC, Rosenstock J, Gerich J on behalf of the Insulin Glargine 4002 Study Investigators. The treat-to-target trial: randomized addition of glargine or human NPH insulin to oral therapy of type 2 diabetic patients. Diabetes Care. 2003;26:3080–3086. doi: 10.2337/diacare.26.11.3080. [DOI] [PubMed] [Google Scholar]
- 4.Kendall DM, Riddle MC, Rosenstock J. Effects of exenatide (exendin-4) on glycemic control over 30 weeks in patients with type 2 diabetes treated with metformin and a sulfonylurea. Diabetes Care. 2005;28:1083–1091. doi: 10.2337/diacare.28.5.1083. et al. [DOI] [PubMed] [Google Scholar]
- 5.Zinman B, Hoogwerf BJ, Durán García S. The effect of adding exenatide to a thiazolidinedione in suboptimally controlled type 2 diabetes: a randomized trial. Ann Intern Med. 2007;146:477–485. doi: 10.7326/0003-4819-146-7-200704030-00003. et al. [DOI] [PubMed] [Google Scholar]
- 6.Rosenstock J, Fonseca V. Missing the point: substituting exenatide for non-optimized glargine: going from bad to worse! Diabetes Care. 2007;30:2972–2973. doi: 10.2337/dc07-1592. [DOI] [PubMed] [Google Scholar]
- 7.Thong KY, Jose B, Sukumar N. Safety, efficacy and tolerability of exenatide in combination with insulin in the Association of British Clinical Diabetologists nationwide exenatide audit. Diabetes Obes Metab. 2011;13:703–710. doi: 10.1111/j.1463-1326.2011.01393.x. et al. [DOI] [PubMed] [Google Scholar]
- 8.Pawaskar M, Li Q, Hoogwerf BJ, Reynolds MW, Lee LJ, Fonseca V. Clinical outcomes of concomitant therapy of exenatide twice daily and basal insulin in patients with type 2 diabetes mellitus: a retrospective database analysis in the United States. Endocr Pract. 2012;18:700–711. doi: 10.4158/EP11367.OR. [DOI] [PubMed] [Google Scholar]
- 9.Levin P, Wei W, Wang L, Pan C, Douglas D, Baser O. Combination therapy with insulin glargine and exenatide: real-world outcomes in patients with type 2 diabetes. Curr Med Res Opin. 2012;28:439–446. doi: 10.1185/03007995.2012.654850. [DOI] [PubMed] [Google Scholar]
- 10.DeVries JH, Bain SC, Rodbard HW Liraglutide-Detemir Study Group. Sequential intensification of metformin treatment in type 2 diabetes with liraglutide followed by randomized addition of basal insulin prompted by A1C targets. Diabetes Care. 2012;35:1446–1454. doi: 10.2337/dc11-1928. et al., [DOI] [PMC free article] [PubMed] [Google Scholar]
- 11.Jendle J, Martin SA, Milicevic Z. Insulin and GLP-1 analog combinations in type 2 diabetes mellitus: a critical review. Expert Opin Investig Drugs. 2012;21:1463–1474. doi: 10.1517/13543784.2012.707190. [DOI] [PubMed] [Google Scholar]
- 12.Balena R, Hensley IE, Miller S, Barnett AH. Combination therapy with GLP-1 receptor agonists and basal insulin: a systematic review of the literature. Diabetes Obes Metab. 2013;15:485–502. doi: 10.1111/dom.12025. [DOI] [PMC free article] [PubMed] [Google Scholar]
- 13.Meijer JJ. GLP-1 receptor agonists for individualized treatment of type 2 diabetes mellitus. Nat Rev Endocrinol. 2012;8:728–742. doi: 10.1038/nrendo.2012.140. [DOI] [PubMed] [Google Scholar]
- 14.Vora J, Bain SC, Damci T. Incretin-based therapy in combination with basal insulin: a promising tactic for the treatment of type 2 diabetes. Diabetes Metab. 2013;39:6–15. doi: 10.1016/j.diabet.2012.08.002. et al. [DOI] [PubMed] [Google Scholar]
- 15.Gerstein HC, Yale JF, Harris SB, Issa M, Stewart JA, Dempsey E. A randomized trial of adding insulin glargine vs. avoidance of insulin in people with type 2 diabetes on either no oral glucose-lowering agents or submaximal doses of metformin and/or sulphonylureas. The Canadian INSIGHT (Implementing New Strategies with Insulin Glargine for Hyperglycaemia Treatment) Study. Diabet Med. 2006;23:736–742. doi: 10.1111/j.1464-5491.2006.01881.x. [DOI] [PubMed] [Google Scholar]
- 16.Lind M, Jendle J, Torffuit O, Lager I. Glucagon-like peptide 1 (GLP-1) analogue combined with insulin reduces HbA1c and weight with low risk of hypoglycemia and high treatment satisfaction. Prim Care Diabetes. 2012;6:41–46. doi: 10.1016/j.pcd.2011.09.002. [DOI] [PubMed] [Google Scholar]
- 17.Ceriello A, Cremasco F, Romoli E, Rossi A, Gentilella R. Insulin lispro protamine suspension in the treatment of patients with type 1 and type 2 diabetes mellitus: a systematic review of published data. Expert Opin Pharmacother. 2012;13:255–281. doi: 10.1517/14656566.2012.650862. [DOI] [PubMed] [Google Scholar]
- 18.Giugliano D, Esposito K. Efficacy and safety of insulin lispro protamine suspension as basal supplementation in patients with type 2 diabetes. Ther Adv Endocrinol Metab. 2012;3:99–108. doi: 10.1177/2042018812442949. [DOI] [PMC free article] [PubMed] [Google Scholar]
- 19.Hompesch M, Ocheltree SM, Wondmagegnehu ET. Pharmacokinetics and pharmacodynamics of insulin lispro protamine suspension compared with insulin glargine and insulin detemir in type 2 diabetes. Curr Med Res Opin. 2009;25:2679–2687. doi: 10.1185/03007990903223739. et al. [DOI] [PubMed] [Google Scholar]
- 20.Ocheltree SM, Hompesch M, Wondmagegnehu ET, Morrow L, Win K, Jacober SJ. Comparison of pharmacodynamic intrasubject variability of insulin lispro protamine suspension and insulin glargine in subjects with type 1 diabetes. Eur J Endocrinol. 2010;163:217–223. doi: 10.1530/EJE-09-1086. [DOI] [PubMed] [Google Scholar]
- 21.Fogelfeld L, Dharmalingam M, Robling K, Jones C, Swanson D, Jacober S. A randomized, treat-to-target trial comparing insulin lispro protamine suspension and insulin detemir in insulin-naive patients with type 2 diabetes. Diabet Med. 2010;27:181–188. doi: 10.1111/j.1464-5491.2009.02899.x. [DOI] [PubMed] [Google Scholar]
- 22.Strojek K, Shi C, Carey MA, Jacober SJ. Addition of insulin lispro protamine suspension or insulin glargine to oral type 2 diabetes regimens: a randomized trial. Diabetes Obes Metab. 2010;12:916–922. doi: 10.1111/j.1463-1326.2010.01257.x. [DOI] [PubMed] [Google Scholar]
- 23.ADA, American Diabetes Association. Defining and reporting hypoglycemia in diabetes: a report from the American Diabetes Association Workgroup on Hypoglycemia. Diabetes Care. 2005;28:1245–1249. doi: 10.2337/diacare.28.5.1245. [DOI] [PubMed] [Google Scholar]
- 24.DCCT, The Diabetes Control and Complications Trial Research Group. Epidemiology of severe hypoglycemia in the diabetes control and complications trial. Am J Med. 1991;90:450–459. [PubMed] [Google Scholar]
- 25.Philis-Tsimikas A, Charpentier G, Clauson P, Ravn GM, Roberts VL, Thorsteinsson B. Comparison of once-daily insulin detemir with NPH insulin added to a regimen of oral antidiabetic drugs in poorly controlled type 2 diabetes. Clin Ther. 2006;28:1569–1581. doi: 10.1016/j.clinthera.2006.10.020. [DOI] [PubMed] [Google Scholar]
- 26.Heller S, Keonen C, Bode B. Comparison of insulin detemir and insulin glargine in a basal-bolus regimen, with insulin aspart as the mealtime insulin, in patients with type 1 diabetes: a 52-week, multinational, randomized, open-label, parallel-group, treat-to-target noninferiority trial. Clin Ther. 2009;31:2086–2097. doi: 10.1016/j.clinthera.2009.10.006. [DOI] [PubMed] [Google Scholar]
- 27.Koivosto V, Cleall S, Pontiroli AE, Giugliano D. Comparison of insulin lispro protamine suspension versus insulin glargine once daily in basal-bolus therapies with insulin lispro in type 2 diabetes patients: a prospective randomized open-label trial. Diabetes Obes Metab. 2011;13:1149–1157. doi: 10.1111/j.1463-1326.2011.01484.x. [DOI] [PubMed] [Google Scholar]
- 28.Chacra AR, Kipnes M, Ilag LL. Comparison of insulin lispro protamine suspension and insulin detemir in basal-bolus therapy in patients with type 1 diabetes. Diabet Med. 2010;27:563–569. doi: 10.1111/j.1464-5491.2010.02986.x. et al. [DOI] [PubMed] [Google Scholar]
- 29.Rosenstock J, Davies M, Home PD, Larsen J, Koenen C, Schernthaner G. A randomized, 52-week, treat-to target trial comparing insulin detemir with insulin glargine when added to glucose-lowering drugs in insulin-naive people with type 2 diabetes. Diabetologia. 2008;51:408–416. doi: 10.1007/s00125-007-0911-x. [DOI] [PMC free article] [PubMed] [Google Scholar]
- 30.Esposito K, Ciotola M, Maiorino MI. Addition of neutral protamine lispro insulin or insulin glargine to oral type 2 diabetes regimens for patients with suboptimal glycemic control: a randomized trial. Ann Intern Med. 2008;149:531–539. doi: 10.7326/0003-4819-149-8-200810210-00005. et al. [DOI] [PubMed] [Google Scholar]
- 31.Buse JB, Wolffenbuttel BH, Herman WH. DURAbility of basal versus lispro mix 75/25 insulin efficacy (DURABLE) trial 24-week results: safety and efficacy of insulin lispro mix 75/25 versus insulin glargine added to oral antihyperglycemic drugs in patients with type 2 diabetes. Diabetes Care. 32:1007–1013. doi: 10.2337/dc08-2117. [DOI] [PMC free article] [PubMed] [Google Scholar]
- 32.Hermansen K, Davies M, Derezinski T, Martinez R. avn G, Clauson P, Home P. A 26-week, randomized, parallel, treat-to-target trial comparing insulin detemir with NPH insulin as add-on therapy to oral glucose-lowering drugs in insulin-naive people with type 2 diabetes. Diabetes Care. 2009;29:1269–1274. doi: 10.2337/dc05-1365. . [DOI] [PubMed] [Google Scholar]
- 33.Yki-Järvinen H. Combination therapies with insulin in type 2 diabetes. Diabetes Care. 2001;24:758–767. doi: 10.2337/diacare.24.4.758. [DOI] [PubMed] [Google Scholar]
- 34.Russell-Jones D, Vaag A, Schmitz O. Liraglutide vs insulin glargine and placebo in combination with metformin and sulfonylurea therapy in type 2 diabetes mellitus (LEAD-5 met + SU): a randomized controlled trial. Diabetologia. 2009;52:2046–2054. doi: 10.1007/s00125-009-1472-y. et al. [DOI] [PMC free article] [PubMed] [Google Scholar]
- 35.Kendall DM, Cuddihy RM, Bergenstal RM. Clinical application of incretin-based therapy: therapeutic potential, patient selection and clinical use. Am J Med. 2009;122:S37–50. doi: 10.1016/j.amjmed.2009.03.015. [DOI] [PubMed] [Google Scholar]