

Abstract
Background & Aims
The optimal algorithm to identify Lynch syndrome (LS) among patients with colorectal cancer (CRC) is unclear. The definitive test for LS, germline testing, is too expensive to be applied in all cases. Initial screening with the Revised Bethesda Guidelines (RBG) cannot be applied in a considerable number of cases due to missing information.
Methods
We developed a model to evaluate the cost-effectiveness of 10 strategies for diagnosing LS. Three main issues are addressed: modeling estimates (20–40%) of RBG applicability; comparing sequential or parallel use of MSI and IHC; and a threshold analysis of the charge value below which universal germline testing becomes the most cost effective strategy.
Results
LS detection rates in RBG-based strategies decreased to 64.1%-70.6% with 20% inapplicable RBG. The strategy that uses MSI alone had lower yield but also lower cost than strategies that use MSI sequentially or in parallel with IHC. The use of MSI and IHC in parallel was less affected by variations in the sensitivity and specificity of these tests. Universal germline testing had the highest yield and the highest cost of all strategies. The model estimated that if charges for germline testing drop to $633–1518, universal testing of all newly diagnosed CRC cases becomes the most cost effective strategy.
Conclusions
The low applicability of RBG makes strategies employing initial laboratory based testing more cost effective. Of these strategies, parallel testing with MSI and IHC offers the most robust yield. With a considerable drop in cost, universal germline testing may become the most cost effective strategy for the diagnosis of LS.
Keywords: modeling, hereditary colon cancer, msi, Bethesda guidelines, decision tree, health services research
Introduction
Lynch syndrome (LS) remains the most common identifiable hereditary cause of colorectal cancer (CRC), accounting for 3% of all cases (1). LS arises from a germline mutation in one of four mismatch repair (MMR) genes MLH1, MSH2, MSH6, or PMS2, or promoter hypermethylation of MSH2 resulting from a deletion in the 3′ end of the EPCAM gene, resulting in microsatellite instability (MSI) and high predisposition to malignancy. While the lifetime CRC risk for individuals with LS is approximately 50% (2), they are also predisposed to endometrial, ovarian, stomach, small bowel, and urinary tract cancers (3). Identifying affected individuals among patients with newly diagnosed CRC is important for probands as well as for at-risk relatives, in order to determine baseline risk and implement screening strategies for the LS related malignancies. Devising a feasible, cost-effective algorithm for identifying LS affected individuals is therefore and important objective.
The Revised Bethesda Guidelines (RBG), a set of clinical criteria that incorporate histopathology, age at CRC diagnosis, prior history of cancer, and family history of LS-related malignancies have traditionally served as the first step in identifying CRC patients who are at higher than average risk for LS. Those who meet RBG undergo further evaluation, namely assessing tumor tissue for the presence of MSI (by PCR) and/or the expression of MMR proteins (by immunohistochemistry). A patient whose tumor is microsatellite unstable or does not express all four MMR proteins undergoes further evaluation to confirm or rule out the presence of a germline mutation.
While initiating the LS evaluation with RBG is inexpensive and does not require technical expertise, this traditional approach carries important pitfalls. First, published data suggest that clinicians frequently neglect to elicit a comprehensive family history from patients and that many patients are unable to provide such history (4;5). Second, due to relatively low sensitivity, even when such information is gathered properly, RBG have been shown to miss a substantial number of LS diagnoses. For example, after analyzing 1,566 unselected CRC patients for MSI, Hampel et al. demonstrated that 28% of LS probands (proven by germline sequencing) did not fulfill RBG and therefore would have been missed had RBG applied as the initial screening test (1). Given that evaluating all newly diagnosed CRC patients with MMR germline testing would simultaneously decrease the number of missed LS diagnoses but substantially increase the cost of LS evaluation, identifying a strategy which maximizes clinical benefit while minimizing cost could significantly impact clinical practice.
The cost-effectiveness of screening strategies for LS has previously been studied and reported (6–11). In addition to the potentially detrimental effect of RBG’s insensitivity, key components warrant further review; for example, simultaneous MSI and IHC testing, a strategy frequently used in clinical practice. Additionally, diagnostic algorithms for LS must now take into account the fact that a high proportion of cases of microsatellite-unstable tumors with absent MLH1 protein expression are caused by somatic inactivation of the MLH1 gene, which is often associated with a specific mutation (p.V600E) in the BRAF (12). Finally, newer cost-effectiveness models must account for the fact that second-generation sequencing technology, which has substantially lowered the per-unit cost of DNA sequencing, may become inexpensive enough in the near future to warrant bypassing initial screening evaluation and proceeding directly to germline sequencing.
The current study evaluates the cost-effectiveness of several clinically relevant diagnostic strategies for LS among patients with newly diagnosed CRC and assesses the cost threshold below which direct MMR gene sequencing would become a cost-effective initial testing strategy.
Methods
We developed a decision-tree model to evaluate the cost-effectiveness of multiple possible screening strategies for detecting LS in a population with CRC (Figure 1). We started with a hypothetical cohort of 150,000 CRC cases to approximate the annual number of newly diagnosed cases in the United States (13). The clinical effectiveness measure was defined as the number of true LS cases detected. For the purpose of this study we included only the cost of screening and diagnostic tests (RBG, BRAF targeted mutation analysis, IHC, MSI, and MMR gene sequencing) and not the downstream costs of CRC. EpCam mutations were not considered in these models. Cost was considered from the perspective of the U.S. healthcare system as a whole.
Data on the unit cost for each individual test were obtained from both prior studies and online laboratory websites (Appendix 1). The true cost of testing is not available from public data sources; therefore, we used the lowest charge of each test in the cost calculation. The cost of RBG was related to an average of outpatient clinic visit and genetic counseling in whom positive results are found. Data for the performance of diagnostic tests (sensitivity and specificity) were obtained by reviewing published literature identified using Medline and previously published models (Appendix 2). All modeling and calculations were performed using R version 2.14 (www.r-project.org).
We assumed that all patients diagnosed with CRC could enter one of ten mutually exclusive strategies:
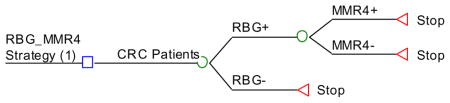
Strategy #1: Apply RBG as initial screening and, if positive, perform germline testing (sequencing and deletion/duplication testing) of all 4 MMR genes.
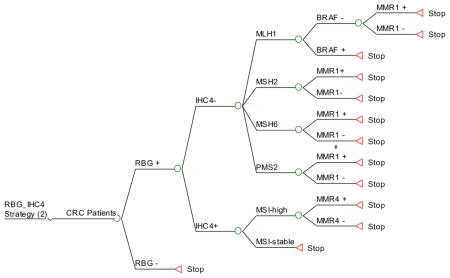
Strategy #2: Apply RBG as initial screening and, if positive, perform IHC for the 4 MMR proteins in the tumor tissue. If MSH2, MSH6 or PMS2 are not expressed, proceed to targeted germline testing of the gene corresponding to the missing protein. If MLH1 is not expressed, perform BRAF targeted mutation analysis, followed by germline testing of MLH1 if BRAF is negative (since BRAF mutations are rarely found in LS-associated CRC). If all 4 proteins are expressed by IHC, perform MSI testing on the tumor and, if unstable (MSI >30% of microsatellites examined), perform germline testing of all 4 MMR genes.
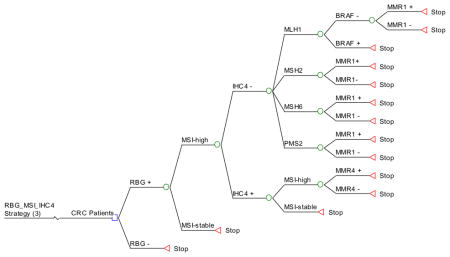
Strategy #3: Apply RBG as initial screening and, if positive, perform MSI testing. If unstable, perform IHC. If MSH2, MSH6 or PMS2 are not expressed, proceed to targeted germline testing of the gene corresponding to the missing protein. If MLH1 is not expressed, perform BRAF testing, followed by germline testing of MLH1 if BRAF is negative. If all 4 proteins are expressed by IHC, perform germline testing of all 4 MMR genes.
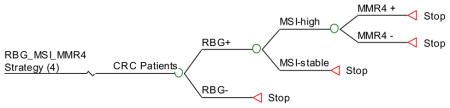
Strategy #4: Apply RBG as initial screening and, if positive, test the tumor for MSI. If unstable, perform germline testing of all 4 MMR genes.
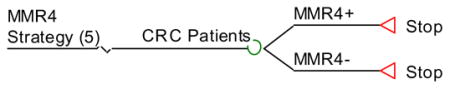
Strategy #5: Perform germline testing of all 4 MMR genes for all patients.
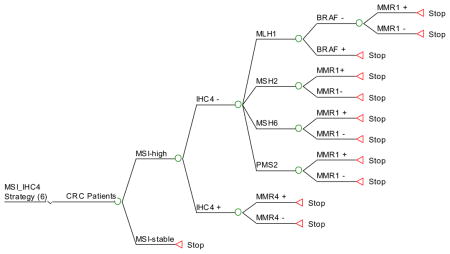
Strategy #6: Perform MSI testing as initial screening and, if unstable, perform IHC testing (as in strategy 3). If MSH2, MSH6 or PMS2 are not expressed, proceed to targeted germline testing of the gene corresponding to the missing protein. If MLH1 is not expressed, perform BRAF testing, followed by germline sequencing of MLH1 if BRAF is negative. If all 4 proteins are expressed by IHC, perform germline testing of all 4 MMR genes
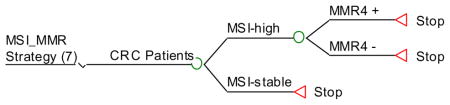
Strategy #7: Test all tumors for MSI and, if unstable, perform germline testing of all 4 MMR genes. If MSI stable then no more testing.
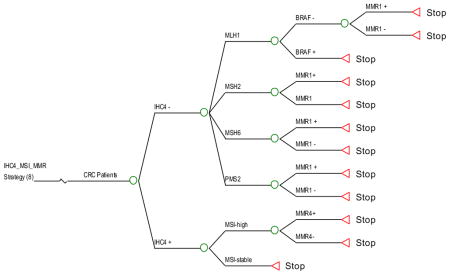
Strategy #8: Apply IHC for MMR protein expression as initial screening. If MSH2, MSH6 or PMS2 are not expressed, proceed to targeted germline testing of the gene corresponding to the missing protein. If MLH1 is not expressed, perform BRAF testing, followed by germline testing of MLH1 if BRAF is negative. If all 4 proteins are expressed by IHC, proceed with MSI testing. If unstable, perform germline testing of all 4 MMR genes.
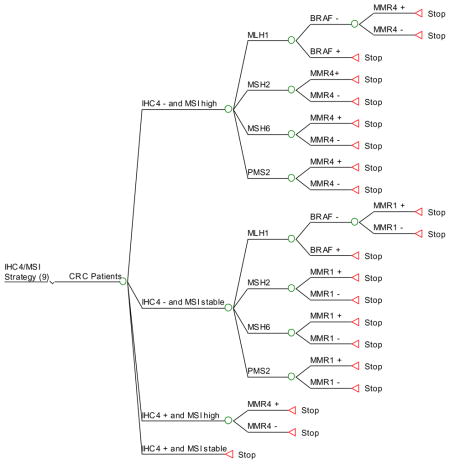
Strategy #9: Apply IHC and MSI testing simultaneously as initial screening. If IHC is abnormal, perform targeted germline testing (based on which protein is missing) irrespective of MSI results. If MLH1 is not expressed, perform BRAF testing, followed by germline testing of MLH1 if BRAF is negative. If IHC is normal and the tumor is microsatellite-unstable, perform germline testing of all 4 MMR genes. If the tumor expresses all MMR proteins by IHC and is microsatellite stable, no further testing is performed.
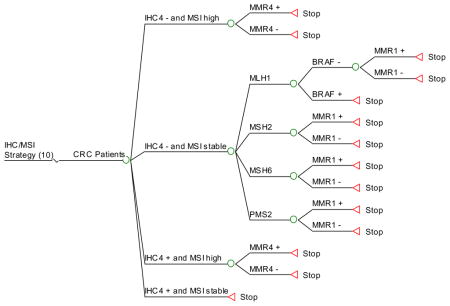
Strategy #10: Apply both IHC and MSI testing simultaneously as initial screening, as in strategy 9. This strategy is the same as # 9, except that if IHC is abnormal and the tumor is microsatellite-unstable, then germline testing of all 4 MMR genes is performed.
For each strategy we calculated the total yield (LS cases detected) and the total cost. The true detection rate was defined as the number of LS cases detected divided by the true number of LS cases in the study population. The number-needed-to-screen to detect one LS case (NNT) was calculated as the reciprocal of the true detection rate (1/true detection rate). The cost-effectiveness ratio, defined as the mean cost to detect one case of LS, was then calculated for each strategy. The incremental cost-effectiveness ratio (ICER) was defined as the difference in the mean cost per each additional LS case detected using one strategy over another.
In order to evaluate further RBG as an initial screen strategy, we performed two sensitivity analyses, in which we assumed that in 20% or 40% of newly diagnosed CRC cases, respectively, RBG is not or cannot be applied due to missing or unavailable family history. We assumed that LS is present in 3% of cases in whom RBG is in applicable. In addition, we performed a sensitivity analysis to examine the effect of a 10% reduction in both sensitivity and specificity for each individual test on the ranking among all screening strategies in terms of the true yield and mean cost per LS detected.
We performed a break-even analysis of the MMR4 strategy #5 compared to other strategies. The break-even cost of a MMR4 test was defined by the cost at which the cost of strategy #5 becomes equal to the cost of a reference strategy per LS case detected, and was calculated as the NNT of the reference strategy multiplied by its corresponding mean cost to detect one LS divided by the NNT of strategy #5.
Results
Our decision model compared the 10 screening strategies for detecting LS cases among the estimated 150,000 total annual number of patients diagnosed with CRC in the United States.
Table 1 illustrates the cost and effectiveness of the tested screening strategies. The first four strategies that use RBG as the initial screen were the least expensive strategies. These also had detection rates on the lower end of the spectrum (e.g., 80.1% in strategy #3). The only RBG strategy with a high LS detection rate (90.5%) was strategy #1, but it was also associated with a high cost of $51,612 per LS case detected. The LS yield was highest (99.5%) in strategy #5, and intermediate (88.1%–97.6%) in strategies based on different combinations of IHC, MSI and BRAF testing (strategies 6–10). The total strategy cost was the lowest in RBG-based strategies, 365%–497% higher in strategies that used MSI/IHC/BRAF without RBG, and highest (> 11 fold) in strategy #5.
Table 1.
Diagnostic Yield of Lynch Syndrome (LS) and Cost Per LS Case Detected among Newly Diagnosed Colorectal Cancer (CRC) Using Different Screening Strategies. Findings of the Model Using Base case Estimates.
| Strategy | RBG_MMR4 | RBG_IHC4 | RBG_MSI_IHC4 | RBG_M SI_MM R4 | MMR4 | MSI_IHC4 | MSI_MMR | IHC4_MSI_MMR | IHC4/MSI_1 | IHC4/MSI_2 |
|---|---|---|---|---|---|---|---|---|---|---|
| 1 | 2 | 3 | 4 | 5 | 6 | 7 | 8 | 9 | 10 | |
| CRC screening (N) | 150,000 | 150,000 | 150,000 | 150,000 | 150,000 | 150,000 | 150,000 | 150,000 | 150,000 | 150,000 |
| LS Prevalence in CRC (%) | 0.03 | 0.03 | 0.03 | 0.03 | 0.03 | 0.03 | 0.03 | 0.03 | 0.03 | 0.03 |
| Detectable LS Cases (n) | 4,500 | 4,500 | 4,500 | 4,500 | 4,500 | 4,500 | 4,500 | 4,500 | 4,500 | 4,500 |
| LS detected (n) | 4074 | 3974 | 3605 | 3626 | 4478 | 3963 | 3986 | 4370 | 4368 | 4392 |
| LS detection rate (%) | 90.5 | 88.3 | 80.1 | 80.6 | 99.5 | 88.1 | 88.6 | 97.1 | 97.1 | 97.6 |
| Total strategy cost ($) | 210,267,288 | 93,297,780 | 78,423,107 | 96,634,077 | 929,999,138 | 286,255,416 | 303,583,506 | 375,257,030 | 352,947,504 | 389,732,904 |
| Mean cost per LS ($) | 51,612 | 23,480 | 21,757 | 26,654 | 207,705 | 72,232 | 76,172 | 85,881 | 80,803 | 88,737 |
Abbreviations: CRC, colorectal cancer; LS, Lynch Syndrome; RBG, revised Bethesda guidelines; MMR4, mismatch repair testing (gene sequencing, deletion and duplication testing of all 4 LS genes); MSI, microsatellite instability; IHC4 immunohistochemistry of all 4 LS genes
RBG_MMR4: RBG as initial screening, and if positive perform MMR4 testing.
RBG_IHC4: RBG as initial screening, and if positive perform IHC for protein expression of the 4 MMR genes in the tumor tissue. If proteins MSH2, MSH6 or PMS2 are absent then targeted MMR testing. If protein MLH1 is absent then perform BRAF testing by PCR, followed by targeted MMR testing for MLH1 if BRAF is negative. If all 4 proteins are present on IHC, PCR for MSI and if unstable then MMR 4 testing.
RBG_MSI_IHC4: RBG as initial screening, and if positive perform MSI testing. If unstable by MSI testing then perform IHC. If proteins MSH2, MSH6 or PMS2 are absent, then targeted MMR testing described in strategy 2 (RBG_IHC4). If protein MLH1 is absent, then BRAF testing by PCR is performed followed by MMR testing for MLH1 if BRAF is negative. If IHC is normal, then MMR4 testing.
RBG_MSI_MMR4: RBG as initial screening and if positive, then test the tumor for MSI. If the tumor is unstable then perform MMR4 testing.
MMR:: MMR4 testing.
MSI_IHC4: MSI by PCR and if unstable, then perform IHC testing. If proteins MSH2, MSH6 or PMS2 are absent then targeted MMR testing. If MLH1 protein is absent then BRAF testing is performed, followed by targeted MMR testing for MLH1 if BRAF is negative. If IHC is normal, then perform MMR4 testing.
MSI_MMR: MSI and if unstable then proceed with MMR4 testing.
IHC4_MSI_MMR: IHC on all tumors and if proteins MSH2, MSH6 or PMS2 are absent, then perform targeted MMR testing. If MLH1 is absent then BRAF is testing is performed, followed by targeted MMR testing of MLH1 if BRAF is negative. If IHC is normal then MSI is performed. If unstable then MMR 4 testing is performed.
IHC4/MSI_1: IHC and MSI testing in parallel. If IHC is normal, but the tumor is unstable by MSI testing then MMR 4 testing is performed. If IHC is normal and MSI is stable then no further testing is performed. If IHC is abnormal then perform targeted MMR testing.
IHC4/MSI_2: IHC and MSI testing in parallel. If IHC is abnormal and MSI unstable then MMR 4 testing is performed. If IHC is normal and MSI is stable then no further testing is performed.
The detection rates were dramatically affected by an assumed 20% and 40% inapplicability of RBG (Table 2). The LS detection rates were 64.1% to 72.4%% with 20% inapplicable RBG and 48.1% to 54.3% with 40% inapplicable RBG (compared to detection rates of 80.1%–90.5% for the same four strategies assuming full applicability of family history information). In other words, 27.6% to 51.9% of all LS related CRC will be missed with strategies 1 (20% applicable RBG) and 3 (40% applicable RBG).
Table 2.
Diagnostic Yield of Lynch Syndrome (LS) and Cost Per LS Case Detected among Newly Diagnosed Colorectal Cancer (CRC) Using Different Screening Strategies. Findings of the Model Using a Sensitivity Analysis in which the Proportions of Non-Usable RBG Information is Considered.
| Strategy | RBG_MMR4 | RBG_IHC4 | RBG_MSI_IHC4 | RBG_MSI_MMR4 | MMR4 | MSI_IHC4 | MSI_MMR | IHC4_MSI_MMR | IHC4/MSI_1 | IHC4/MSI_2 |
|---|---|---|---|---|---|---|---|---|---|---|
| 1 | 2 | 3 | 4 | 5 | 6 | 7 | 8 | 9 | 10 | |
| Total CRC population (N) | 150,000 | 150,000 | 150,000 | 150,000 | 150,000 | 150,000 | 150,000 | 150,000 | 150,000 | 150,000 |
| Prevalence of LS (%) | 0.03 | 0.03 | 0.03 | 0.03 | 0.03 | 0.03 | 0.03 | 0.03 | 0.03 | 0.03 |
| Detectable LS Cases (n) | 4,500 | 4,500 | 4,500 | 4,500 | 4,500 | 4,500 | 4,500 | 4,500 | 4,500 | 4,500 |
| Non-Usable Rate (%) | 20 | 20 | 20 | 20 | 0 | 0 | 0 | 0 | 0 | 0 |
| LS detected cases (n) | 3259 | 3179.2 | 2884 | 2901 | 4478 | 3963 | 3986 | 4370 | 4368 | 4392 |
| LS detected rate (%) | 72.4 | 70.6 | 64.1 | 64.5 | 99.5 | 88.1 | 88.6 | 97.1 | 97.1 | 95.7% |
| Non-Usable Rate (%) | 40 | 40 | 40 | 40 | 0 | 0 | 0 | 0 | 0 | 0 |
| LS detected cases (n) | 2444 | 2384 | 2163 | 2176 | 4478 | 3963 | 3986 | 4370 | 4368 | 4392 |
| LS detected rate (%) | 54.3 | 53.0 | 48.1 | 48.3 | 99.5 | 88.1 | 88.6 | 97.1 | 97.1 | 95.7 |
The cost-effectiveness of applying MSI and IHC testing simultaneously versus sequentially was examined (Table 1). Strategy #6 (sequential with MSI testing first) had the lowest detection rate of 88.1%, whereas strategies #8 (sequential with IHC testing first) and #9 (parallel IHC and MSI) had 97.1% detection rates and strategy #10 (parallel) had a detection rate of 97.6%. However, sequential testing strategy #6 was the least expensive with an estimated cost of $76,172 per LS case detected while, the other sequential strategy (#8) cost $85,881, approximately $5,000 more than parallel testing strategy #9. Nevertheless, the comparative cost-effectiveness of these strategies (#6:$141, #8:$84, #9:$88 and #10:$85), as measured by ICER using strategy #3 (Table 3) as a base indicated that the two parallel testing strategies and the IHC first sequential testing strategy were nearly equivalent and all three had a more favorable ICER than sequential strategy #6 (MSI first). Of the two strategies employing parallel testing, the total cost of strategy 9 was approximately 9% less than strategy #10. The LS detection rate was only 0.5% higher in strategy #10, making strategy #9 a dominant strategy (comparable yield and lower cost than strategy #10).
Table 3.
Cost effectiveness of several strategies for the detection of LS among newly diagnosed CRC cases. The strategies arranged in order of effectiveness (yield- # of LS cases identified among 150,000) from low to high. Cost effectiveness is measured by incremental cost-effectiveness ratio (ICER) compared to the least costly strategy (#1).
| Strategy | Mean Cost Per LS Detected | Incremental Cost (Compared with Least | Effectiveness (yield) | Incremental Effectiveness | ICER |
|---|---|---|---|---|---|
| #3 | $21,757 | - | 3605 | - | - |
| #4 | $26,654 | $4,897 | 3626 | 21 | $233 |
| #6 | $72,232 | $50,475 | 3963 | 358 | $141 |
| #2 | $23,480 | $1,723 | 3974 | 369 | $5 |
| #7 | $80,803 | $59,046 | 3986 | 381 | $155 |
| #1 | $51,612 | $29,855 | 4074 | 469 | $64 |
| #9 | $88,737 | $66,980 | 4368 | 763 | $88 |
| #8 | $85,881 | $64,124 | 4370 | 765 | $84 |
| #10 | $88,737 | $66,980 | 4392 | 787 | $85 |
| #5 | $207,705 | $185,948 | 4478 | 873 | $213 |
Table 3 also demonstrates the incremental cost, incremental yield, and the incremental cost per each additional LS case detected using strategy #3 as a reference strategy to which other strategies were compared. The mean incremental cost of strategy 5 compared with #3 was $185,948, and the difference in the mean yield was an additional 873 LS cases with strategy #5. If we employed strategy #5 (the most expensive) over strategy 3 (the least expensive), screening costs $213 more for each additional LS case detected. If we employ strategy #1 over the strategy #3, screening costs $64 more for each additional LS case detected.
Since strategy #5 had the highest detection of LS at 99.5%, we evaluated the cost threshold (break-even point of cost) at which universal germline testing for all MMR genes becomes equal in cost per LS case detected compared to the other strategies (Table 4). The current cost of testing a patient with germline DNA sequencing and deletion/duplication analysis used in our base case scenario is $6200. Table 4 shows a break-even analysis cost of this approach. For example, if the unit cost of germline testing of all 4 MMR genes could be reduced to $1518 then it would be comparable to the cost of RBG-based strategy #1 and if the unit cost could be reduced to $2,119 it would be comparable to MSI-based strategy #6. In Table 4, the break-even unit cost of strategy #5 was $2,678 if 40% of RBG information were not usable (not available or missing), as subsequent confirmatory tests would be equivalent to RBG-based strategy #1, in terms of cost per LS case detected. If 20% of RBG information were not usable, the unit cost of strategy #5 at $2,009 would render it equivalent of to RBG-based strategy #1 in terms of cost per LS case detected, but with a considerably higher yield.
Table 4.
Break-Even Analysis of Unit Cost of MMR4 Test Kit Relative to Selected HNPCC Screening Strategies
| Screening Strategy | Cost Per CRC Case Screened ($) | True Detection Rate (%) | NNT | Break-Event Cost of Unit MMR4 Test ($) |
|---|---|---|---|---|
| #1 | $1,402 | 0.02716 | 37 | 1,518 |
| #2 | $611 | 0.02649 | 38 | 678 |
| #3 | $517 | 0.02403 | 42 | 633 |
| #4 | $644 | 0.02417 | 41 | 784 |
| 20% RBG inapplicable | ||||
| #1 | 1,462 | 0.021728 | 46 | 2,009 |
| #2 | 671 | 0.021192 | 47 | 945 |
| #3 | 577 | 0.019224 | 52 | 896 |
| #4 | 704 | 0.019336 | 52 | 1,087 |
| Genetic-based Strategy | ||||
| #6 | 1,896 | 0.02642 | 38 | 2,119 |
| #7 | 2,024 | 0.02657 | 38 | 2,262 |
| #8 | 2,315 | 0.02913 | 34 | 2,315 |
| #9 | 2,319 | 0.02912 | 34 | 2,319 |
| #10 | 2,577 | 0.02928 | 34 | 2,577 |
NNT= number need-to-test to detect one LS case.
We conducted additional sensitivity analysis of the effect of reducing both sensitivity and specificity for each individual test on ranking of strategies in terms of true yields and cost-effectiveness ratios. The findings of the model were robust to these variations, except when MSI and IHC were used as the initial screening strategies. Table 5 shows the findings of the model in which MSI sensitivity and specificity estimates were 10% lower than those used in the base case analysis. The yield of strategies that use MSI alone (#7) or starts with MSI (#6) was reduced compared with base case. However, strategies that use MSI as a follow up after IHC (#8) or in parallel with IHC (#9 and #10). Similar findings (data not shown) were observed for the sensitivity analysis in which IHC sensitivity and specificity were lower than base case estimates: strategies that use IHC as the first test (#8) but the yield of strategies using IHC and MSI in parallel were little affected.
Table 5.
Findings from a sensitivity analysis that considers 10% reduction in sensitivity and specificity in MSI
| MSI_IHC4 6 | MSI_MMR 7 | IHC4_MSI_MMR 8 | IHC4/MSI1 9 | IHC4/MSI 2 10 | |
|---|---|---|---|---|---|
| LS Cases Detected (n) | 3566 | 3587 | 4302 | 4301 | 4321 |
| Relative Difference from Base Case | −10% | −10% | −2% | −2% | −2% |
| Total Cost per Strategy | $352,624,401 | $369,661,500 | $436,220,151 | $413,428,872 | $394,807,221 |
| Mean Cost of Strategy | $98,899 | $103,056 | $101,399 | $96,124 | $91,369 |
| NNT (n) | 42 | 42 | 35 | 35 | 35 |
| Mean Cost per LS Case Detected | $2,351 | $2,464 | $2,908 | $2,756 | $2,632 |
NNT: Number Needed to Test
Discussion
We have evaluated the yield and the estimated cost of multiple algorithms for detecting LS detection among all patients with newly diagnosed CRC in the United States. Some algorithms followed the traditional approach of using the RBG to identify patients for further testing, while others started with laboratory evaluation (either tumor or germline testing). Our model shows that starting with RBG can be cost-effective, but the relatively low sensitivity and feasibility of this strategy can dramatically reduce the detection rate and hence the effectiveness of RBG-based strategies. In fact, the 20% to 40% rate of inapplicable or inaccurate RBG seen in clinical practice reduced the cost-effectiveness of RBG-based screening below that of MSI/IHC based strategies. By comparing the cost-effectiveness of parallel versus sequential MSI and IHC testing, we found that parallel testing strategies have similar cost-effectiveness compared to sequential testing that starts with IHC and favorable cost-effectiveness compared to sequential testing that starts with MSI. Finally, in a break-even analysis, we calculated that a unit cost of 633 to $1518 (vs. the current cost of $6,200), would make universal germline testing become equal to other LS screening strategies tested in this study in terms of cost per LS case detected in the CRC population.
A measure of external validity to our model is provided by consistent findings from previous cost-effectiveness studies that examined strategies similar to some of those in our model. A study by Mvundura et al., which calculated cost per LS case detected, incremental costs per life-year saved, and quality-adjusted life years showed that universal testing with MSI or IHC is a cost-effective method of LS diagnosis (6). The most cost-effective strategy in their analysis was IHC testing followed by BRAF testing if MLH1 is absent and then targeted germline testing. In our study, strategies in which IHC was used as the initial test had higher LS detection rates but also cost at least $4000 more per LS detected than the MSI-based strategies. This finding is similar to that of Mvundura et al. (6). The reason for the cost saving is that targeted germline testing is performed after a positive IHC testing, as opposed to testing for all 4 genes in the MSI-first strategy. Ramsey et al. compared costs per LS case detected and added cost per life-year saved among 4 strategies: 1) original Bethesda Guidelines followed by MSI testing for those who met the criteria and, if MSI-H, then germline testing; 2) universal MSI testing, and if MSI-H, then germline testing; 3) germline testing for those who met original Bethesda Guidelines; and 4) germline testing on all patients regardless of history (14). This study concluded that strategies starting with the original Bethesda Guidelines were the most cost-effective but also resulted in the fewest LS probands detected. Our model both supports and extends these findings by examining the effect of RBG inapplicability on LS detection, comparing parallel versus sequential IHC and MSI testing, and providing a break-even threshold at which germline testing in all CRC cases becomes the most cost-effective LS screening strategy.
The low effectiveness and applicability of RBG strategies in clinical practice decreases the cost-effectiveness of these strategies. A previous study reported that approximately 28% of patients with LS did not fulfill the RBG criteria (1). In addition, RBG application is dependent on healthcare providers’ interrogation of patients with CRC and patients’ knowledge of their family and personal history of cancer. A retrospective study of 499 consecutively diagnosed CRC patients at one VA facility showed that, although 57 (11%) of patients met at least one of the RBG criteria, only 4 of these patients were referred for further genetic testing (15). Therefore, with 20–40% non-usable RBG information, the detection rates in RBG-based strategies in our model fall below 50%, and it becomes important to take into account the number of missed LS patients. We did not evaluate prediction based models such as MMRPro, which are designed to predict MMR gene mutations (16). Although these tools may be easier to implement then RBG, it is subject to similar limitations, as they rely on personal and family histories. Given that this information may be incomplete, unavailable, or inaccurate, the diagnostic yield is directly affected regardless of the history-based strategy employed. It is important to note that RBG was designed to select for MSI testing (as in our strategy # 3 and 4) and not to lead directly to mutational testing. We, however, included strategies # 1 and 2 with RBG as initial testing to IHC, and MMR to see if this method could improve the detection rate while decreasing the cost.
Parallel testing with MSI and IHC may add to the feasibility of LS screening by reducing the need for sequential interdependent steps and by shortening the lag time from testing to definitive results. Our model indicates that parallel testing, when compared to a sequential strategy that employs IHC initially, yields similar diagnostic accuracy and cost, resulting in similar cost-effectiveness. Both strategies (#8 and #9) were very effective with a 97.1% detection rate of LS and a cost around $80,000 per case detected. A sequential strategy that employs initial MSI testing is less costly but carries a less favorable cost-effectiveness profile (higher ICER), due to the lower yield of identified LS cases compared with parallel testing strategies. Our findings with respect to sequential versus parallel testing with MSI and IHC were sensitive to relatively small changes in the sensitivity and specificity of these tests. A 10% reduction in both sensitivity and specificity of MSI (Table 5) had a large effect on the yield of the strategy that uses MSI only and on the sequential strategy that starts with MSI followed by IHC, while having relatively small effect on strategies that use parallel testing with MSI and IHC. The reason that sequential strategy (e.g. #8) cost more than parallel MSI/IHC was that there are a much larger number of CRC patients who were with IHC/MSI normal who required the relatively expensive full MMR 4 tests.
Recently Moreira et al. evaluated MMR universal screening compared with other strategies including Bethesda guidelines and found that universal tumor testing had the greatest sensitivity in a pooled-data analysis of over 10,000 patients (17). Given that germline testing has the best diagnostic yield for Lynch syndrome we felt it was important to determine at what point universal testing could be considered cost-effective. Our study provides valuable insight into a “break-even” point that would support up-front universal germline testing for all patients diagnosed with CRC. We found that as much as a 75% reduction in the cost of germline testing would be required for universal germline testing-based screening to yield a favorable cost-effectiveness profile compared with RBG-based strategies. With the per-base cost of DNA sequencing continuing to fall and with the capacity of next-generation sequencing technology rapidly expanding, this threshold may be reached in the near future. The historically cumbersome and highly variable path to diagnosing LS may then be supplanted by a simple, uniform, and streamlined strategy that offers the highest possible diagnostic yield.
Our study has some limitations. As in other mathematical modeling studies, some of our estimates for the transition probabilities and costs were not grounded in high-level evidence and could therefore be affected by variations or errors. However, we simulated a range of possibilities in the sensitivity analyses, and we reported that the main findings of the study in terms of strategies ranking of yields and cost-effectiveness ratios across different screening strategies were quiet robust. One exception is the comparison of strategies starting with parallel or sequential IHC, MSI, and BRAF, which was discussed above. Another conceptual limitation resides in the reliance on conventional economic principles where cost and effectiveness considerations are important for decision-making. However, these assumptions do not incorporate patient or physician preferences or beliefs that may overvalue factors, such as the ease, safety, availability and rapidity of certain tests over others. For example, the eventual acceptability and hence the use of universal germline testing, even if it becomes cost-effective in modeling studies, may be different than it would be for a non-genetic test.
Our analysis was designed to identify the most cost-effective strategy for diagnosing LS, but it did not assess downstream cost and benefit. Our models do not take into account costs associated with subsequent cancer treatment, prevention of secondary primary cancers, or prevention of at-risk family members. The strategies also did not consider the opportunity lost as a result of missing an LS case (e.g., possible late or delayed diagnosis in affected relatives) or the costs that may result after LS diagnosis (e.g., intensive surveillance). Our strategies did not factor in the cost savings of diagnosis for relatives who need only mutation specific testing after a diagnosis is made in the index patient. The main outcome of the model was not included quality-adjusted life years gained, and therefore the findings cannot be directly compared with other cancer screening strategies. In addition, while we were able to account for some of the limitations of molecular tumor testing by changing the sensitivity and specificity values, and incorporating BRAF testing into our model, we could not account for variability in pathology interpretation. Lastly, it has been reported that epithelial cell adhesion molecule (EpCAM) deletions are detected in patients with suspected LS and absent MSH2 staining on immunohistochemistry. However, EpCAM testing was not included in this study because we felt that the data regarding prevalence of EpCAM deletions is limited and therefore would be challenging to accurately include this deletion in our model (18).
Finally, our model does explicitly not take into account patients with Lynch-like syndrome. Lynch-like syndrome patients have MSI, but with no identifiable MMR mutation (19). These patients and their family members often undergo the work up for LS. These patients may also be referred for testing of the tumor, if the suspicion is high and MMR mutation is not found. Including these patients would be a goal for future studies as more information about this entity becomes available.
Although the revised Bethesda Guidelines remain useful for screening CRC patients for LS, their inherent limitations as a history-based tool and their relatively low sensitivity raise serious concerns about their effectiveness, especially with the emergence of more sophisticated and definitive diagnostic tools. Using alternative screening strategies that incorporate upfront laboratory-based (tumor or germline) testing likely improve detection rates, but with increased cost. However, as the cost of DNA-based testing continues to decrease, germline testing for all CRC patients may soon become the most cost-effective, reliable, and reproducible screening tool for Lynch Syndrome.
Acknowledgments
Funding: This work was supported in part by the Texas Digestive Disease Center NIH DK58338 and Houston VA HSR&D Center for Innovations in Quality, Effectiveness and Safety (CIN 13-413).
Abbreviations
- LS
Lynch syndrome
- CRC
colorectal cancer
- RBG
Revised Bethesda Guidelines
- MSI
microsatellite instability
- IHC
immunohistochemistry
- MMR
mismatch repair
Appendices
Appendix 1. Costs of tests used in the model for the base case scenario. The highlighted numbers are the ones used in the base case analysis
| Test | Cost ($) | Reference |
|---|---|---|
|
| ||
| RBG cost of genetic consultation | 150* | 1 |
|
| ||
| MLH1, MSH2, MSH6 and PMS2 full gene sequencing | 4000* | 2 |
|
| ||
| MLH1, MSH2, and MSH6 deletion/duplication analysis | 2200* | 2 |
|
| ||
| MLH1 full gene sequencing | 1150 | 2 |
| 1018 | 3 | |
| 1200 | 4 | |
| 900* | 5 | |
| 1342 | 6 | |
| 1290 | 7 | |
|
| ||
| MLH1 deletion/duplication | 1500 | 2 |
| 300* | 3 | |
| 470 | 4 | |
| 505 | 5 | |
| 474 | 6 | |
|
| ||
| MLH1 hypermethylation analysis | 439 | 3 |
|
| ||
| MSH2 full gene sequencing | 1150 | 2 |
| 996 | 3 | |
|
|
4 | |
| 1342 | 5 | |
| 1090 |
6 7 |
|
|
| ||
| MSH2 deletion/duplication | 1500 | 2 |
| 300* | 3 | |
| 470 | 4 | |
| 505 | 5 | |
| 474 | 6 | |
|
| ||
| MSH6 full gene sequencing | 1150 | 2 |
| 1018 | 3 | |
| 1200 | 4 | |
| 900* | 5 | |
| 1102 | 6 | |
| 1050 | 7 | |
|
| ||
| MSH6 deletion/duplication | 1500 | 2 |
| 300* | 3 | |
| 470 | 4 | |
| 505 | 5 | |
| 474 | 6 | |
|
| ||
| PMS2 full gene sequencing | 1400 | 2 |
| 1870 | 4 | |
| 1342 | 6 | |
| 980* | 7 | |
|
| ||
| PMS2 deletion/duplication | 470* | 4 |
| 474 | 6 | |
|
| ||
| IHC(MLK1, MSH2, MSH6, and PMS2) | 500* | 2 |
| 558 | 3 | |
|
| ||
| MSI | 415* | 2 |
| 493 | 3 | |
|
| ||
| BRAF mutation analysis | 314* | 3 |
Abbreviations: RBG, Revised Bethesda Guidelines; IHC, immunohistochemistry; MSI, microsatellite instability.
References for cost
Resnick K, Straughn JM, Backes F, Hampel H, Matthews KS, Cohn DE. Lynch syndrome Screening Strategies among Newly Diagnosed Endometrial Cancer Patients. Obstetrics & Gynecology 2009;114:3:530–536
Emory Genetics Labs
Mayo Medical Laboratories
BCM labs
Harvard Partners
University Hospitals Case Medical Center
Prevention Genetics
Appendix 2. Estimates of transition probabilities used in the model for the base case scenario
| Parameter | Percentage (%) | Reference |
|---|---|---|
| Prevalence of LS in CRC | 3 | 1 |
| Proportion of LS with MSH2 mutation | 39 | 20 |
| Proportion of LS with MLH1 mutation | 32 | 20 |
| Proportion of LS with MSH6 mutation | 14 | 20 |
| Proportion of LS with PMS2 mutation | 15 | 20 |
| RBG sensitivity for LS | 91 | 21 |
| RBG specificity for LS | 82 | 21 |
| MSI specificity for LS | 90.2 | 20 |
| MSI sensitivity for LS MLH1/MSH2 | 91 | 20 |
| MSI sensitivity for LS MSH6/PMS2 | 77 | 20 |
| IHC specificity for LS | 88.8 | 20 |
| IHC sensitivity for LS | 83 | 20 |
| BRAF V600E sensitivity for LS | 69 | 20 |
| BRAF V600E specificity for LS | 99.5 | 20 |
| MMR sensitivity for LS | 99.5 | 6 |
| MMR specificity for LS | 99.96 | 6 |
Abbreviations: LS, Lynch syndrome; CRC, Colorectal cancer; RBG, Revised Bethesda Guidelines; MSI, microsatellite instability; IHC, immunohistochemistry; MMR, mismatch repair gene testing
Appendix 3. HNPCC Ten Screening Strategies (Decision Trees)
Abbreviations
- CRC
colorectal cancer
- RBG
revised Bethesda guidelines
- MMR4
mismatch repair testing (gene sequencing, deletion and duplication testing of all 4 LS genes)
- MSI
microsatellite instability
- IHC
immunohistochemistry
- IHC4
indicates abnormal IHC or absence of MMR proteins
Footnotes
Conflicts of Interest: No conflicts of interest exist.
Author Contributions:
Hashem El-Serag: Funding, conception, design, analysis, interpretation results, manuscript Writing, editing, decision to publish
Milena Gould: Conception, data collection, editing manuscript, decision to publish
Benjamin Musher: Analysis, editing manuscript, decision to publish
Luis Miguel Franco: Conception, data collection, interpretation results, editing manuscript, decision to publish.
Guoqing J. Chen: Data collection, interpretation results, editing manuscript, decision to publish.
Reference List
- 1.Hampel H, Frankel WL, Martin E, et al. Feasibility of screening for Lynch syndrome among patients with colorectal cancer. J Clin Oncol. 2008;26(35):5783–5788. doi: 10.1200/JCO.2008.17.5950. [DOI] [PMC free article] [PubMed] [Google Scholar]
- 2.Stoffel E, Mukherjee B, Raymond VM, et al. Calculation of risk of colorectal and endometrial cancer amont patients with Lynch syndrome. Gastroenterology. 2009;137(5):1621–7. doi: 10.1053/j.gastro.2009.07.039. [DOI] [PMC free article] [PubMed] [Google Scholar]
- 3.Aarnio M, Sankila R, Pukkala E, et al. Cancer risk in mutation carriers of DNA-mismatch-repair genes. Int J Cancer. 1999;81(2):214–218. doi: 10.1002/(sici)1097-0215(19990412)81:2<214::aid-ijc8>3.0.co;2-l. [DOI] [PubMed] [Google Scholar]
- 4.Mitchell RJ, Brewster D, Campbell H, et al. Accuracy of reporting of family history of colorectal cancer. Gut. 2004;53(2):291–295. doi: 10.1136/gut.2003.027896. [DOI] [PMC free article] [PubMed] [Google Scholar]
- 5.Foo W, Young JM, Solomon MJ, et al. Family history? The forgotten question in high-risk colorectal cancer patients. Colorectal Dis. 2009;11(5):450–455. doi: 10.1111/j.1463-1318.2009.01898.x. [DOI] [PubMed] [Google Scholar]
- 6.Mvundura M, Grosse SD, Hampel H, et al. The cost-effectiveness of genetic testing strategies for Lynch syndrome among newly diagnosed patients with colorectal cancer. Genet Med. 2010;12(2):93–104. doi: 10.1097/GIM.0b013e3181cd666c. [DOI] [PubMed] [Google Scholar]
- 7.Ladabaum U, Wang G, Terdiman J, et al. Strategies to identify the Lynch syndrome among patients with colorectal cancer: a cost-effectiveness analysis. Ann Intern Med. 2011;155(2):69–79. doi: 10.7326/0003-4819-155-2-201107190-00002. [DOI] [PMC free article] [PubMed] [Google Scholar]
- 8.Reyes CM, Allen BA, Terdiman JP, et al. Comparison of selection strategies for genetic testing of patients with hereditary nonpolyposis colorectal carcinoma: effectiveness and cost-effectiveness. Cancer. 2002;95(9):1848–1856. doi: 10.1002/cncr.10910. [DOI] [PubMed] [Google Scholar]
- 9.Ramsey SD, Clarke L, Etzioni R, et al. Cost-effectiveness of microsatellite instability screening as a method for detecting hereditary nonpolyposis colorectal cancer. Ann Intern Med. 2001;135(8 Pt 1):577–588. doi: 10.7326/0003-4819-135-8_part_1-200110160-00008. [DOI] [PubMed] [Google Scholar]
- 10.Kievit W, de Bruin JH, Adang EM, et al. Cost effectiveness of a new strategy to identify HNPCC patients. Gut. 2005;54(1):97–102. doi: 10.1136/gut.2004.039123. [DOI] [PMC free article] [PubMed] [Google Scholar]
- 11.Dinh TA, Rosner BI, Atwood JC, et al. Health benefits and cost-effectiveness of primary genetic screening for Lynch syndrome in the general population. Cancer Prev Res (Phila) 2011;4(1):9–22. doi: 10.1158/1940-6207.CAPR-10-0262. [DOI] [PMC free article] [PubMed] [Google Scholar]
- 12.Bouzourene H, Hutter P, Losi L, et al. Selection of patients with germline MLH1 mutated Lynch syndrome by determination of MLH1 methylation and BRAF mutation. Fam Cancer. 2010;9(2):167–172. doi: 10.1007/s10689-009-9302-4. [DOI] [PubMed] [Google Scholar]
- 13.Jemal A, Siegel R, Ward E, et al. Cancer statistics, 2009. CA Cancer J Clin. 2009;59(4):225–249. doi: 10.3322/caac.20006. [DOI] [PubMed] [Google Scholar]
- 14.Ramsey SD, Burke W, Clarke L. An economic viewpoint on alternative strategies for identifying persons with hereditary nonpolyposis colorectal cancer. Genet Med. 2003;5(5):353–363. doi: 10.1097/01.GIM.0000086626.03082.B5. [DOI] [PMC free article] [PubMed] [Google Scholar]
- 15.Singh H, Schiesser R, Anand G, et al. Underdiagnosis of Lynch syndrome involves more than family history criteria. Clin Gastroenterol Hepatol. 2010;8(6):523–529. doi: 10.1016/j.cgh.2010.03.010. [DOI] [PMC free article] [PubMed] [Google Scholar]
- 16.Chen S, Wang W, Lee S, et al. Prediction of Germline mutations and cancer risk in the Lynch syndrome. JAMA. 2006;296:1479–87. doi: 10.1001/jama.296.12.1479. [DOI] [PMC free article] [PubMed] [Google Scholar]
- 17.Moreira L, Balaguer F, Lindor N, et al. Identification of Lynch Syndrome Among Patients with Colorectal Cancer. JAMA. 2012;308(15):1555–1565. doi: 10.1001/jama.2012.13088. [DOI] [PMC free article] [PubMed] [Google Scholar]
- 18.Weissman SM, Burt R, Church J, et al. Identification of Individuals at Risk for Lynch Syndrome Using Targeted Evaluations and Genetic Testing: National Society of Genetic Counselors and the Collaborative Group of the Americas of Inherited Colorectal Cancer Joint Practice Guideline. J Genet Counsel. 2012;21:484–493. doi: 10.1007/s10897-011-9465-7. [DOI] [PubMed] [Google Scholar]
- 19.Carethers JM. Differentiating Lynch-like from Lynch Syndrome. Gastroenterology. 2014;146(3):602–604. doi: 10.1053/j.gastro.2014.01.041. [DOI] [PMC free article] [PubMed] [Google Scholar]
- 20.Palomaki GE, McClain MR, Melillo S, et al. EGAPP supplementary evidence review: DNA testing strategies aimed at reducing morbidity and mortality from Lynch Syndrome. Genetics in Medicine. 2009;11:1–22. doi: 10.1097/GIM.0b013e31818fa2db. [DOI] [PMC free article] [PubMed] [Google Scholar]
- 21.Bonis PA, Trikalinos TA, Chung M, et al. Hereditary nonpolyposis colorectal cancer: accuracy of diagnostic strategies and implications to patients with colorectal cancer and their families. Evidence report/technology assessment. 2007;150:1–180. [PMC free article] [PubMed] [Google Scholar]