Abstract
A monomeric MnII complex has been prepared with the facially-coordinating TpPh2 ligand, (TpPh2 = hydrotris(3,5-diphenylpyrazol-1-yl)borate). The X-ray crystal structure shows three coordinating solvent molecules resulting in a six-coordinate complex with Mn-ligand bond lengths that are consistent with a high-spin MnII ion. Treatment of this MnII complex with excess KO2 at room temperature resulted in the formation of a MnIII-O2 complex that is stable for several days at ambient conditions, allowing for the determination of the X-ray crystal structure of this intermediate. The electronic structure of this peroxomanganese(III) adduct was examined by using electronic absorption, electron paramagnetic resonance (EPR), low-temperature magnetic circular dichroism (MCD), and variable-temperature variable-field (VTVH) MCD spectroscopies. Density functional theory (DFT), time-dependent (TD)-DFT, and multireference ab initio CASSCF/NEVPT2 calculations were used to assign the electronic transitions and further investigate the electronic structure of the peroxomanganese(III) species. The lowest ligand-field transition in the electronic absorption spectrum of the MnIII-O2 complex exhibits a blue shift in energy compared to other previously characterized peroxomanganese(III) complexes that results from a large axial bond elongation, reducing the metal-ligand covalency and stabilizing the σ-antibonding Mn dz2 MO that is the donor MO for this transition.
Introduction
Mononuclear peroxomanganese(III) species have been proposed to form in manganese containing enzymes, including manganese superoxide dismutase (MnSOD),1–6 manganese-dependent homoprotocatechuate 2,3-dioxygenase (MndD),7,8 and the oxalate-degrading enzymes oxalate oxidase9,10 and oxalate decarboxylase.11–13 These biological peroxomanganese(III) species are highly unstable and relatively little is known concerning their structural and electronic properties. In contrast, a variety of synthetic peroxomanganese(III) species have been generated and characterized, offering insights into the structural, electronic, and reactivity properties of this class of compound.14–27 Members of this class of compound include side-on peroxomanganese(III) adducts (MnIII-O2) and end-on alkylperoxomanganese(III) adducts (MnIII-OOR).28,29
While there are several examples of MnIII-O2 complexes with anionic supporting ligands,14,22,25,30 there are no detailed bonding descriptions of such complexes. As many enzymatic MnIII-O2 adducts are expected to feature anionic ligands, this represents a gap in knowledge. In addition, the electronic structures of crystallographically characterized MnIII-O2 adducts have not generally been explored in detail.30
A mononuclear MnIII-O2 complex supported by the monoanionic facially-coordinating trispyrazolyl TpiPr2 ligand (TpiPr2 = hydrotris(3,5-diisopropylpyrazol-1-yl)borate) and an ancillary, monodentate 3,5-isopropylpyrazole (pziPr2H) ligand was previously reported to be stable at room temperature for a few hours.22 It was observed that the peroxo ligand in this [MnIII(O2)(TpiPr2)(pziPr2H)] complex is bound to the MnIII ion in a side-on (η2) fashion, and the coordination sphere is completed by the four N-donors from the TpiPr2 ligand and the monodentate pziPr2H ligand. When this MnIII-O2 complex was cooled from 253 to 193 K, the pziPr2H ligand formed a hydrogen bond with one O atom of the peroxo unit, and this changed the absorption spectrum.22,27 Specifically, the absorption maxima shifted from 561 to 583 nm (17 820 to 17 150 cm−1) causing the color of the complex to change from brown (at 253 K) to blue (at 193 K). In contrast, the frequency of the peroxo O-O vibration (νO-O), was not perturbed at all by this hydrogen bonding interaction. The absence of a shift in νO-O is surprising, but consistent with the statistically identical O-O bond lengths of the blue and brown isomers (1.43(1) and 1.428(7), respectively).22 A slightly higher-energy νO-O frequency of 896 cm−1 was observed for the related complex [MnIII(O2)(Tp)(Me-Im)], which displays an intermolecular hydrogen-bond in the solid-state crystal structure (O-O of 1.42(1) Å).22
In a recent review,23 we noted that MnIII-O2 adducts supported by the TpiPr2 ligand22,27 represent a unique geometry compared to other mononuclear MnIII-O2 adducts. Following a formalism proposed by Kitajima et al.,22 if the peroxo unit is viewed as a monoligand, the τ parameter, as defined in Scheme 1, may be used to classify MnIII-O2 adducts along a spectrum of geometries from square pyramidal (τ = 0) to trigonal bipyramidal (τ = 1).23 In contrast, crystallographically-characterized mononuclear MnIII-O2 adducts supported by tetramethylcylam (TMC) and its derivatives (Scheme 1) show τ parameters from 0 to 0.52, with the variation reflecting the size of the macrocyclic ring.14,21,24
Scheme 1.
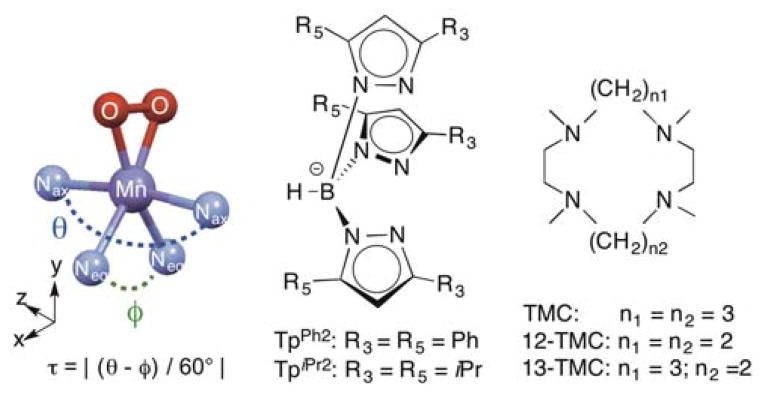
Representative MnIII-O2 with calculation of τ (left), Tp type ligands (middle), and TMC type ligands (right).
The Tp-supported MnIII-O2 adducts also appear distinct from other mononuclear MnIII-O2 species in terms of their electronic absorption properties, and this could be related to differences in geometric structure. While the blue and brown isomers of [MnIII(O2)(TpiPr2)(pziPr2H)] show only very weak absorption features at ~560 – 580 nm, MnIII-O2 adducts supported by a variety of neutral N4 ligands show moderately intense absorption bands from ~415 – 450 nm (ε ≈ 250 – 500 M−1cm−1), with lower-intensity features at ~590 – 620 nm.23 However, a complication in this comparison is that, while the onset of more intense features at wavelengths lower than 450 nm are apparent in the published electronic absorption spectra of [MnIII(O2)(TpiPr2)(pziPr2H)], no absorption maxima were reported.
On the basis of these considerations, we investigated whether a MnIII-O2 unit could be supported by the related, but synthetically more accessible, TpPh2 ligand (Scheme 1) in order to more fully understand the spectroscopic properties of a Tp-supported MnIII-O2 adduct and determine the consequences of the pseudo-trigonal bipyramidal geometry. Herein, we describe the synthesis, structural, and spectroscopic characterization of [MnIII(O2)(TpPh2)(THF)], which is formed by treatment of the corresponding MnII complex with excess KO2. An X-ray diffraction (XRD) structure of [MnIII(O2)(TpPh2)(THF)] reveals a mononuclear MnIII-O2 unit with the bulky phenyl groups shielding the peroxo ligand.
Electronic absorption, electron paramagnetic resonance (EPR), magnetic circular dichroism (MCD) and variable-temperature, variable-field (VTVH) MCD spectroscopies are used to determine ground-state zero-field splitting parameters and electronic transition energies for this complex. The spin-allowed d-d transitions of [MnIII(O2)(TpPh2)(THF)], which are highly sensitive to the coordination sphere of the MnIII center, are found to be blue shifted in energy compared to those of other peroxomanganese(III) complexes. The electronic structure causing this perturbation was further investigated using density functional theory (DFT) and multi-reference ab initio computations. Previously, spectroscopic changes in some MnIII-O2 complexes have been attributed to variations in the Mn-Operoxo bond lengths;16,32 however, as the Mn-Operoxo bond lengths of [MnIII(O2)(TpPh2)(THF)] are within the range studied, they cannot account for the large spectroscopic perturbation observed. The combined spectroscopic and computational analysis presented here reveals that, for this system, ligand perturbations perpendicular to the MnIII-O2 unit can account for spectral differences. This work thus expands upon our previous investigations aiming at defining structural origins of spectral variations in peroxomanganese(III) complexes.16,18,23,32
Experimental
Materials
All chemicals and solvents were obtained from commercial vendors at ACS reagent-grade or better and were used without further purification. Synthesis of the MnII complex was carried out under argon using a glovebox.
Instrumentation
1H NMR spectra were obtained on a Bruker DRX 400 MHz NMR spectrometer. Electronic absorption spectra were recorded on a Cary 50 Bio spectrophotometer (Varian) interfaced with a Unisoku cryostat (USP-203-A). ESI-mass spectrometry experiments were performed using an LCT Primers MicroMass electrospray-ionization time-of-flight instrument. EPR spectra were collected on Bruker EMXPlus instrument with a dual mode cavity. Magnetic circular dichroism (MCD) spectra were collected on a spectropolarimeter (Jasco J-815) interfaced with a magnetocryostat (Oxford Instruments SM-4000-8) capable of horizontal fields up to 8 T.
Preparation of [MnII(TpPh2)(DMF)3](OTf)
Potassium tris(3,5-diphenylpyrazol)hydroborate (TpPh2) was prepared as previously described by condensing 3 molar equivalents of 3,5-diphenylpyrazole with KBH4.33,34 Mn(OTf)2 was prepared by a previously reported procedure by reacting equal molar amounts of (CH3)3Si(OTf) and anhydrous MnCl2.24
The [MnII(TpPh2)](OTF) complex was prepared by adding TpPh2 (1.0 g, 1.411 mmol) in 30 mL DMF to a stirred solution of Mn(OTf)2 (0.497 g, 1.411 mmol) in 20 mL of DMF. The colorless solution was stirred for 4 hours. Precipitation of the crude product was obtained by addition of diethyl ether. [MnII(TpPh2)(DMF)3](OTf) (1.39 g, 90%) M+ [({[Mn(TpPh2)]}+) 724.2; requires M+, 724.2].
In Situ Preparation of [MnIII(O2)(TpPh2)(THF)] Complex
The yellow peroxomanganese(III) intermediate was formed by treating a THF solution of [MnII(TpPh2)(DMF)3](OTf) with a KO2 slurry at ambient conditions. To optimize formation of the peroxomanganese(III) species, the slurry was prepared by stirring 25 equivalents of KO2 in a 50:50 mixture of 2-Me-tetrahydrofuran:THF for 20 minutes. Treatment with smaller amounts of KO2 resulted in lower yields of the MnIII-O2 species. 50 μL of the KO2 slurry was added to the [MnII(TpPh2)(DMF)3](OTf) solution and stirred for 3 minutes, forming a brown precipitate. A second addition of 50 μL of the KO2 slurry was added and the solution was stirred for 15 minutes. The brown precipitate was filtered from the solution, and a yellow solution was obtained. The peroxomanganese(III) intermediate was isolated by removing the solvent under vacuum and washing the solid residue with toluene to remove unreacted [MnII(TpPh2)(DMF)3](OTf).
X-ray Crystallography
Single needle crystals of [MnII(TpPh2)(DMF)3](OTf) were grown by layering heptane on a THF solution of the metal complex at ambient temperature. Single needle crystals of [MnIII(O2)(TpPh2)(THF)] were grown by vapor diffusion of diethyl ether into a 50:50 mixture of 2-Me-tetrahydrofuran:THF at −20 °C.
Diffracted intensities were measured for [MnII(TpPh2)(DMF)3](OTf) and [MnIII(O2)(TpPh2)(THF)] using monochromated Cu-Kα radiation (λ = 1.54178) on a Bruker Single Crystal Diffraction System equipped with Helios high-brilliance multilayer X-ray optics, an APEX II CCD detector, and a Bruker MicroSTAR microfocus rotating anode X-ray source operated at 45 kV and 60 mA. Lattice constants were determined with the Bruker SAINT software package. The Bruker software package SHELXTL was used to solve the structure using “direct methods” techniques. All states of weighted full-matrix least-squares refinement were conducted using Fo2 data with the SHELXTL Version 6.10 software package.35 Crystal data for [MnII(TpPh2)(DMF)3](OTf) and [MnIII(O2)(TpPh2)(THF)] are supplied in Table 1, and full data collection and refinement parameters are summarized in the Electronic Supplementary Information (ESI) in Tables S1 and S2.
Table 1.
Crystal data for [Mn(TpPh2)(DMF)3](OTf)(C59H63BF3MnN9O7S) and [Mn(O2)(TpPh2)(THF)] (C58H62BMnN6O5).
| formula | C59H63BF3MnN9O7S | C58H62BMnN6O5 |
| MW | 1164.99 | 988.89 |
| T, K | 100(2) | 100(2) |
| unit cell | monoclinic | monoclinic |
| a, Å | 17.6441(10) | 12.928(2) |
| b, Å | 14.8052(8) | 21.642(4) |
| c, Å | 21.9441(11) | 18.633(3) |
| α | 90 | 90 |
| β | 93.243(4) | 103.572(4) |
| γ | 90 | 90 |
| V, Å3 | 5723.2(5) | 5067.5(15) |
| Z | 4 | 4 |
| d(calcd), g/cm3 | 1.352 | 1.296 |
| space group | P2(1)/n | P2(1)/n |
| R | 0.0638 | 0.0514 |
| Rw | 0.1649 | 0.1474 |
| GOF | 0.928 | 1.077 |
R = Σ ||Fo| − |Fc||/Σ |Fo|
Rw = {Σ [w(Fo2 − Fc2)2]/Σ [w(Fo2)2]}1/2
EPR Experiments
A frozen sample of [MnII(TpPh2)(DMF)3](OTf) (250 μm) was prepared in THF at ambient temperature and flash-frozen in a quartz EPR tube in liquid N2. Collection of EPR data in the same solvent as MCD experiments (75:25 mixture of 2-Me-tetrahydrofuran:THF, vide infra) was unsuccessful due to the propensity of this solvent system to partially melt during transfer of the EPR tubes from the liquid nitrogen storage dewar to the EPR cryostat, resulting in shattered EPR tubes. An EPR sample of [MnIII(O2)(TpPh2)(THF)] was prepared after filtering the brown precipitate from the yellow solution and confirming the characteristic spectrum of this complex by UV-visible spectroscopy. Frozen samples of [MnIII(O2)(TpPh2)(THF)] (250 μm), prepared using both the crude yellow residue and the purified residue obtained through a toluene wash, were prepared in THF at ambient temperature and flash-frozen in quartz EPR tubes in liquid N2. All data were collected on an X-band (9 GHz) Bruker EMXPlus spectrophotometer with an Oxford ESR900 continuous-flow liquid helium cryostat and an Oxford ITC503 temperature system to regulate the temperature. To collect perpendicular and parallel-mode spectra, a Bruker ER4116DM dual-mode cavity was used. Spectra were collected under non-saturated conditions with 9.3918 GHz microwave frequency, 20 dB microwave power, 0.6 mT modulation amplitude, 100 kHz modulation frequency and 163 ms time constant. The Matlab- based EPR simulation software package EasySpin, developed by Stoll,36 was used to simulate and fit all EPR spectra and to determine zero-field splitting parameters of the peroxomanganese(III) complex.
Magnetic Circular Dichroism Experiments
A frozen glass sample of [MnIII(O2)(TpPh2)(THF)] (15 mM) was prepared in 75:25 mixture of 2-Me-tetrahydrofuran:THF at ambient temperature, transferred to MCD cells, and flash-frozen in liquid N2. The obtained MCD spectra were measured in mdeg (θ) and converted to Δε (M−1cm−1) using the standard conversion factor Δε = θ/(32980·c·d), where c is the concentration of the sample and d is the path length. MCD spectra were collected at 2, 4, 8, and 15 K for positive and negative field strengths of 1 to 7 T in 1 T increments. VTVH data were fit using the general method developed by Neese and Solomon.37 Fits were performed for an S = 2 system with isotropic g-values of 2.00. Using a previously described protocol,3 zero-field splitting (ZFS) parameters D and E/D were systematically varied while the transition moment products were optimized for a given set of ZFS parameters. The goodness of fit was evaluated by the χ2 factor; where χ2 is the sum of the squares of the differences between experimental and fit data sets.
X-ray Absorption Spectroscopy
The [MnII(TpPh2)(DMF)3](OTf) XAS sample was prepared as a 4% (w/w) dispersion by grinding 8 mg of [MnII(TpPh2)(DMF)3](OTf) with 192 mg boron nitride into a powder with a mortar and pestle. Solution phase XAS samples of [MnIII(O2)(TpPh2)(THF)] were prepared by several methods and then transferred to XAS sample holders and flash frozen in liquid N2. Methods of solution preparation included: 15 mM [MnIII(O2)(TpPh2)(THF)] in 50:50 2-Me-tetrahydrofuran:THF, 5 mM [MnIII(O2)(TpPh2)(THF)] in THF, and 15 mM [MnIII(O2)(TpPh2)(THF)] in THF with isolation by toluene wash. All attempts at XAS data collection for [MnIII(O2)(TpPh2)(THF)] were thwarted by photoreduction or sample degradation. XAS spectra were recorded on beamline X3B at the National Synchrotron Light Source (NSLS), Brookhaven National Lab (storage ring conditions, 2.8 GeV, 100 – 300 mA). Mn K-edge X-ray absorption spectra over the energy range 6.4 – 7.4 keV (Si(111) monochrometer) were recorded on a powder sample maintained at 20 K with a helium Displex closed-cycle cryostat. XAS spectra were obtained as fluorescence excitation spectra using a solid-state 13-element germanium detector (Canberra). Contamination of higher harmonics radiation was minimized with a harmonic rejection mirror. Background fluorescence signal was reduced with a 3 μm chromium filter. A manganese foil spectrum was recorded concomitantly for internal energy calibration, and the first inflection point of the K-edge energy was assigned to 6539.0 eV. Spectra were measured with 5 eV steps below the edge (6359 – 6529 eV), 0.3 eV steps in the edge region (6529 – 6564 eV), and steps equivalent to 0.05 Å−1 increments above the edge.
EXAFS data reduction and averaging were performed using the program EXAFSPAK.38 The pre-edge background intensity was removed by fitting a Gaussian function to the pre-edge background and then subtracting this function from the whole spectrum. The spectrum was also fit with a three-segment spline with fourth-order polynomial components to remove low- frequency background. EXAFS refinement was carried out on k3χ(k) data, using phase and amplitude functions obtained from FEFF, version 6,39 and a structural model of [MnII(TpPh2)(DMF)3](OTf) with XRD coordinates. For each fit, the parameters r (average distance between Mn and scattering atom) and σ2 (Debye-Waller factor) were optimized, while n, the number of atoms in the shell, was kept fixed. n was varied by integer steps systematically. The goodness-of-fit (GOF) was evaluated by the parameter F, where F = Σ (χcalcd − χexpt)2/N, and N is the number of data points. The threshold energy, E0, in electronvolts (k = 0 point) was kept at a common, variable value for every shell of a given fit.
Density Functional Theory Calculations
The ORCA 3.0.1 software package was used for all DFT computations.40 An initial model of [MnIII(O2)(TpPh2)(THF)] was built using the X-ray coordinates obtained in this work. Models of the brown and blue isomers of [MnIII(O2)(TpiPr2)(pziPr2H)] were built using the X-ray coordinates of these complexes.22 Geometry optimizations of these models were converged to the S = 2 spin state. These calculations employed the Becke-Perdew (BP86) functional41,42 and the SVP (Ahlrichs split valence polarized)43,44 basis sets with the SV/J auxiliary basis sets for all atoms except for manganese, nitrogen, and oxygen, where the larger TZVP (Ahlrichs triple-ζ valence polarized)20 basis sets in conjunction with the TZV/J auxiliary basis sets were used. The resolution of identity (RI) approximation45 was used for all calculations. Solvation effects associated with THF (dielectric constant ε = 7.25) for the TpPh2 complexes and toluene (dielectric constant ε = 2.40) for the TpiPr2 complexes were incorporated using COSMO, as implemented in ORCA.46 Cartesian coordinates for all DFT- optimized models are included in ESI (Tables S3–S8).
Electronic transition energies and intensities were computed for [MnIII(O2)(TpPh2)(THF)] and the brown and blue isomers of [MnIII(O2)(TpiPr2)(pziPr2H)] using the TD-DFT method47–49 within the Tamm-Dancoff approximation.50,51 These calculations employed the B3LYP functional,52–54 and the SVP basis set for all atoms except for manganese, nitrogen, and oxygen, where the larger TZVP was used. For the [MnIII(O2)(TpPh2)(THF)] calculation, 40 excited states were calculated by including all one-electron excitations within an energy window of ±3 Hartrees with respect to the HOMO/LUMO energies. Additionally, truncated versions of [MnIII(O2)(TpPh2)(THF)] were also employed for TD-DFT calculations, however, the full molecule yielded the optimal results. For the larger [MnIII(O2)(TpiPr2)(pziPr2H)] complexes, 20 excited states were calculated using the full complex. Isosurface plots of molecular orbitals (MOs) and electron density difference maps (EDDMs) were generated using the gOpenMol program using isodensity values of 0.01 and 0.005 b−3, respectively. Additional electronic transition calculations were performed for [MnIII(O2)(TpPh2)(THF)] using the CASSCF calculations in conjunction with second-order-N-electron valence state perturbation theory (NEVPT2) method.55 These calculations employed the RI approximation45 and the TZVP basis set for manganese, nitrogen, and oxygen and SVP for all other atoms. The active space was selected to include CAS(4, 5), which includes all the 3d electrons of the MnIII center, and was calculated with five quintet roots and ten triplet roots.
Results and Discussion
Structural properties of [MnII(TpPh2)(DMF)3](OTf)
The MnII complex [MnII(TpPh2)(DMF)3](OTf) was generated by treatment of Mn(OTf)2 with TpPh2 in dimethylformamide (DMF). Diffraction quality crystals were obtained by vapour diffusion of diethyl ether into the DMF solution of [MnII(TpPh2)(DMF)3](OTf). Figure 1 (left) displays an ORTEP diagram for [MnII(TpPh2)(DMF)3](OTf). Selected bond distances and angles are given in Table 2. The tridentate TpPh2 ligand is bound facially, creating three coordination sites occupied by DMF ligands that complete the coordination sphere to give a six-coordinate MnII ion in a distorted octahedral geometry. The Mn- ligand bond lengths range from ~2.14 to 2.32 Å, typical of a high-spin MnII ion, and also consistent with reports of previously characterized MnII species supported by Tp-based ligands.56–58 Specifically, the Mn-Npyrazole bond lengths of [MnII(TpPh2)(DMF)3](OTf) and other mononuclear MnII complexes fall within the range of 2.149(2) to 2.319(1) Å (Table 3). Figure 1 (right) displays a view along the three-fold axis of the space filling model for [MnII(TpPh2)(DMF)3](OTf) without the coordinated solvent molecules. This perspective highlights the open face of the metal ion that is shielded by the phenyl groups of the supporting ligand.
Figure 1.
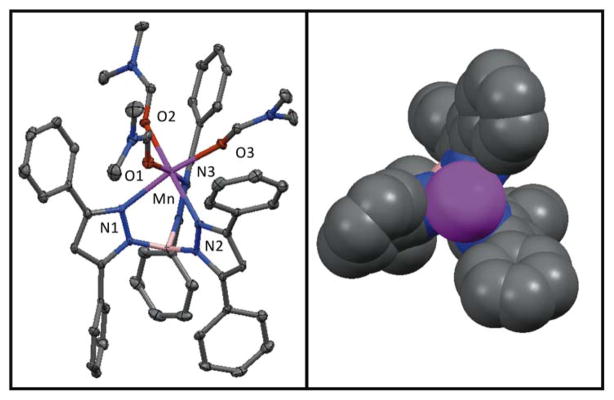
ORTEP diagram of [MnII(TpPh2)(DMF)3](OTf) (left) and space filling model (right). For the ORTEP diagram, hydrogen atoms and the counter anion have been removed for clarity. For the space filling model hydrogen atoms, coordinating solvents molecules, and the counter anion have been removed for clarity. The significant interatomic distances and angles are listed in Table 2.
Table 2.
Selected bond lengths (Å) and angles (°) for [MnII(TpPh2)(DMF)3](OTf).
| Mn-N(1) | 2.286(1) | N(1)-Mn-O(3) | 169.1(5) |
| Mn-N(2) | 2.250(3) | N(2)-Mn-O(2) | 172.0(2) |
| Mn-N(3) | 2.319(1) | N(3)-Mn-O(1) | 171.6(2) |
| Mn-O(1) | 2.157(3) | N(1)-Mn-N(2) | 83.3(4) |
| Mn-O(2) | 2.141(6) | N(1)-Mn-N(3) | 86.5(2) |
| Mn-O(3) | 2.191(1) | N(2)-Mn-N(3) | 86.7(9) |
Table 3.
Mn-Npyrazole bond lengths (Å) for [MnII(TpPh2)(DMF)3](OTf) and other MnII(Tp) complexes.
Conversion of [MnII(TpPh2)(DMF)3](OTf) to [MnIII(O2)(TpPh2)(THF)]
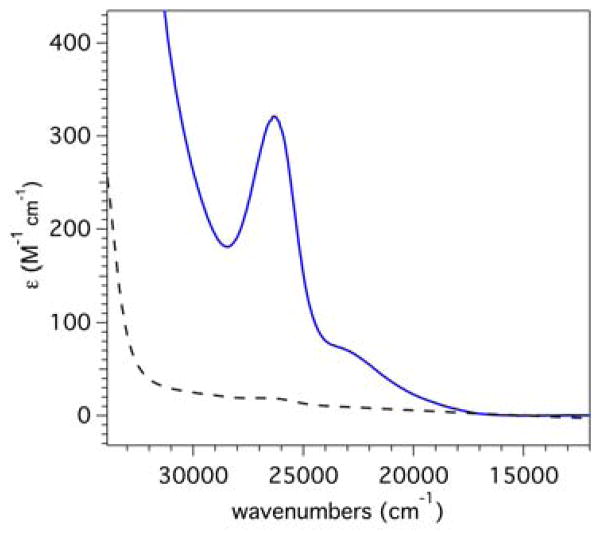
No intense features are observed in the electronic absorption spectra of tetrahydrofuran (THF) solutions of [MnII(TpPh2)(DMF)3](OTf) at energies below 33 000 cm−1 (Figure 2; dashed line). A weak feature is observed at ~28 000 cm−1 (ε = 20 M−1cm−1) that could arise from a MnII-to-ligand (TpPh2) charge-transfer (CT) transition. While the intensity is very low for a CT feature, the intensity of this band is at least an order of magnitude larger than that expected for a spin-forbidden MnII ligand-field transition.59
Figure 2.
Electronic absorption spectra of [MnII(TpPh2)(DMF)3](OTf) (black dashed trace) and the yellow intermediate, [MnIII(O2)(TpPh2)(THF)], (solid blue trace) at 298 K in THF.
Treatment of [MnII(TpPh2)(DMF)3](OTf) with excess KO2 at room temperature results in the formation of a yellow intermediate and a brown precipitate. After filtering the brown precipitate from the solution to obtain the yellow intermediate, new absorption features are present in the visible region. The absorption spectra of the yellow intermediate is characterized by a prominent band at 26 385 cm−1 and a weaker, broader band at 22 936 cm−1 (ε = 324 and 73 M−1 cm−1, respectively). For the previously reported [MnIII(O2)(TpiPr2)(pziPr2H)] complex, a weak, broad band was observed at 17 800 cm−1 which shifted to 17 150 cm−1 when a pyrazole-peroxo hydrogen bond was formed.22 More intense features were apparent at higher energy, but no band maxima were reported. The extinction coefficient for the ~17 000 cm−1 transition of [MnIII(O2)(TpiPr2)(pziPr2H)] (~50 M−1 cm−1) is similar to that of the lowest-energy band of the yellow intermediate. Thus, these data are supportive of the formulation of the yellow intermediate as a peroxomanganese(III) adduct. Unlike the low-energy absorption band of the [MnIII(O2)(TpiPr2)(pziPr2H)] complex that red-shifts and increases in intensity upon cooling from 253 to 193 K,14 the absorption bands of the yellow intermediate sharpen and show a slight blue-shift (~100 cm−1) and increase in intensity (~17 % for the intense band at 26 320 cm−1) when a 75:25 mixture of 2-Me-tetrahydrofuran:THF solution of the sample is cooled from 300 to 200 K (ESI Figure S1).
X-ray Diffraction Structure of the yellow intermediate: [MnIII(O2)(TpPh2)(THF)]
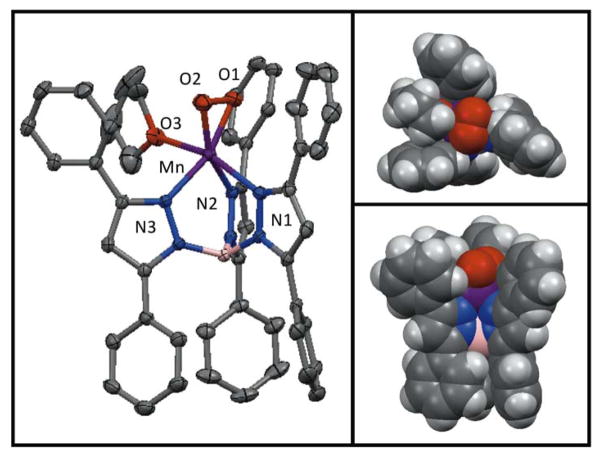
Because of the high thermal stability of the yellow intermediate (t1/2 = 4.5 days in THF), we were able to obtain single crystals suitable for XRD experiments. The XRD structure of the yellow needle crystals revealed a neutral mononuclear six-coordinate MnIII complex with a side-on peroxo ligand and a coordinated THF molecule, [MnIII(O2)(TpPh2)(THF)] (Figure 3). Selected bond distances and angles are given the Table 4. The MnIII ion is in a distorted octahedral geometry with an axial elongation along the (THF)O-Mn-N(1) axis (bond lengths of 2.313(7) Å and 2.375(2) Å, respectively). Here, the peroxo ligand and the N2 and N3 atoms of the TpPh ligand define the equatorial plane. The other Mn-N bond distances are nearly identical, with Mn-N(2) and Mn-N(3) bond lengths of 2.09 Å. The peroxo ligand is nearly symmetrically bound to the MnIII ion with Mn-O distances of 1.865(2) and 1.859(2). The O-O bond length is 1.432(3) Å, which is typical of a peroxo ligand bound to a transition-metal ion and is in good agreement with other reported MnIII-O2 complexes (Table 2).22,27,14,24,30 Considering the peroxo as a monoligand, a τ parameter of 1.2 is obtained, indicating that this complex is at the trigonal bipyramidal limit, similar to other Tp-supported MnIII-O2 adducts.23 (The τ parameter of greater than 1, which would not be possible for authentic five-coordinate complexes, results from our specific definition of τ for MnIII-O2 adducts.31) Figure 3 (right) displays perpendicular views of the space filling model for [MnIII(O)2(TpPh2)(THF)]. The peroxo ligand is well shielded by the three phenyl groups of the TpPh2 ligand, which could account for the high thermal stability of this complex.
Figure 3.
ORTEP diagram of [MnIII(O2)(TpPh2)(THF)] (left) and space filling models (right). For the ORTEP diagram, hydrogen atoms have been removed for clarity. Select interatomic distances and angles are listed in Table 4.
Table 4.
Selected bond lengths (Å) and angles (°) for [MnIII(O2)(TpPh2)(THF)].
| Mn-O(1) | 1.865(2) | O(1)-O(2) | 1.432(3) |
| Mn-O(2) | 1.859(2) | N(2)-Mn-O(1) | 109.1(2) |
| Mn-O(3)a | 2.313(7) | N(3)-Mn-O(2) | 111.9(9) |
| Mn-N(1) | 2.375(2) | N(1)-Mn-O(3)a | 163.1(2) |
| Mn-N(2) | 2.095(2) | N(1)-Mn-N(3) | 84.5(1) |
| Mn-N(3) | 2.091(2) | N(1)-Mn-N(2) | 84.6(9) |
O(3) refers to the O atom of the THF ligand
EPR Experiments
X-band EPR spectra were collected for frozen solutions of [MnII(TpPh2)(DMF)3](OTf) and [MnIII(O2)(TpPh2)(THF)] at 5 K in perpendicular and parallel mode. In perpendicular mode, a THF solution of [MnII(TpPh2)(DMF)3](OTf) exhibits a 6-line signal at g1 = 2.03 with hyperfine splitting of 9.1 mT, indicative of mononuclear MnII (Figure 4, left; black trace). Additionally, a weaker feature at g2 = 4.1 is present with hyperfine splitting of 7.9 mT. Upon the treatment of this solution with an excess of KO2 and filtering to remove the brown precipitate, a 93% decrease in the intensity at g1 is observed. (Figure 4, left; blue trace). No signals are observed in the parallel-mode spectrum of this crude solution. Isolation of [MnIII(O2)(TpPh2)(THF)] by removing the solvent under vacuum and washing with toluene further decreased the intensity at g1 by a total of 98% (Figure 4, left; red trace). A parallel mode spectrum of this purified sample of the yellow intermediate exhibits a characteristic MnIII feature at g = 8.3 with hyperfine splitting of 5.06 mT (Figure 4, right). Variable-temperature parallel-mode spectra collected from 5 to 20 K revealed an inverse temperature dependence, indicating a negative sign of the axial zero-field splitting (ZFS) parameter D (ESI, Figure S2). The EPR data for [MnIII(O2)(TpPh2)(THF)] were simulated with g = 1.98, S = 2, a hyperfine splitting of 5.1 mT and the ZFS parameters D = 2.0(5) cm−1 and E/D = 0.07(1). (Figure 4, right). The goodness of fit of the simulation was extremely sensitive to changes in the magnitude of E/D (varied in increments of 0.01 cm−1) and less sensitive to the magnitude of D (varied in increments of 0.1 cm−1). The sensitivity of these parameters arises because the value of E determines the splitting of the ms ± 2 levels that gives rise to the EPR signal, and a value of D that is greater than the microwave quantum value does not significantly impact the EPR signal.
Figure 4.
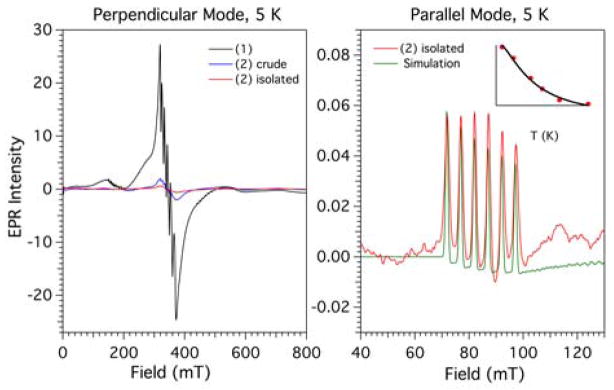
Left: 5 K perpendicular-mode EPR spectrum of the conversion of [MnII(TpPh2)(DMF)3](OTf) to [MnIII(O2)(TpPh2)(THF)] and purification of [MnIII(O2)(TpPh2)(THF)]. Right: 5 K parallel-mode EPR spectrum of [MnIII(O2)(TpPh2)(THF)] (red) and simulation (green) with D = −2.0(5), E/D = 0.07(1). Inset: signal intensity versus temperature of g = 8.3 signal. An EPR spectrum of [MnIII(O2)(TpPh2)(THF)] showing a wider field is in ESI, Figure S3.
Further Spectroscopic Characterization of [MnIII(O2)(TpPh2)(THF)]
IR data collected for a KBr pellet of [MnIII(O2)(TpPh2)(THF)] show a weak feature at 882 cm−1 (ESI, Figure S4) which is in the expected region for an O-O vibration of a mononuclear MnIII-O2 adduct (νO-O = 875 – 896 cm−1).23 Because solid samples of [MnIII(O2)(TpPh2)(THF)] could only be successfully prepared using a large excess of KO2, and we were unable to collect reliable IR data for solution samples of [MnIII(O2)(TpPh2)(THF)], we did not attempt any isotopic labelling studies using K18O2. Although the peak at 882 cm−1 is not observed in the corresponding IR spectrum of [MnII(TpPh2)(DMF)3](OTf), (Figure S4), we cannot definitively assign the band at 882 cm−1 as the νO-O mode of [MnIII(O2)(TpPh2)(THF)] in the absence of the isotopic labelling experiment.
To gain additional insights into the ground- and excited-state properties of [MnIII(O2)(TpPh2)(THF)], we collected low- temperature MCD and VTVH MCD data. All MCD signals of [MnIII(O2)(TpPh2)(THF)] observed from 15 000 to 32 000 cm−1 show C-term behavior (i.e., their intensities show an inverse temperature dependence; see ESI Figure S5). Figure 5 (bottom) shows the 2 K, 7 T MCD spectra of [MnIII(O2)(TpPh2)(THF)]. The corresponding 298 K electronic absorption spectrum is included for comparison (Figure 5, top). In the absorption spectrum, [MnIII(O2)(TpPh2)(THF)] shows low-intensity features from ~18 000 – 24 000 cm−1 with a slight maximum at 22 900 cm−1. This fairly indistinct region of the absorption spectrum corresponds to a set of MCD features at 19 000 (−), 22 200 (+), 23 500 (−, shoulder), and 24 100 (−) cm−1. The major absorption band at 26 320 cm−1 corresponds to an intense, positively-signed MCD band at roughly the same energy (26 200 cm−1). An iterative Gaussian deconvolution of the absorption and MCD spectra reveals a total of nine electronic transitions from 16 500 to 31 000 cm−1 (ESI, Table S9). Tentative assignments can be made for these transitions on the basis of the different selection rules for electronic absorption and MCD spectroscopy, as well as previous spectral analysis of mononuclear MnIII-O2 adducts.16 More detailed band assignments developed using TD-DFT computations are discussed later. Bands 2, 8, and 9, which are fairly prominent in the absorption spectrum but carry comparatively little MCD intensity are assigned as peroxo-to-manganese(III) CT transitions (Table 5).60 Bands 4 and 6, which exhibit very narrow bandwidths in the MCD spectrum and carry essentially negligible absorption intensity, are assigned as spin-forbidden MnIII d-d transitions (Table 5). The narrow widths of these transitions are indicative of small excited state distortions and suggest that these transitions are intra-configurational. Bands 1, 3, 5, and 7 exhibit high to moderate intensity in the MCD spectrum and are assigned as the four ligand-field d-d transitions expected for an S = 2 MnIII center (Table 5, Figure 6). Here, we note that the high energy of band 1 (19 000 cm−1), which is the lowest-energy d-d transition, makes [MnIII(O2)(TpPh2)(THF)] unique compared to peroxomanganese(III) species supported by the tetradentate bis(pyridyl)- and bis(quinolinyl)-diazepane ligands, where the corresponding transition ranged from 13 650 – 16 630.16,18,32 For that series of complexes, this variation was related to slight differences in one Mn–Operoxo distance (1.869 – 1.907 Å). Because the Mn–Operoxo distances of [MnIII(O2)(TpPh2)(THF)] fall within this range (see Table 4), another structural perturbation must account for the high energy of band 1 in this case.
Figure 5.
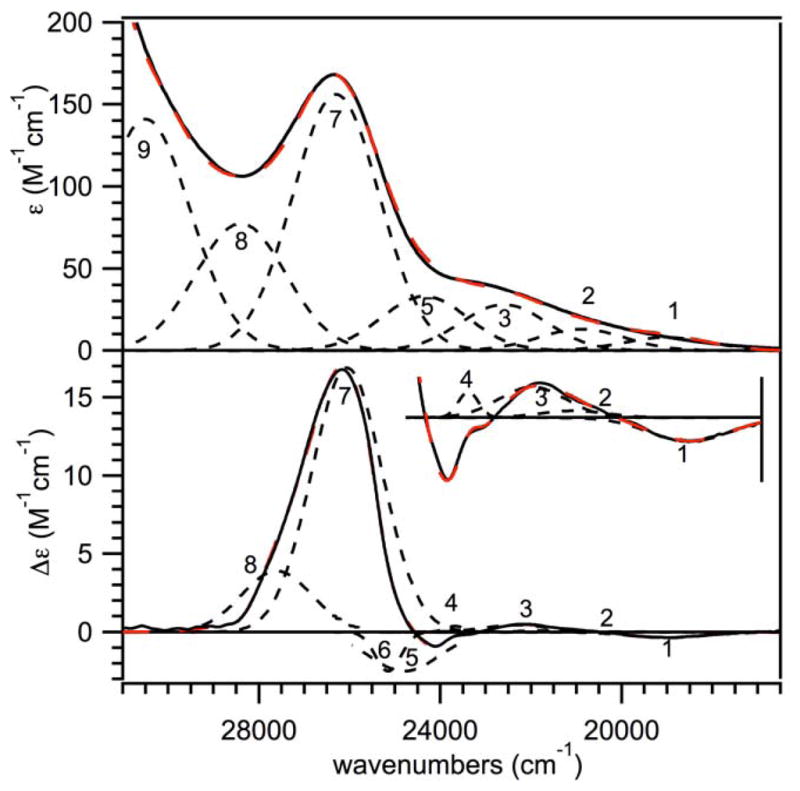
298 K electronic absorption (top) and 2 K, 7 T MCD (bottom) spectra of [MnIII(O2)(TpPh2)(THF)]. Inset: An 15-fold enhancement of the 2 K, 7 T MCD spectra from 17 500 to 25 000 cm−1. Individual Gaussian curves (black dotted lines) and their sums (red dashed lines) obtained from iterative fits of these data sets are displayed on their respective spectra. Only Gaussian bands 1 – 4 are shown in the inset. Conditions: Absorption data were collected for a 2.5 mM sample in THF. MCD data were collected for a 15 mM frozen glass sample in 75:25 solution of 2-Me-THF:THF.
Table 5.
MCD, electronic absorption, calculated TD-DFT, and NEVPT2 electronic transition energies (cm−1) of [MnIII(O2)(TpPh2)(THF)]. Corresponding oscillator strengths are included in ESI, Table S14.
| Band | Experimental
|
Calculated
|
Assignment | ||
|---|---|---|---|---|---|
| Abs. | MCD | TD-DFT | NEVPT2 | ||
| 1 | 19 000 | 19 000 | 20 500 | 25 700 | dz2 − dxyc |
| 2 | 20 890 | 21 455 | 23 300 | - | CTd |
| 3 | 22 600 | 22 325 | 27 200 | 29 500 | dyz − dxyc |
| 4 | - a | 23 675 | - | 26 800b | SFb |
| 5 | 24 350 | 24 800 | 28 800 | 31 600 | dx2−y2 − dxyc |
| 6 | - a | 25 150 | - | 30 500b | SFb |
| 7 | 26 300 | 26 060 | 30 600 | 32 000 | dxz − dxyc |
| 8 | 28 400 | 27 609 | 29 500 | - | CTd |
| 9 | 28 350 | 29 800 | - | CTd,e | |
Band only apparent in low-temperature, 7 T MCD spectrum.
MnIII spin-forbidden d-d transitions to triplet excited states
Assigned as a spin-allowed transition involving primarily the Mn 3d orbitals as indicated.
Assigned as peroxo-to-manganese(III) charge transfer transition.
Based on the low MCD intensity of band 9, this feature could arise from a TpPh2-based charge-transfer transition.
Figure 6.
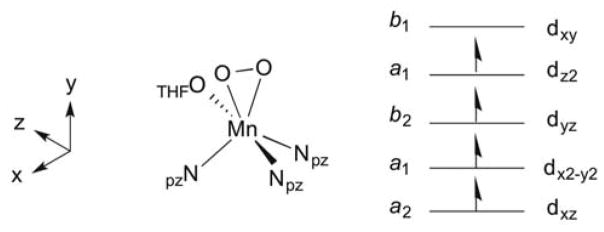
First coordination sphere of [MnIII(O2)(TpPh2)(THF)] and D-tensor coordinate system from CP-DFT computations. The C2v symmetry labels for the Mn 3d orbitals using the D-tensor coordinate system are provided.
VTVH MCD spectroscopy37,61 was used to probe both the ZFS parameters and transition polarizations of [MnIII(O2)(TpPh2)(THF)]. VTVH MCD curves obtained for [MnIII(O2)(TpPh2)(THF)] at 26 180 cm−1 are nested, indicating a moderate ZFS of the MnIII ion (Figure 7) and were systematically fitted to obtain zero field splitting parameters. The best fits (χ2 < 0.04) were obtained with D = −2.0 cm−1, E/D = 0.05 and a predominant z- polarization (<1% x, <1% y-, and 98% z-polarization). These ZFS parameters are in excellent agreement with those obtained from the EPR data (D = −2.0(5) cm−1; E/D = 0.07(1). In addition, these ZFS splitting parameters fall in the range of those reported for other peroxomanganese(III) adducts (D = −1.5 to −3.0 and E/D = 0.05 to 0.30).16,19,20,25 Thus, the ZFS parameters of [MnIII(O2)(TpPh2)(THF)] are not reflective of the unique τ parameter of this complex.
Figure 7.
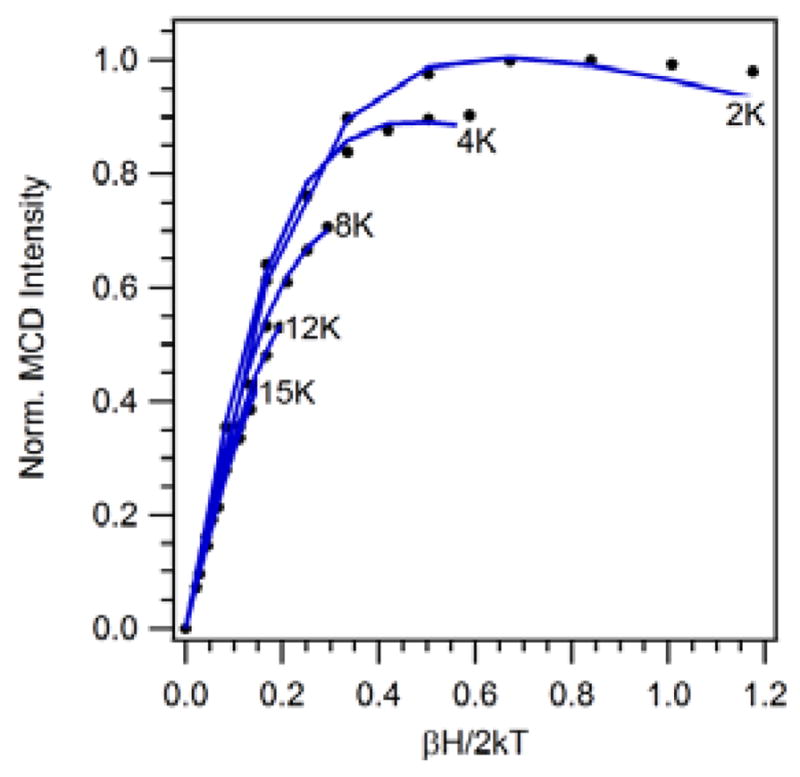
Experimental VTVH MCD data collected at 26 180 cm−1 for [MnIII(O2)(TpPh2)(THF)] (···) and theoretical fit (––) using the following parameters: D = −2.00, E/D = 0.05, giso = 2.00, and 0.8% x, 0.8% y, and 98.4% z polarization.
X-ray Absorption Spectroscopy of [MnII(TpPh2)(DMF)3](OTf) and [MnIII(O2)(TpPh2)(THF)]
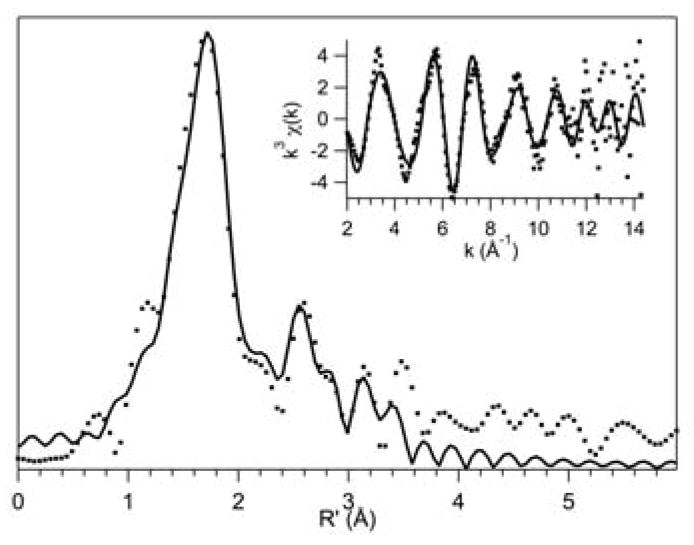
The Mn K-edge X-ray absorption data of [MnII(TpPh2)(DMF)3](OTf) shows a rising edge at 6547.5 eV, characteristic of a MnII species,62,63 as well as a pre-edge feature at 6540.6 eV (ESI, Figure S6). The Fourier transform of the extended X-ray absorption fine structure (EXAFS) data of [MnII(TpPh2)(DMF)3](OTf) exhibits a primary peak at R′ = 1.7 Å which was best fit with a shell of 3 O atoms at 2.16 Å and a shell of 3 N atoms at 2.28 Å (Figure 8, Table 6). Two smaller peaks are present in the Fourier transform at R′ = 2.5 and 3.1 which were fit with a shell of 4 N atoms at 3.09 Å, a shell of 1 B atom at 3.33 Å, and a shell of 6 C atoms at 3.49 Å. The fits of the EXAFS data show excellent agreement with the bond lengths determined through XRD, particularly with the EXAFS fits of the average Mn-N and Mn-O distances of 2.28 and 2.16 Å, respectively (ESI, Table S10).
Figure 8.
Fourier transform of Mn K-edge EXAFS data [k3χ(k)] and raw EXAFS spectra (insets), experimental data (···) and fits (–) for [MnII(TpPh2)(DMF)3](OTf).
Table 6.
EXAFS Fitting Results for [MnII(TpPh2)(DMF)3](OTf).a
| Fitb | Mn-O
|
Mn-N
|
Mn-N
|
Mn-B
|
Mn-C
|
F-factor | ||||||||||
|---|---|---|---|---|---|---|---|---|---|---|---|---|---|---|---|---|
| n | r(Å) | σ2 (Å2)c | n | r(Å) | σ2 (Å2)c | n | r(Å) | σ2 (Å2)c | n | r(Å) | σ2 (Å2)c | n | r(Å) | σ2 (Å2)c | ||
| 1 | 6 | 2.18 | 7.41 | 0.612 | ||||||||||||
| 2 | 3 | 2.14 | 3.29 | 3 | 2.26 | 2.58 | 0.598 | |||||||||
| 3 | 3 | 2.14 | 3.53 | 3 | 2.26 | 2.84 | 5 | 3.10 | 3.14 | 0.552 | ||||||
| 10 | 3 | 2.16 | 3.88 | 3 | 2.27 | 3.53 | 3 | 3.08 | 0.60 | 1 | 3.30 | 6.05 | 0.535 | |||
| 15 | 3 | 2.16 | 3.42 | 3 | 2.28 | 3.17 | 4 | 3.09 | 2.09 | 1 | 3.33 | 2.40 | 6 | 3.49 | 5.51 | 0.534 |
Fourier transform range is 2 – 14.5 Å (resolution 0.126 Å).
The fit number refers to all fits considered; see ESI Table S11.
Debye-waller factors are scaled × 103.
We also attempted to collect Mn K-edge X-ray absorption data for [MnIII(O2)(TpPh2)(THF)]; however, all datasets showed signs of photoreduction or sample degradation which was evident by a shift in the edge energy and disappearance of the pre-edge feature (ESI, Figure S7). Several attempts were made to circumvent the sample instability, such as preparation with different solvents (50:50 mixture of 2-Me-tetrahydrofuran:THF, THF, and toluene) and by several methods of preparation, but sample degradation was observed in all cases when the sample was subjected to the X-ray beam.
Ligand Exchange Reactions of [MnIII(O2)(TpPh2)(THF)]
The observation of the solvent (THF) ligand in the X-ray structure of [MnIII(O2)(TpPh2)(THF)] appeared to present an opportunity to perform ligand substitution reactions cis to the MnIII-O2 unit, under the assumption that the THF ligand might be labile. In a peroxomanganese(III) complex supported by the 13-TMC ligand (Scheme 1), substitution trans to the MnIII-O2 unit has been successful with anionic ligands.14 Ligand substitution with a series of tetraalkylammonium salts (NR4X; where X = N3 and F) as well as pyridine-N-oxide was attempted by treating [MnIII(O2)(TpPh2)(THF)] with an excess (100 equivalents) of NR4X or pyridine-N-oxide at 25 °C. In all cases, no change in the optical signatures of [MnIII(O2)(TpPh2)(THF)] were observed, and ESI-MS experiments on aliquots of a solution of [MnIII(O2)(TpPh2)(THF)] after addition of NR4X provided no evidence for the formation of [MnIII(O2)(TpPh2)(X)]− complexes.
DFT Computations and Electronic Structure of [MnIII(O2)(TpPh2)(THF)]
DFT computations were performed to provide a detailed comparison of the electronic structure of [MnIII(O2)(TpPh2)(THF)]with that of other peroxomanganese(III) adducts. The DFT-geometry-optimized model of [MnIII(O2)(TpPh2)(THF)] has metal-ligand bond lengths very similar to those observed crystallographically (Figure 9, top left panel). In particular, the Mn–Operoxo distances are within 0.03 Å of their crystallographic values (calculated: 1.881 and 1.894 Å; XRD: 1.859(2) and 1.865(2) Å). The calculated Mn–N distances are all predicted to be slightly larger than their crystallographic counterparts but all are within 0.07 Å of the experimental values. The Mn–O(THF) bond length shows a difference of in 0.04 Å between experimental and computed values. Overall, all calculated metric parameters are in quite acceptable agreement with the XRD structure of [MnIII(O2)(TpPh2)(THF)].
Figure 9.
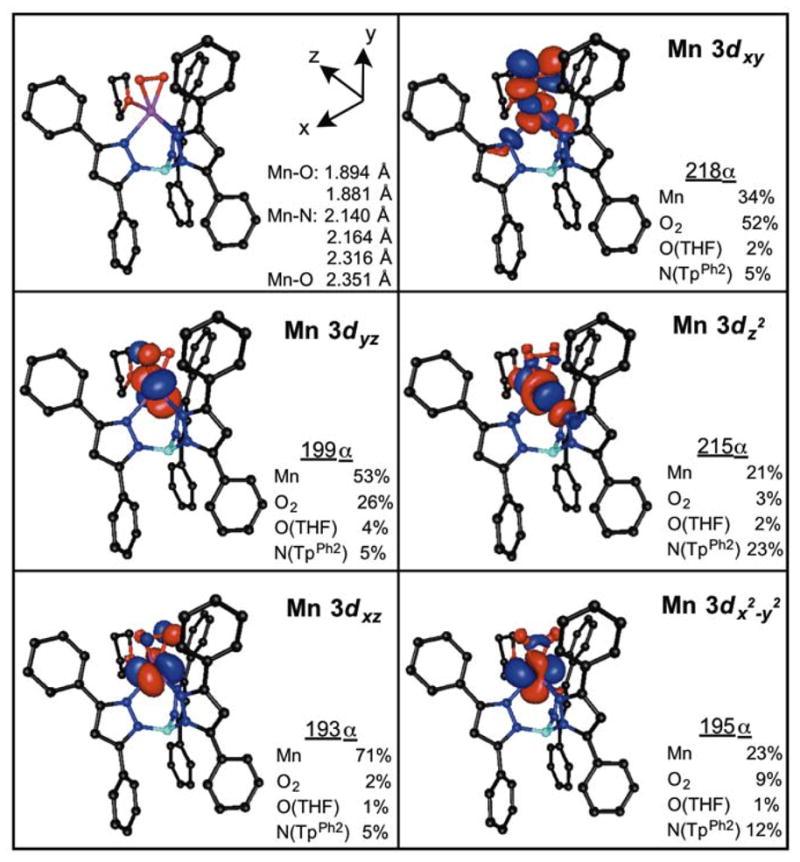
DFT-optimized structure of [MnIII(O2)(TpPh2)(THF)], with metal-ligand bond lengths and the D-tensor coordinate system from CP-DFT computations (top left panel), and surface contour plots of quasi-restricted Mn 3d-based orbitals (QROs). The sums of Mn 3d and ligand 2p contributions to the spin-up Kohn-Sham orbitals are listed next to the plots of the corresponding QROs.
Coupled-perturbed (CP) DFT calculations afforded the D-tensor orientation for [MnIII(O2)(TpPh2)(THF)], (Figure 9, top left panel). The elongated N(1)–Mn–O(3) axis (see Figure 3 for atom numbering scheme) defines the z-axis of the D-tensor, and the y-axis bisects the O–O bond vector. The CP-DFT calculated ZFS parameters were D = −1.37 cm−1 and E/D = 0.06. Although the CP-DFT method slightly underestimates the magnitude of D relative to the experimental value of −2.0 cm−1, the relative magnitude agrees well with experimental value of D observed for other MnIII-O2 adducts23 and is smaller than D values of other non-peroxo MnIII species (−4 to −5 cm−1).64,65 E/D is in excellent agreement with experiment (0.05 – 0.08). The CP-DFT computations also reveal that the dominant contribution to D is through spin-orbit coupling (DSOC), although the spin-spin coupling contribution is certainly non-negligible (DSS = −0.32 cm−1). Additionally, DSOC was also calculated using the state-averaged CASSCF/NEVPT2 method. In this case D is overestimated (DSOC = −2.91 cm−1) and the system is predicted to be too rhombic (E/D = 0.28). The CASSCF/NEVPT2 method calculated a 29% contribution to DSOC in the same sign (−) from components of the lowest-lying 3T1 state (from parent Oh symmetry) at 18 400, 19 200, and 20 400 cm−1. Similarly, 30% total contribution to DSOC comes from the lowest-lying quintet states at 25 700 and 29 500 cm−1. Additionally, a 3A state at 30 500 cm−1 contributed 27% to D as well as 99% to E. Contributions from individual excited states are listed in ESI, Table S15.
Before discussing spectral assignments for [MnIII(O2)(TpPh2)(THF)], we describe the bonding in this complex, focusing on the frontier MOs. In the D-tensor orientation, both the spin-up and spin-down MnIII 3dxy-based MOs (218α and 230β) are unoccupied and involved in MnIII-O2 σ-antibonding interactions (Figure 9, top right panel). The MnIII-O2 π-antibonding interaction is distributed over the MnIII 3dx2−y2- (195α, 197α, 200α, 201α, and 219β) and 3dyz- (199α, and 225β) based MOs. For the 3dx2−y2- and 3dyz-based MOs, only the α-spin MOs are occupied. The strong σ-covalency of the MnIII-O2 unit is exemplified by the 34% Mn 3d and 52% O2 p character in the α-spin Mn 3dxy MO (218α), which is essentially identical to that calculated for other six-coordinate MnIII-O2 complexes using the same level of theory.16 The Mn 3dz2-based MO of [MnIII(O2)(TpPh2)(THF)] largely reflects σ-interactions between the Mn–N(Tp) and Mn–O(THF) groups. The α-spin Mn 3dz2 MO carries 21% Mn 3d, 23% N(TpPh2) 2p, 2% O(THF) 2p, and 3% Operoxo 2p character.
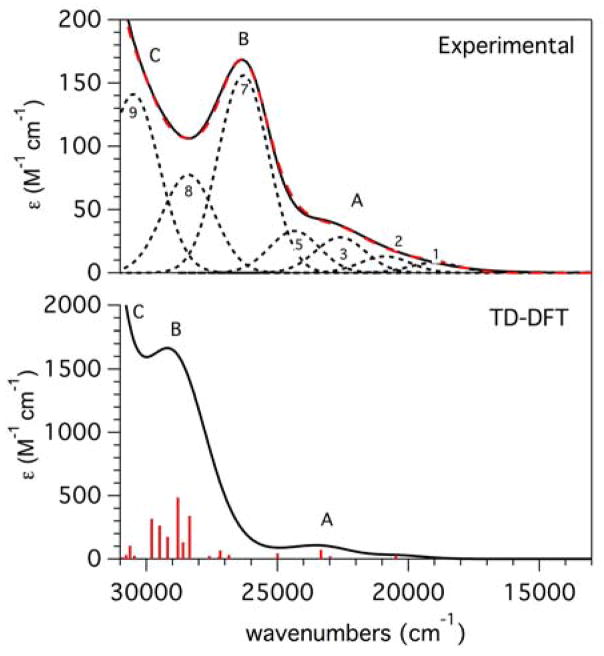
To develop detailed band assignments of the electronic transitions observed in the experimental absorption and MCD spectra (Figure 5, Table 5), electronic transition energies and intensities of [MnIII(O2)(TpPh2)(THF)] were calculated with the TD-DFT method. Overall, the TD-DFT calculated absorption spectrum for [MnIII(O2)(TpPh2)(THF)] shows good, qualitative agreement with the experimental absorption spectrum albeit with a consistent overestimation of transition energies. In the experimental absorption spectrum of [MnIII(O2)(TpPh2)(THF)], three absorption envelopes are observed (regions A, B, and C; see Figure 10). Region A, which extends from 18 000 to 25 000 cm−1 in the experimental absorption spectrum contains contributions from bands 1 – 5. In the TD-DFT-calculated spectrum, region A contains contributions from the lowest-energy spin-allowed MnIII d-d transition (state 2: dz2 ⇁ dxy; see Tables 5 and S12) at 20 500 cm−1 as well as a set of three peroxo-to-manganese(III) CT transitions from 23 000 to 25 500 cm−1 (states 3, 4, and 5). The calculated energy for the dz2 ⇁ dxy transition is in excellent agreement with the experimental energy of band 1 (Table 5). Compared to other previously characterized peroxomanganese(III) species, the energy of the dz2 ⇁ dxy transition is significantly shifted to higher energy. The peroxo-to-manganese(III) CT transitions in region A originate in the peroxo π* orbitals that are perpendicular, or out-of-plane, with respect to the MnIII-O2 unit (πop*) and terminate in the spin-down MnIII 3d-based MOs. However, these transitions are highly mixed, and this could account for the erroneously high TD-DFT-computed absorption intensity in this region. Nonetheless, these computations lend credence to the assignment of band 2 as a peroxo-to-manganese(III) CT transition.
Figure 10.
Experimental (top) and TD-DFT-calculated (bottom) absorption spectra of [MnIII(O2)(TpPh2)(THF)].
Region B of the TD-DFT- computed absorption spectrum extends from 25 000 to 31 000 cm−1. This region contains contributions from the three remaining spin-allowed MnIII d-d transitions (dyz ⇁ dxy, state 8; dx2−y2 ⇁ dxy, state 12; and dxz ⇁ dxy, state 17), as well as additional peroxo-to-manganese(III) charge transfer transitions (Tables 5 and S12).66 Compared to experiment, transitions in region B are calculated at too high an energy by ~5 000 cm−1. Nonetheless, these calculations are generally supportive of the spectral assignments discussed previously. Additionally, state 17 is composed of the dxz ⇁ dxy transition, which corresponds to a z-polarized 4B1 → 4A2 transition using the D-tensor coordinate system (Figure 6) and assuming idealized C2v symmetry, with the y-axis as the pseudo-C2 axis. This corroborates the assignment of band 7 as a dxz ⇁ dxy transition, as band 7 was characterized by VTVH MCD to be 98% z-polarized.
Region C of the TD-DFT absorption spectrum is composed of peroxo-to-manganese(III) CT transitions with contributions from states 14 (29 500 cm−1) and 15 (29 800 cm−1). TD-DFT calculations incorrectly predict the ordering of these CT states with respect to the highest-energy d-d transition (state 17, 30 600 cm−1), however, this is not unusual for TD-DFT calculations.
Additionally, the excited state energies of [MnIII(O2)(TpPh2)(THF)] were calculated by the CASSCF/NEVPT2 method to exclude the possibility of TD-DFT-calculated charge-transfer states with erroneously high intensity and low energy (so-called “intruder states”), that can occur as artifacts. The CASSCF/NEVPT2 method also has the advantage that spin-forbidden excited states can be treated. The d-d excited states from the CASSCF/NEVPT2 calculations agree well with the TD-DFT energies, confirming the presence of few intruder states in the latter spectrum. Importantly, two triplet excited states are predicted with energies (26 800 and 30 500 cm−1) that interleave the quartet excited state energies (Table 5), supporting our assignment of bands 4 and 6 as spin-forbidden transitions. It should be noted that the TD-DFT method predicts a significant contribution to region B from state 10 in the TD-DFT calculations (Table S13); however, state 10 is predicted as a Ph(Tp2Ph) ⇁ Mn intruder state. This transition is an anticipated artifact of the TD-DFT calculation and is not expected to contribute to the experimental absorption spectrum.
DFT Computations and Electronic Structure of the Blue and Brown Isomers of [MnIII(O2)(TpiPr2)(pziPr2H)]
Due to the reasonable success in reproducing the spectroscopic properties of [MnIII(O2)(TpPh2)(THF)] with these computational methods, a similar approach was utilized for the isomers of [MnIII(O2)(TpiPr2)(pziPr2H)] in an attempt to explain the thermochromic shift in the electronic absorption spectrum. The 22 nm (670 cm−1) red shift in the electronic absorption spectrum upon cooling from 253 to 193 K was associated with the formation of a hydrogen bond between the pyrazole ligand and one O atom of the peroxo unit in the low-temperature isomer. TD-DFT calculations were performed on models of [MnIII(O2)(TpiPr2)(pziPr2H)] built using the XRD coordinates of the isomers at 253 and 193 K (brown and blue isomers, respectively) in order to elucidate the nature of the changes in the absorption spectrum by determining the electronic structure. TD-DFT calculations were performed with both the unmodified XRD coordinates, as well as structures where the positions of the hydrogen atoms were optimized. Primarily, the optimization of the hydrogen atoms resulted in a shorter hydrogen bond, with a 0.139 Å decrease between the H-donor atom and the O(peroxo) acceptor in the blue isomer and a corresponding decrease of 0.049 Å in the brown isomer (Table 7).
Table 7.
Selected Bond Lengths (Å) for [MnIII(O2)(TpiPr2)(pziPr2H)] for fully-optimized coordinates, unmodified XRD coordinates, and hydrogen-optimized coordinates.
| Full Optimization | H-Oa | N-H | O-O | Mn-O | Mn-O |
| blue | 1.891 | 1.039 | 1.450 | 1.910 | 1.858 |
| brown | 1.890 | 1.039 | 1.450 | 1.858 | 1.910 |
|
| |||||
| XRD Coordinates22 | H-O | N-H | O-O | Mn-O | Mn-O |
|
| |||||
| blue | 2.156 | 0.975 | 1.434 | 1.880 | 1.844 |
| brown | 2.464 | 0.977 | 1.429 | 1.850 | 1.851 |
|
| |||||
| Hydrogen Optimized | H-O | N-H | O-O | Mn-O | Mn-O |
|
| |||||
| blue | 2.017 | 1.033 | 1.434 | 1.880 | 1.844 |
| brown | 2.414 | 1.026 | 1.429 | 1.850 | 1.851 |
H-O bond length listed is the shortest of the H-O bond lengths calculated.
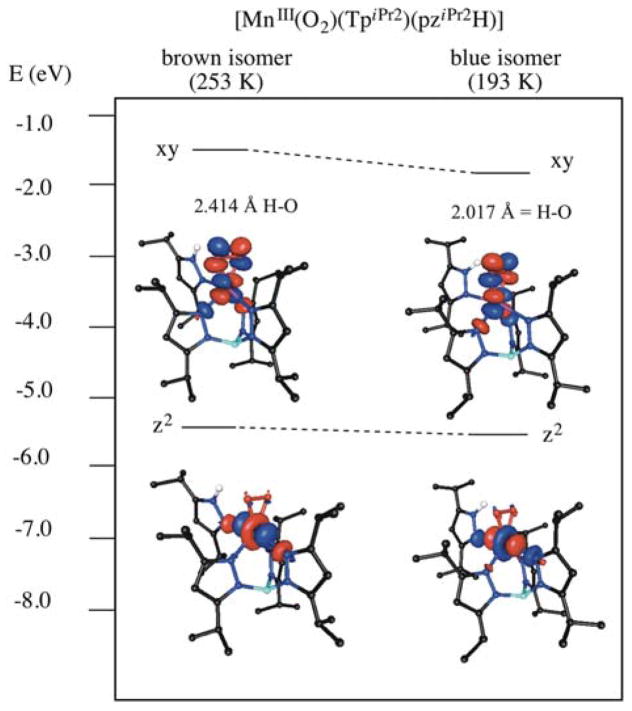
TD-DFT calculations with both the hydrogen-optimized and XRD structures reproduce the experimental absorption spectra well. TD-DFT calculations performed with the XRD coordinates predict a transition at 18 500 cm−1 for the brown isomer and a transition at 17 300 cm−1 for the blue isomer, in good agreement with the experimental values (17 820 and 17 150 cm−1). The transition energies obtained through TD-DFT calculations with the hydrogen-optimized structures were at slightly higher energies of 18 900 and 17 500 cm−1 for the blue and brown isomers, respectively. Importantly, both the XRD and the hydrogen-optimized structures reproduce the red-shift that occurs as the complex is cooled from 253 to 193 K. With all TD-DFT calculations, this red-shifted transition involves a one- electron excitation between the α-spin Mn 3dz2 MO (190α), which is highly mixed, and the unoccupied α-spin Mn 3dxy MO 192α). The acceptor orbital exhibits strong σ-covalency of the MnIII-O2 unit, with 42 – 45% Mn 3d and 44 – 47% O2 2p character (ESI, Tables S16 – S19), which is similar to other previously characterized MnIII-O2 complexes. The band shift in the experimental absorption spectrum of the blue isomer of [MnIII(O2)(TpiPr2)(pziPr2H)] is due to the stabilization of the Mn 3dxy acceptor MO, which carries significant peroxo ligand character, with the formation of the hydrogen bond (Figure 11). The hydrogen-optimized structure of the blue isomer exhibits the shortest hydrogen bond at 2.017 Å which is accompanied by the greatest stabilization of 0.2294 eV of the Mn 3dxy acceptor MO (192 α) relative to the corresponding orbital of the brown isomer (Table 7, Figure 11). TD-DFT calculations with the unmodified XRD structures display a similar trend with the blue isomer showing a hydrogen bond of 2.156 Å and a stabilization of the acceptor MO in the blue isomer of 0.1679 eV relative to the brown isomer. Notably, when both the brown and blue isomers were fully optimized (i.e. the positions of all atoms were energy-minimized), the computations yielded isomeric structures with a hydrogen bond distances of 1.891 and 1.890 Å and equivalent Mn—O distances of 1.858 and 1.910 Å (Table 7).
Figure 11.
TD-DFT-calculated donor and acceptor orbitals for the lowest energy d-d transition in the brown and blue isomers of [MnIII(O2)(TpiPr2)(pziPr2H)]. For clarity, all hydrogens except the hydrogen-bonding Hpyrazole have been omitted.
Discussion
Although there have been a variety of synthetic peroxomanganese(III) species supported by anionic ligands,14,22,25 there is still a lack of detailed bonding descriptions of such complexes. In particular, peroxomanganese(III) species supported by monoanionic and facially coordinating Tp ligands exhibit unusual electronic absorption spectra that have been unexplained by studies to date. In order to investigate the electronic structure of one of these species, a monomeric MnIII-O2 adduct supported by the TpPh2 ligand was synthesized and characterized by XRD, EPR, and MCD spectroscopies as well as TD-DFT and CASSCF/NEVPT2 computations. The high thermal stability of [MnIII(O2)(TpPh2)(THF)], presumably due in part to the steric bulk of the phenyl groups of the TpPh2 ligand shielding the peroxo moiety, facilitated the determination of the crystal structure.
The XRD structure of [MnIII(O2)(TpPh2)(THF)] shows metric parameters in line with those collected for other peroxomanganese(III) species.23 The MnIII oxidation state was confirmed by EPR spectroscopy. Previously characterized peroxomanganese(III) species exhibit 6-line signals at ~80 mT with hyperfine splitting of 6–7 mT.23 As [MnIII(O2)(TpPh2)(THF)] displays a feature position of 84.6 mT and a hyperfine splitting of 5.1 mT. This hyperfine splitting is somewhat smaller than those of other non-peroxo manganese(III) species67,68 and previously studied peroxomanganese(III) adducts23, possibly suggesting a higher degree of covalency in the [MnIII(O2)(TpPh2)(THF)] complex. Temperature dependence studies and simulation of the parallel-mode EPR feature yielded D = −2.0(5) cm−1 and E/D = 0.07(1), which are very similar to the ZFS parameters for other MnIII-O2 species which lie between −1.5 and −3.0 cm−1 for D and 0.05 to 0.30 for E/D.23 In addition to supporting the assignment of this intermediate as a MnIII species, the determination of these zero field splitting parameters for [MnIII(O2)(TpPh2)(THF)] supply insight into the ground state properties of MnIII-O2 species.
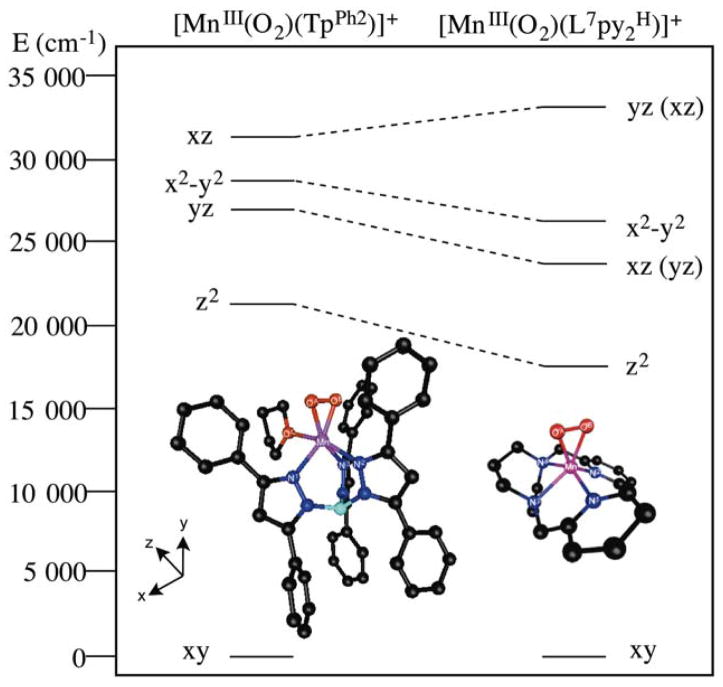
To elucidate the origin of the blue-shift observed in the absorption spectrum of [MnIII(O2)(TpPh2)(THF)] compared to other members of the MnIII-O2 class of intermediates, we turned to MCD spectroscopy and TD-DFT calculations. Although we have previously attributed slight variations in the lowest-energy ligand-field transitions of MnIII-O2 adducts to differences in the the Mn—Operoxo bond length,16,18,32 this correlation fails here, as the Mn—Operoxo distances of [MnIII(O2)(TpPh2)(THF)] are within the range of Mn—Operoxo bond lengths observed in the prior series. Instead, the high energy of band 1 in the MCD and electronic absorption spectra of [MnIII(O2)(TpPh2)(THF)] (Figure 5) results from perturbations perpendicular to the MnIII-O2 unit. Specifically, elongation in the N(1)—Mn—O(3) bonding axis (Figure 9, top left panel), which is a result of weak σ-donation from the THF ligand, stabilizes the 3dz2 MO and blue-shifts the 3dxy → 3dz2 transition. This is reflected in the experimentally determined ligand-field excited state energies of [MnIII(O2)(TpPh2)(THF)] compared to other MnIII-O2 species (Figure 12). The 3dxy - 3dz2 energy gap, Δ(3dxy − 3dz2), in [MnIII(O2)(TpPh2)(THF)] is 4.5 eV, whereas Δ(3dxy − 3dz2) is 4.1 and 3.8 eV for the MnIII-O2 complexes [MnIII(O2)(L7py2H)]+ and [MnIII(O2)(L7py26-Me)]+, respectively (L7py2H and L7py2Me are neutral N4 ligands).
Figure 12.
TD-DFT calculated d-d transitions in [MnIII(O2)(TpPh2)(THF)] and [MnIII(O2)(L7py2H)]+. Following the hole formalism for these d4 systems, the excited state is designated according to the d orbital hole. In D-tensor orientation of the [MnIII(O2)(L7py2H)]+ model, the x and y axes are swapped relative to [MnIII(O2)(TpPh2)(THF)]; the orbital labels corresponding to the coordinate system of [MnIII(O2)(TpPh2)(THF)] are shown in parentheses.
In our computational investigations of [MnIII(O2)(TpPh2)(THF)], two methods, TD-DFT and CASSCF/NEVPT2, were used to calculate electronic transitions energies. The more commonly used TD-DFT method is known to potentially introduce intruder states that do not contribute to the experimental spectrum. In general, the CASSCF/NEVPT2 method is accepted as a more reliable method for treating the excited states of transition metal complexes. In this present case, both methods overestimated the electronic transition energies compared to the experimentally observed bands, with the TD-DFT-calculated energies being closer to the experimental values. However, below 32 000 cm−1, the absorption spectra of [MnIII(O2)(TpPh2)(THF)] calculated by both methods are comparable in their replication of the experimental spectrum with the exception of one intruder state in the TD-DFT calculation, which had a negligible effect on the primary features of the computed absorption spectrum. Here, TD-DFT calculations were sufficient to predict the electronic absorption spectrum, particularly the d-d transitions, and the use of the more input-rigorous CASSCF/NEVPT2 method may not be necessary in other similar cases.
TD-DFT calculations were extended to investigate the brown and blue isomers of [MnIII(O2)(TpiPr2)(pziPr2H)]. As previously reported, when the [MnIII(O2)(TpiPr2)(pziPr2H)] species is cooled from 253 to 193 K, a hydrogen bond between the pyrazole ligand and one O atom of the peroxo unit is formed, and the absorption spectrum exhibits a 670 cm−1 red-shift. TD-DFT calculations permit the assignment of the red-shifted electronic transition to a Mn dz2 ⇁ dxy one-electron excitation. The Mn 3dxy acceptor MO of both isomers contains a significant amount of peroxo ligand character. The hydrogen bonding interaction with the peroxo moiety, and the concomitant Mn-O bond elongation, stabilizes this MO in the blue isomer by 0.2294 eV relative to the brown isomer (Figure 11).
The stabilization of the Mn-O2 σ-antibonding 3dxy MO through a hydrogen-bonding interaction is of potential relevance to two recent reports describing activation of MnIII-O2 adducts through chemical and electrochemical reduction. Using a MnIII-O2 adduct supported by a trianionic tripodal ligand with a hydrogen-bonding cavity around the peroxo, Borovik and co-workers showed that the two-electron reduction of a MnIII-O2 adduct using diphenylhydrazine led to O-O bond cleavage and the eventual formation of a hybrid oxo-/hydroxo-manganese(III) adduct.69,26 A dihydroxomanganese(III) species was postulated as an intermediate in this process. These elementary steps feature in the catalytic reduction of O2 to H2O by the corresponding MnII complex. In a separate study, Anxolabéhère-Mallart, Policar, and Robert reported that the two-electron electrochemical reduction of a MnIII-O2 adduct supported by a phenolate-containing N4O− ligand (the protonated, phenol form of the ligand is N-)2-hydroxybenzyl)-N,N′-bis[2-(N-methylimidazolyl)methyl]ethane-1,2-diamine) causes O-O bond cleavage when the reduction is carried out in the presence of water.70 Detailed electrochemical studies revealed that this process is kinetically controlled by the initial electron transfer that is also associated with a large reorganization energy. In both systems, hydrogen bonding to the peroxo ligand, either intramolecular with the supporting ligand or intermolecular with added water, is possible. On the basis of our computational work described here, hydrogen-bonding to the peroxo of a MnIII-O2 unit stabilizes the Mn 3dxy orbital (Figure 11), which is the spin-α LUMO, potentially facilitating reduction of the MnIII-O2 unit. Because this MO contains a significant percentage of peroxo π* character, the addition of an electron to this MO would weaken the O-O bond, priming it for cleavage.
Conclusions
The conversion of [MnII(TpPh2)(DMF)3](OTf) to [MnIII(O2)(TpPh2)(THF)] by KO2 yielded a peroxomanganese(III) species exhibiting high thermal stability with unique spectral features in both the electronic absorption and MCD spectra. The nature of these spectral deviations from previously characterized peroxomanganese(III) species arises from an axial elongation along the molecular z-axis, reducing the metal-ligand covalency, stabilizing the σ-antibonding Mn dz2 MO, and affording higher energy d-d transitions. Comparably, in the peroxomanganese(III) species supported by the TpiPr2 ligand, a hydrogen bonding interaction stabilizes the acceptor MO, causing the thermochromic shift observed as the complex is cooled from 293 to 193 K. These perturbations in the electronic transitions of these peroxomanganese(III) species represent an example of a deviation in symmetry and metal-ligand bonding in MnIII-(O2) intermediates and could be applied in the identification of similar changes in the first coordination sphere of short-lived intermediates in enzymatic and model systems.
Supplementary Material
Acknowledgments
This work was supported by the US NSF (CHE-1056470 to T.A.J.). XAS experiments were supported by the Center for Synchrotron Biosciences grant, P30-EB-009998, from the National Institute of Biomedical Imaging and Bioengineering (NIBIB). The US NSF is also acknowledged for funds used for the purchase of X-ray instruments (CHE-0079282) and the EPR spectrometer (CHE-0946883). H.E.C. was supported by NIH-GMS T32 GM08545. We thank Dr. Erik Farquhar at NSLS for outstanding support of our XAS experiments.
Footnotes
Electronic Supplementary Information (ESI) available: Crystal data and structure refinement information, variable-temperature electronic absorption spectra of [MnIII(O2)(TpPh2)(THF)], temperature dependent EPR data for [MnIII(O2)(TpPh2)(THF)], IR spectra of [MnII(TpPh2)(DMF)3](OTf) and [MnIII(O2)(TpPh2)(THF)], variable- temperature 7T MCD spectra, deconvoluted MCD data, XAS spectra of [MnII(TpPh2)(DMF)3](OTf) and [MnIII(O2)(TpPh2)(THF)], EXAFS fitting results for [MnII(TpPh2)(DMF)3](OTf), DFT-optimized cartesian coordinates, TD-DFT-calculated parameters, and CASSCF-NEVPT2-calculated parameters. CCDC reference numbers 1018686 and 1018687. See DOI: 10.1039/b000000x/.
Notes and references
- 1.Grove LE, Brunold TC. Comments on Inorganic Chemistry. 2008;29:134. [Google Scholar]
- 2.Miller AF. Curr Opin Chem Biol. 2004;8:162. doi: 10.1016/j.cbpa.2004.02.011. [DOI] [PubMed] [Google Scholar]
- 3.Jackson TA, Karapetian A, Miller AF, Brunold TC. Biochemistry. 2005;44:1504. doi: 10.1021/bi048639t. [DOI] [PubMed] [Google Scholar]
- 4.Bull C, Niederhoffer EC, Yoshida T, Fee JA. Journal of the American Chemical Society. 1991;113:4069. [Google Scholar]
- 5.Hearn AS, Stroupe ME, Cabelli DE, Lepock JR, Tainer JA, Nick HS, Silverman DN. Biochemistry. 2001;40:12051. doi: 10.1021/bi011047f. [DOI] [PubMed] [Google Scholar]
- 6.Hearn AS, Tu CK, Nick HS, Silverman DN. Journal of Biological Chemistry. 1999;274:24457. doi: 10.1074/jbc.274.35.24457. [DOI] [PubMed] [Google Scholar]
- 7.Gunderson WA, Zatsman AI, Emerson JP, Farquhar ER, Que L, Lipscomb JD, Hendrich MP. J Am Chem Soc. 2008;130:14465. doi: 10.1021/ja8052255. [DOI] [PMC free article] [PubMed] [Google Scholar]
- 8.Vetting MW, Wackett LP, Que L, Jr, Lipscomb JD, Ohlendorf DH. Journal of Bacteriology. 2004;186:1945. doi: 10.1128/JB.186.7.1945-1958.2004. [DOI] [PMC free article] [PubMed] [Google Scholar]
- 9.Opaleye O, Rose RS, Whittaker MM, Woo EJ, Whittaker JW, Pickersgill RW. Journal of Biological Chemistry. 2006;281:6428. doi: 10.1074/jbc.M510256200. [DOI] [PubMed] [Google Scholar]
- 10.Borowski T, Bassan A, Richards NGJ, Siegbahn PEM. Journal of Chemical Theory and Computation. 2005;1:686. doi: 10.1021/ct050041r. [DOI] [PubMed] [Google Scholar]
- 11.Reinhardt LA, Svedruzic D, Chang CH, Cleland WW, Richards NGJ. Journal of the American Chemical Society. 2003;125:1244. doi: 10.1021/ja0286977. [DOI] [PubMed] [Google Scholar]
- 12.Svedružic D, Jónsoon S, Toyota CG, Reinhardt LA, Ricagno S, Lindqvist Y, Richards NGJ. Archives of Biochemistry and Biophysics. 2005;433:176. doi: 10.1016/j.abb.2004.08.032. [DOI] [PubMed] [Google Scholar]
- 13.Tanner A, Bowater L, Fairhurst SA, Bornemann S. Journal of Biological Chemistry. 2001;276:43627. doi: 10.1074/jbc.M107202200. [DOI] [PubMed] [Google Scholar]
- 14.Annaraj J, Cho J, Lee YM, Kim SY, Latifi R, de Visser SP, Nam W. Angew Chem Int Ed. 2009;48:4150. doi: 10.1002/anie.200900118. [DOI] [PubMed] [Google Scholar]
- 15.Cho J, Sarangi R, Nam W. Acc Chem Res. 2012;45:1321. doi: 10.1021/ar3000019. [DOI] [PMC free article] [PubMed] [Google Scholar]
- 16.Geiger RA, Chattopadhyay S, Day VW, Jackson TA. Journal of the American Chemical Society. 2010;132:2821. doi: 10.1021/ja910235g. [DOI] [PubMed] [Google Scholar]
- 17.Geiger RA, Chattopadhyay S, Day VW, Jackson TA. Dalton Trans. 2011;40 doi: 10.1039/c0dt01570a. [DOI] [PubMed] [Google Scholar]
- 18.Geiger RA, Leto DF, Chattopadhyay S, Dorlet P, Anxolabéhère-Mallart E, Jackson TA. Inorganic Chemistry. 2011;50:10190. doi: 10.1021/ic201168j. [DOI] [PubMed] [Google Scholar]
- 19.Groni S, Blain G, Guillot R, Policar C, Anxolabéhère-Mallart E. Inorganic Chemistry. 2007;46:1951. doi: 10.1021/ic062063+. [DOI] [PubMed] [Google Scholar]
- 20.Groni S, Dorlet P, Blain G, Bourcier S, Guillot R, Anxolabéhère-Mallart E. Inorganic Chemistry. 2008;47:3166. doi: 10.1021/ic702238z. [DOI] [PubMed] [Google Scholar]
- 21.Kang H, Cho J, Cho K-B, Nomura T, Ogura T, Nam W. Chem Eur. 2013;19 doi: 10.1002/chem.201301641. [DOI] [PubMed] [Google Scholar]
- 22.Kitajima N, Komatsuzaki H, Hikichi S, Osawa M, Moro-oka Y. J Am Chem Soc. 1994;116:11596. [Google Scholar]
- 23.Leto DF, Jackson TA. J Biol Inorg Chem. 2014;19:1. doi: 10.1007/s00775-013-1067-4. [DOI] [PubMed] [Google Scholar]
- 24.Seo MS, Kim JY, Annaraj J, Kim Y, Lee YM, Kim SJ, Kim J, Nam W. Angewandte Chemie International Edition. 2007;46:377. doi: 10.1002/anie.200603414. [DOI] [PubMed] [Google Scholar]
- 25.Shook RL, Gunderson WA, Greaves J, Ziller JW, Hendrich MP, Borovik AS. Journal of the American Chemical Society. 2008;130:8888. doi: 10.1021/ja802775e. [DOI] [PMC free article] [PubMed] [Google Scholar]
- 26.Shook RL, Peterson SM, Greaves J, Moore C, Rheingold AL, Borovik AS. J Am Chem Soc. 2011;133:5810. doi: 10.1021/ja106564a. [DOI] [PMC free article] [PubMed] [Google Scholar]
- 27.Singh UP, Sharma AK, Hikichi S, Komatsuzaki H, Moro-oka Y, Akita M. Inorganica Chimica Acta. 2006;359:4407. [Google Scholar]
- 28.MKC, Kovacs JA. J Am Chem Soc. 2011;133:12470. doi: 10.1021/ja205520u. [DOI] [PMC free article] [PubMed] [Google Scholar]
- 29.Coggins MKVM-DSDJAK. J Am Chem Soc. 2013;135 [Google Scholar]
- 30.VanAtta RB, Strouse CE, Hanson LK, Valentine JS. Journal of the American Chemical Society. 1987;109:1425. [Google Scholar]
- 31.For MnIII-O2 adducts, the τ parameter is used exclusively to compare angles between axial donors perpendicular to the MnIII-O2 unit with angles between equatorial donors parallel to the MnIII-O2 unit (Scheme 1). This differs somewhat from the conventional τ parameter used for authentic five-coordinate complexes. Most notably, τ values of greater than 1 are possible under the MnIII-O2 formalism.
- 32.Geiger RA, Wijeratne G, Day VW, Jackson TA. Eur J Inorg Chem. 2012:1598. [Google Scholar]
- 33.Pecoraro VL, Baldwin MJ, Gelasco A. Chem Rev. 1994;94:807. [Google Scholar]
- 34.Vaska L. Acc Chem Res. 1975;9:175. [Google Scholar]
- 35.Sheldrick GM. Bruker-AXS 5465 E. Cheryl Parkway, Madison, WI 53711–5373 USA: 2000. [Google Scholar]
- 36.Stoll S, Schweiger A. J Magn Reson. 2006;178:42. doi: 10.1016/j.jmr.2005.08.013. [DOI] [PubMed] [Google Scholar]
- 37.Neese F, Solomon EI. Inorganic Chemistry. 1999;38:1847. doi: 10.1021/ic981264d. [DOI] [PubMed] [Google Scholar]
- 38.George GN. EXAFSPAK. Stanford Synchrotron Radiation Laboratory; Stanford, CA: 1990. [Google Scholar]
- 39.Rehr JJ, Mustre de Leon J, Zabinsky SI, Albers RC. Journal of the American Chemical Society. 1991;113:5135. [Google Scholar]
- 40.Neese F. The ORCA program system. Wiley Interdiscip Rev: Comput Mol Sci. 2012:73. [Google Scholar]
- 41.Becke AD. J Chem Phys. 1986;84:4524. [Google Scholar]
- 42.Perdew JP. Phys Rev B. 1986;33:8822. doi: 10.1103/physrevb.33.8822. [DOI] [PubMed] [Google Scholar]
- 43.Schäfer A, Horn H, Ahlrichs R. J Chem Phys. 1992;97:2571. [Google Scholar]
- 44.Schäfer A, Huber C, Ahlrichs R. J Chem Phys. 1994;100:5829. [Google Scholar]
- 45.Neese F. Journal of Computational Chemistry. 2003;24:1740. doi: 10.1002/jcc.10318. [DOI] [PubMed] [Google Scholar]
- 46.Sinnecker S, Rajendran A, Klamt A, Diedenhofen M, Neese F. Journal of Physical Chemistry A. 2006;110:2235. doi: 10.1021/jp056016z. [DOI] [PubMed] [Google Scholar]
- 47.Bauernschmitt R, Ahlrichs R. Chem Phys Lett. 1996;256:454. [Google Scholar]
- 48.Casida EM, Jamorski C, Casida KC, Salahub DR. J Chem Phys. 1998;108:4439. [Google Scholar]
- 49.Stratman RE, Scuseria GE, Frisch MJ. J Chem Phys. 1998;109:8218. [Google Scholar]
- 50.Hirata S, Head-Gordon M. Chem Phys Lett. 1999;302:375. [Google Scholar]
- 51.Hirata S, Head-Gordon M. Chem Phys Lett. 1999;314:291. [Google Scholar]
- 52.Becke AD. J Chem Phys. 1993;98:1372. [Google Scholar]
- 53.Becke AD. J Chem Phys. 1993;98:5648. [Google Scholar]
- 54.Lee C, Yang W, Parr RG. Phys Rev B. 1988;37:785. doi: 10.1103/physrevb.37.785. [DOI] [PubMed] [Google Scholar]
- 55.Angeli C, Cimiraglia R, Evangelisti S, Leininger T, Malrieu JP. J Chem Phys. 2001;114:10252. doi: 10.1063/1.2911699. [DOI] [PubMed] [Google Scholar]
- 56.Hammes BS, Carrano MW, Carrano CJ. J Chem Soc, Dalton Trans. 2001:1448. [Google Scholar]
- 57.Singh UP, Sharma AK, Tyaji P, Upreti S, Singh RK. Polyhedron. 2006;25:3628. [Google Scholar]
- 58.Schultz DA, Vostrikova KE, Bodnar SH, Koo HJ, Whangbo MH, Kirk ML, Depperman EC, Kampf JW. J Am Chem Soc. 2003;125:1607. doi: 10.1021/ja020715x. [DOI] [PubMed] [Google Scholar]
- 59.Lever ABP. Inorganic Electronic Spectroscopy. 2. Elsevier; Amsterdam; New York: 1984. [Google Scholar]
- 60.Band 9 has exceptionally low MCD intensity and could also be assigned as a TpPh2 to manganese(III) CT transition.
- 61.Oganesyan VS, George SJ, Cheesman MR, Thomson AJ. J Chem Phys. 1999;110:762. [Google Scholar]
- 62.Leto DF, Chattopadhyay S, Day VW, Jackson TA. Dalton Trans. 2013;42:13014. doi: 10.1039/c3dt51277k. [DOI] [PMC free article] [PubMed] [Google Scholar]
- 63.Leto DF, Jackson TA. Inorg Chem. 2014;53:6179. doi: 10.1021/ic5006902. [DOI] [PMC free article] [PubMed] [Google Scholar]
- 64.Neese F. J Am Chem Soc. 2006;128:10213. doi: 10.1021/ja061798a. [DOI] [PubMed] [Google Scholar]
- 65.Krzystek J, Ozarowski A, Telser J. Coordination Chemistry Reviews. 2006;250:2308. [Google Scholar]
- 66.These transitions are all highly mixed, and the natures of the excited states were identified through visualization of electron density difference maps (EDDMs.
- 67.Krivokapic I, Noble C, Klitgaard S, Tregenna-Piggott P, Weihe H, Barra AL. Angew Chem Int Ed. 2005;44:3613. doi: 10.1002/anie.200463084. [DOI] [PubMed] [Google Scholar]
- 68.Krzystek J, Yeagle GJ, Park JH, Britt RD, Meisel MW, Brunel LC, Joshua T. Inorg Chem. 2003;42:4610. doi: 10.1021/ic020712l. [DOI] [PubMed] [Google Scholar]
- 69.The metric parameters in the crystal structure of this complex indicate that a proton is nearly equally shared between the supporting ligand and a coordinated oxygen atom.
- 70.Ching HYV, Anxolabéhère-Mallart E, Colmer HE, Costentin C, Dorlet P, Jackson TA, Policar C, Robert M. Chemical Science. 2014;5 [Google Scholar]
Associated Data
This section collects any data citations, data availability statements, or supplementary materials included in this article.


