Abstract
Purpose
To display drusen and GA in a single projection image from 3D SD-OCT images based on a novel false color fusion strategy.
Methods
We present a false color fusion strategy to combine drusen and GA projection images. The drusen projection image is generated with a restricted summed-voxel projection (RSVP, axial sum of the reflectivity values in a SD-OCT cube, limited to the region where drusen in present). The GA projection image is generated by incorporating two GA characteristics: bright choroid and thin retina pigment epithelium (RPE). The false color fusion method was evaluated in 82 3D OCT datasets obtained from 7 patients, for which two readers independently identified drusen and GA as the gold standard. The mean drusen and GA overlap ratio was used as the metric to determine accuracy of visualization of the proposed method when compared to the conventional summed-voxel projection (SVP, axial sum of the reflectivity values in the complete SD-OCT cube) technique and color fundus photographs (CFP).
Results
Comparative results demonstrate that the false color image is more effective in displaying drusen and GA than SVP and CFP. The mean drusen/GA overlap ratios based on the conventional SVP method, CFP and the false color fusion method were 6.4%/100%, 64.1%/66.7%, and 85.6%/100%, respectively.
Conclusions
The false color fusion method was more effective for simultaneous visualization of drusen and GA than the conventional SVP method and CFP, and it appears promising as an alternative method for visualizing drusen and GA in the retinal fundus, which commonly occur together and can be confusing to differentiate without methods such as our proposed method.
Keywords: Drusen, en face fundus image, geographic atrophy, image processing, optical coherence tomography, false color fusion, retinal pigment epithelium, visualization
INTRODUCTION
Age-related macular degeneration (AMD) affects an estimated 30 to 50 million individuals worldwide1 and is the most common cause of legal blindness among elderly individuals in developed countries.2,3 One of its clinical characteristics and, in most scans, the first clinical finding is the presence of drusen (“dry AMD”),4 which are focal deposits of extracellular material located between the basal lamina of the RPE and the inner collagenous layer of Bruch’s membrane.5 The advanced form of AMD associated with severe vision loss is characterized by the development of macular neovascularization (“wet AMD”) and geographic atrophy (GA).6–8
Evaluation of color fundus photographs (CFPs) is currently the gold standard for measuring drusen in non-neovascular AMD as well as for visualizing and assessing GA.9 Total drusen area and maximum drusen size are estimated by visual inspection of drusen in CFPs, with comparison to a set of standardized circles.10 However, it can be challenging to reliably localize drusen against the varying background of the pigments of the macula, retina pigment epithelium (RPE) and choroid.11 In addition, it is difficult to make reproducible quantitative measurements of drusen and GA in CFPs.
Optical coherence tomography (OCT) enables the differentiation of retinal structures such as drusen and GA in the depth axis. The latest spectral domain OCT (SD-OCT) systems are able to acquire high-speed, high-resolution, high-density 3-dimensinal (3D) images covering the central macula,12 with the advantage over other imaging modalities for dry AMD that the same scan pattern can be used to observe both drusen and GA while obtaining reproducible, quantitative data on both abnormalities.13 Khanifar et al. categorized drusen ultrastructure in AMD using SD-OCT and correlated the tomographic and photographic drusen appearance.14 A high-density scan pattern also allows the visualization of drusen and GA on an OCT fundus image, which represents an en face summed-voxel projection (SVP) of all the B-scans from the SD-OCT dataset.15–17 The OFIs can be used to register the SD-OCT datasets to fundus photos or other en face retinal imaging modalities. This facilitates calibration of the color fundus images so that exact correlations can be achieved between the retinal cross-sectional geometry seen on the OCT B-scans and the retinal landmark seen on en face imaging and the color images.
The SVP fundus image is not ideal for drusen visualization because most drusen are not visible with this technique;15 these small abnormalities are often obscured when the image volume is collapsed when making these projections. Stopa et al.18 overcame some of these limitations by locating pathologic retinal features with color marking in each OCT image before the image volume was collapsed along the depth axis to produce the SVP. This way, they preserved the delineation of pathological features in SVP visualizations. Another technique recently introduced into OCT imaging devices is the “slab SVP,” a semi-automated method to restrict the SVP to a sub-volume of the retina in vicinity of the RPE layer (Carl Zeiss Meditch, Inc., unpublished data); however, the user needs to annotate the image to localize the RPE. Manually annotating pathologic features in a stack of SD-OCT images in the time-pressured and high-volume setting of clinical care is time-consuming and costly. In addition, the SVP images produced by the methods by Stopa et al. only give information about drusen extent, but no information about drusen thickness, which could be useful for characterizing drusen. Georczynska et al.19 proposed a method of generating a series of projection OCT fundus images from each single OCT cube by selectively summing different retinal depth levels, which enhanced contrast and visualized outer retinal pathology not visible with standard fundus imaging or OCT fundus imaging techniques. With this method, however, drusen are separated into several projected fundus images summed at different retinal depth levels, and cannot be directly visualized in a single image.
Another form of drusen visualization in an en face image was originally proposed with the name of restricted summed-voxel projection (RSVP).20, 21 The RSVP includes the automatic segmentation and projection of the voxels around the RPE, together with image processing techniques such as “brightening” of voxels underneath drusen. This process greatly improve drusen visualization in an en face image and provides a rapid way of assessment of drusen in the whole macula volume other than inspecting B-scan by B-scan.
The primary retinal layer affected by the evolution of GA is still not very clear; either the RPE, choriocapillaris, or photoreceptors (PR) layers can present deformities in patients affected by GA.13,22 However, most histopathological studies suggest that the initial event in GA occurrence is RPE cell loss, followed with ensuing PR cell death and choriocapillaris atrophy.23–26 Bearelly et al.22 studied the PR-RPE interface in GA using SD-OCT in order to test in vivo whether SD-OCT provides adequate resolution for reproducible measurement of the PR layer at the margins of GA, and if the relationship between PR layer and RPE at those margins could be delineated successfully. This study emphasized the direct association between GA and cell loss or “thinning”of PR and RPE as observed in SD-OCT images. GA can also be visualized in en face SVP fundus images as a bright and more homogeneously delimited region, due to the mentioned cell loss and consequent increased penetration of light into the choroid coat, together with the constant high reflection of light from the choroid coat.27 However, some particular cases with highly reflective retinal layers above the RPE complex complicate and obscure GA visualization, making the use of SVP fundus imaging for GA inspection sub-optimal.
In this paper, we present a new combined drusen and GA visualization method that enhances the conspicuity of GA lesion by incorporating RPE loss and increase of reflections from the choroid coat. In addition, a false color fusion strategy by combining drusen and GA projection images is presented to effectively display drusen and GA in a single fundus image.
METHODS
The study protocol was approved by the Institutional Review Board of the Stanford University School of Medicine and the HIPAA compliant research adhered to the Declaration of Helsinki and all federal and state laws.
Drusen Visualization
The RSVP method was recently introduced in a publication by our group,21 and unlike previously described slab-based projection methods, it is fully automated and requires no user input such as indicating a seed point. The RSVP approach creates an en face voxel projection image from a 3D SD-OCT cube by restricting the projected volume to the sub-volume in the vicinity of the RPE layer. Fig. 1 shows an example of the vicinity region which is projected in the RSVP method.
Figure 1.
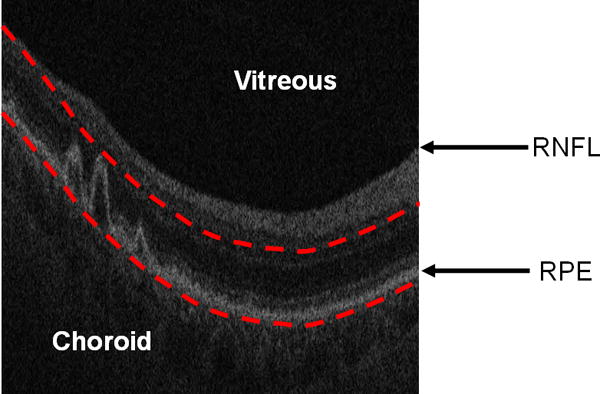
Restricting the OCT image data for generating a fundus projection (the RSVP) to the vicinity of the RPE layer. The bottom red curve is the baseline of the normal RPE layer. The top red curve is determined by the largest drusen height in all of B-scans. The RSVP thus excludes extraneous portions of the retina that may add noise to the projection, such as those caused by the vitreous, retinal nerve fiber layer (RNFL), and choroid.
The location of RPE layers were determined by taking the presence of drusen into account. The SD-OCT retinal images are first smoothed with bilateral filtering.28 Then, the location of the RNFL is estimated by detecting the margin of the vitreous with a threshold. The highly reflective and locally connected pixels that are spatially located below the RNFL are taken as the initial estimate of the RPE layer. The morphological opening and thickness constraint (RPE is approximately constant thickness) are adopted to smooth and refine the RPE estimation. Finally, the unhealthy (abnormal) and healthy (normal) RPE layers are obtained by interpolation and fitting, respectively. The fitted lower boundary of the normal RPE layer is taken as the baseline of the projection region used for the RSVP generation, while the top boundary of the projection region is determined by displacing the fitted normal RPE layer upwards the same distance as the largest drusen peak found in the cube (Fig. 1).
In addition, to improve drusen visualization, the RSVP method also includes the brightening of the drusen substance region. For each axial column of the SD-OCT scans, we find the maximum intensity pixel in the interpolated RPE layer and replace the values of the pixels underneath it with this maximum intensity value.
GA Visualization
Two main characteristics of GA can be observed in SD-OCT images: choroid brightening and RPE thinning, as shown in Fig. 2. The choroid in GA regions is always brighter than in healthy regions, due to RPE cell loss, increase of light penetration in the retina, and subsequent increased reflections from the choroid coat. The thickness of RPE in GA regions is also usually observed to be thinner than that in other regions. Our GA visualization algorithm is then mainly based on the detection regions with increased brightness in the choroid region, and the RPE thinning characteristics is also used to enhance the GA visualization.
Figure 2.
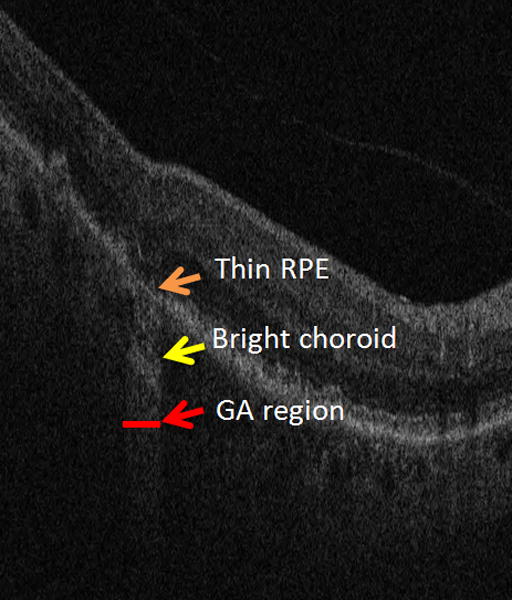
Two characteristics of GA in SD-OCT images: an attenuated RPE signal and a bright choroid.
Choroid Region Summing
To improve the traditional SVP image for GA visualization, we restrict the SVP projection to a sub-volume beneath the RPE layer where the choroid resides and where the high reflections (or bright choroid) indicate where GA is present. Fig. 3 shows a GA visualization example with the traditional SVP projection (Left) and the RSVP projection (Right). The contrast of GA in the RSVP image is higher than in the SVP image, which could potentially improve the performance of a computerized GA segmentation method. Due to smoothing with bilateral filtering for SD-OCT retinal images, the RSVP projection appears more blurred than the SVP projection.
Figure 3.
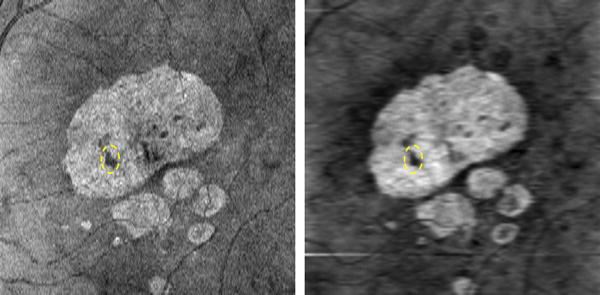
SVP (Left) and RSVP (Right) projection for visualizing GA lesions. The dashed yellow oval represents a drusen within the big GA region.
RPE Thickness
For normal retina without GA, the RPE thickness is approximately constant (20μm). We used the segmented RPE layer vicinity described above (drusen projection region delimited with the red lines in Fig. 1) to obtain an en-face mapping related to RPE thickness at each A-scan position. The values of this mapping were computed A-scan by A-scan by selecting the maximum of the values resulting from using a sliding window to average pixel intensity in the segmented RPE layer vicinity. The size of this sliding window was 20μm, corresponding to normal RPE thickness. The reasoning behind this mapping is that since the RPE is the brightest region within the selected vicinity and has approximately constant brightness within the cube, a larger number of bright pixels within the window indicates a thicker region of the RPE, and in the same way, a lower number of bright pixels indicates RPE thinning. This mapping does not produce actual RPE thickness values, but it produces a good representation of areas where there is RPE thinning.
Fig. 4 shows the estimated RPE thickness map computed from the same SD-OCT cube as shown in Fig. 3. It can be seen from Fig. 4 that the RPE thickness in the region presenting GA is thinner (darker pixels in the thickness map) than in the rest of the retina. There is also a druse within the most extensive GA region, which is marked with the dashed yellow ovals in Fig. 3 and Fig. 4, producing a bright area within this region. Compared with the RSVP projection image (Fig. 3 Right), the RPE thickness map (Fig. 4) is inferior for GA visualization, as blood vessels and other structure abnormalities may influence the RPE to appear thinner, but it can be used to enhance the RSVP projection image, as we described in the following subsection.
Figure 4.
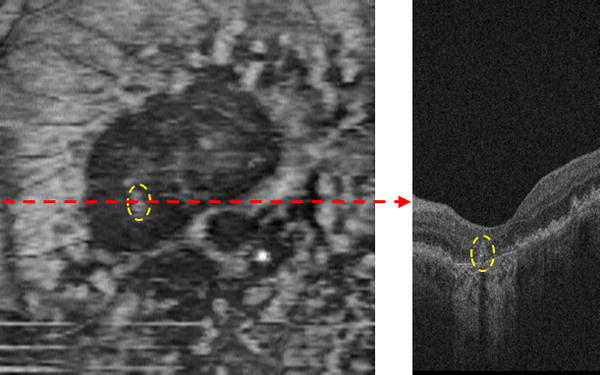
RPE thickness map. The B-scan (Right) corresponds to the dashed red line of the RPE thickness map (Left). The two dashed yellow ovals in the B-scan and RPE thickness map show a single druse.
Combination of Two Characteristics
Let P1 and P2 be matrices representing the normalized RSVP projection image and RPE thickness map, respectively. The final GA projection image can be obtained with the formula:
| (1) |
where the constant a belongs to [0, 1) and its purpose is to adjust the influence of the RPE thickness on the GA projection image. Here we considered a=0.5, which was determined by observation of the results produced in a number of different cases. The operator ‘∘’ represents the element-wise multiplication, namely the multiplications of the corresponding elements of P1 and (1 − P2)a.
Fig. 5 (Left) shows the final GA projection image obtained with the equation (1), which combines the two GA characteristics: bright choroid and thin RPE. Fig. 5 (Right) shows one line profile of the 170th rows of Fig. 3 (Right) and Fig. 5 (Left), marked with the dashed red line in Fig. 5 (Left). The RPE thickness map (Fig. 4) can enhance the GA display by suppressing the background, as marked with the dashed black circles in Fig. 5 (Right). The edge slope between the GA (marked with the dashed green circle) and background regions indicates that the final projection image (Fig. 5 (Left)) has a better contrast for the GA visualization than the RSVP projection image (Fig. 3 (Right)). Since the background intensity near the GA boundary is suppressed by the RPE thickness map (the red line is below the blue line as shown in the dashed black circles), the intensity gradient of the GA boundary is higher in the final GA projection image than that in the RSVP projection image. This is helpful for enabling automated GA segmentation. While within the GA region, the intensity values have some decrease in the final GA projection image.
Figure 5.
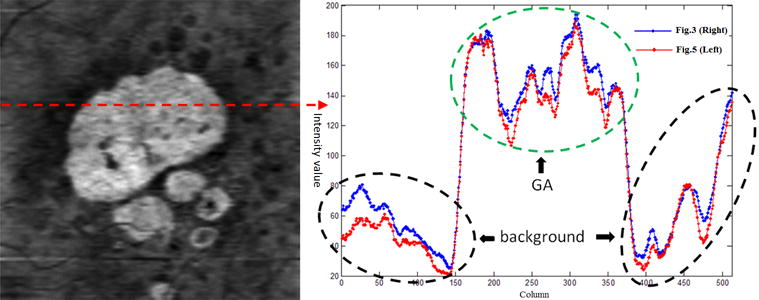
GA projection image by combining two GA characteristics. Final GA projection image (Left). One line profile (Right).
False Color Fusion
The drusen and GA projection techniques described above are tailored to display one pathological feature (either drusen or GA). In order to display drusen and GA simultaneously in one image, a false color fusion strategy is adopted. The three components (R, G, B) of the false color image consist of the SVP projection image, the drusen image, and the GA projection image, respectively.
Fig. 6 shows the false color fusion result (Bottom Right) by combining the SVP projection image (Top Left), drusen (Top Right) and GA projection (Bottom Left) images. We can observe that drusen appears in the G component, and GA appears in the R and B components. It is also notable that drusen are darker in the GA projection image because they reduce the choroidal brightness. Thus, in the false color image, the drusen is greenish and the GA is purple hue. The false color image (Bottom Right) can display drusen and GA with different colors in one image, and allow for analysis of the location of drusen with respect to GA. For example, the location of drusen marked with the dashed yellow oval can be observed within the GA region (Bottom Right).
Figure 6.
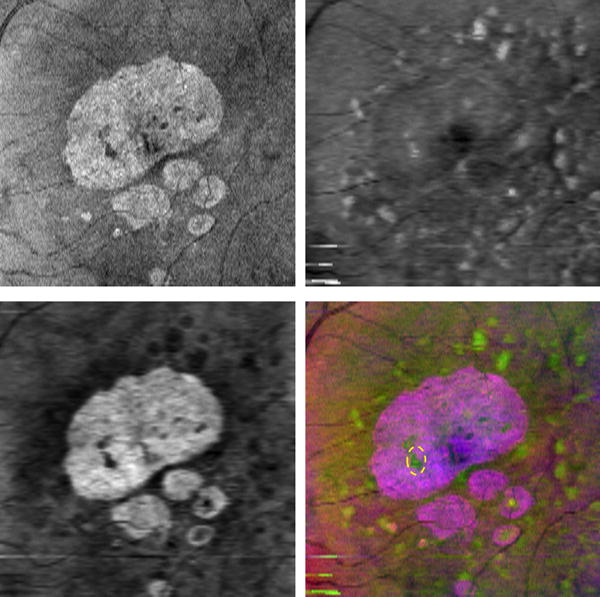
False color fusion for drusen and GA visualization. Top Left: SVP projection image (R component). Top Right: Drusen projection image (G component). Bottom Left: GA projection image (B component). Bottom Right: False color image, where the dashed yellow oval represents a drusen within the big GA region.
RESULTS
To evaluate our method, we analyzed 82 3D OCT retinal imaging datasets obtained from 7 patients. Each 3D OCT image set was acquired over a 6×6 mm area (corresponding to 512×128 pixels) and a 1024-pixel axial resolution with a commercial SD-OCT device (CirrusOCT; Carl Zeiss Meditec, Inc., Dublin, CA).
Evaluation Study
We performed both a qualitative and quantitative evaluation of the cases analyzed. Some of the patients also had color fundus photographs (CFPs) of their retinas, where both drusen and GA can be visualized. We manually outlined the drusen and GA lesions in the CFPs, SVP and false color image of these patients to qualitatively assess the drusen and GA visualization in each technique. Given length limitations of this manuscript only two different cases from two patients are qualitatively discussed.
Drusen and GA can be best assessed by looking at each B-scan in an SD-OCT cube. In order to create a gold standard to quantitatively evaluate drusen and GA visualization in false color images, three SD-OCT cubes from three patients were reviewed independently, B-scan by B-scan (128 B-scans per cube), by two readers (NSJ and SJJ). Both readers had expertise in reviewing OCT retinal studies. Given time constrains, only three of the 82 available SD-OCT cubes were reviewed in this quantitative study, since manually marking all 128 B-scans each cube was a very tedious task. These three cases were selected randomly from the set of 82. Each reader independently marked drusen in the OCT B-scans by hand, in a similar manner as in [18]. Each reader marked each image twice in two different sessions to enable assessment of intra-reader variation. Fig. 7 shows a representative sample of the drusen and GA markings, in which red and blue bars indicate the location of drusen and GA, respectively. These red and blue bars were then collapsed along the depth axis to produce an en face drusen/GA location maps (known as a “marking images”), which were used as the gold standard for our quantitative evaluation. The two segmentations of the drusen (or GA) made by each reader in the two separate reading sessions were also combined using their intersection to produce a single outline per reader per image. The same intersection operation was applied between the two segmentations made by different readers for each drusen (or GA) outline, producing a combined reader result.
Figure 7.
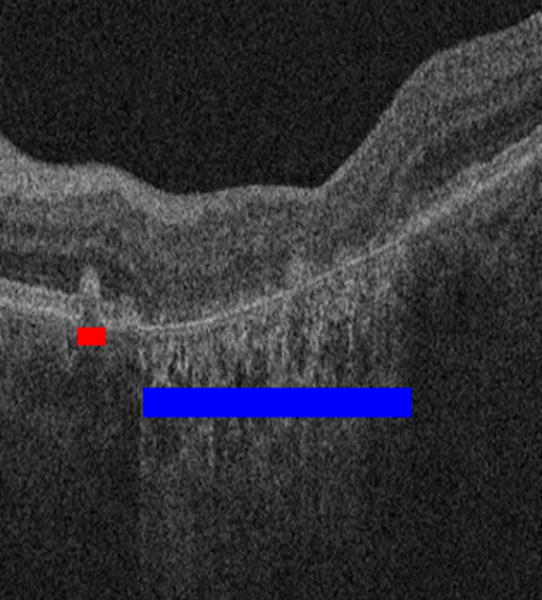
Drusen and GA marking by reader to establish the gold standard. The red bar indicates an area of drusen and the blue bar indicates an area of GA.
Drusen and GA were also outlined by hand in the corresponding CFPs, SVP and false color images. The outlines were then compared quantitatively to the images marked by the readers (the gold standard). Since the boundaries of drusen and GA are very blurry in CFPs, SVP and false color images, the outlines are not precise. Thus, instead of pixel by pixel classification, we used an overlap ratio of the number of visualized lesions as the metric to quantitatively evaluate drusen and GA visualization in each technique:
| (2) |
where ‘# co_lesion’ denotes the number of drusen (or GA) outlined both in the gold standard image and in the false color images, and ‘# mark_lesion’ denotes the number of drusen (or GA) in the gold standard image. This metric represented the utility of the proposed method to identify drusen and GA present in the cube: if most of the drusen (or GA) outlined in the gold standard images could also be visualized in the en face image, the overlap ratio would be closer to 1. However, as more drusen (or GA) are “missed” in the en face images, this overlap ratio would approach zero. We used an overlap ratio of the number of total lesions found in each image, and not of outlined pixels, because the boundaries of lesions in CFPs, SVP and false color images are too obscure to be accurately outlined, as shown in Figs. 8 and 9.
Figure 8.
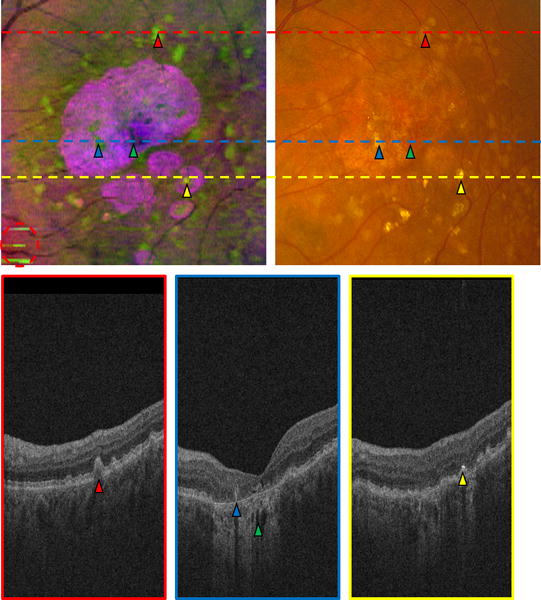
Comparison of false color image (Top Left) and CFP (Top Right) in the left eye of a patient. Three B-scans (Bottom row) correspond to the three lines in (Top row). A red triangle indicates a druse in the fundus images (Top row) and the B-scan (Bottom Left); blue and yellow triangles mark two drusen within GA regions; a green triangle indicates a dark hole within the bright choroid; a yellow triangle marks a very bright region in the B-scan (Bottom Right), and a corresponding bright region in the fundus images (Top row). The red circled region in (Top Left) indicates artifacts in the false color image, produced by an inaccurate estimation of the RPE in a problematic area.
Figure 9.
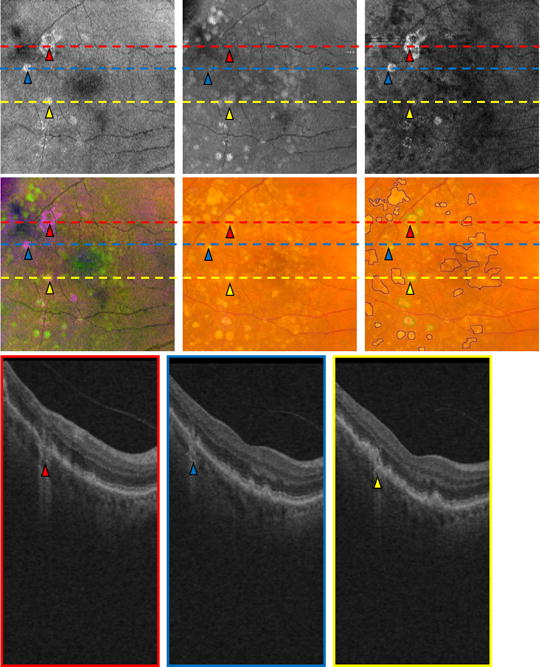
Comparison of an OCT retinal image projection in the right eye of a patient. Three B-scans (Bottom row) correspond to the three lines in (Top and Middle rows). The red, blue and yellow triangles in the three B-scans (Bottom row) correspond to the GA location in the three projection images (Top row) and the color fundus images (Middle row). SVP projection image (Top Left). Drusen projection image (Top Middle). GA projection image (Top Right). False color image (Middle Left). CFP (Middle Middle). Marked CFP (Middle Right).
In order to reflect false positives, an over-estimated ratio is also used:
| (3) |
where ‘# false_lesion’ denotes the number of drusen (or GA) outlined in the false color images, but not identified in the gold standard images.
Qualitative Evaluation
Fig. 8 shows the comparison of the false color image and the CFP in one patient. The corresponding SVP projection image is shown in Fig. 6(Top Left). Compared with the CFP (Fig. 8(Top Right)), the false color image (Fig. 8(Top Left)) is qualitatively better for displaying and distinguishing the drusen and GA, because the contrast of the false color image is higher, and the color difference between drusen and GA is more obvious in the false color image. However, due to an inaccurate RPE extraction in some problematic areas, there are also artifacts in the false color image. For example, the circled region in Fig. 8(Top Left) shows areas which are not actual drusen, though these artifacts only minimally affect drusen visualization.
Fig. 9 shows the drusen and GA visualization of another patient. Figs. 9(Top row) are the SVP, drusen and GA projection images, respectively. Figs. 9(Middle Left and Middle Middle) are the false color image and the CFP, respectively. Fig. 9(Middle Right) is the CFP image where the drusen and GA are manually marked with the blue and green outlines, respectively. Figs. 9(Bottom row) are three B-scans corresponding to the red, blue and yellow lines in (Top and Middle rows). From Fig. 9, we can observe that (1) drusen are visible in the drusen projection image, false color image and CFP, and GA are visible in the SVP projection image, GA projection image, false color image and CFP; (2) the contrast of GA in the GA projection image generated with our method is better than in the traditional SVP projection image; (3) drusen and GA can be easily distinguished in the false color image generated by incorporating the SVP, drusen and GA projection images, while it is difficult to distinguish drusen and GA in the CFP. The three B-scans (Figs. 9(Bottom row)) indicate that the RPE thinning characteristic is not always satisfied for GA. Since RPE thinning is not always seen in all GA areas, RPE thinning is auxiliary characteristic to the bright choroid characteristic in our proposed GA visualization method.
Quantitative Evaluation
Table 1 shows the inter-reader and intra-reader agreement in terms of overlap ratio, where “Reader ki” denotes the segmentation outlined by reader k in the i-th session. The manual segmentations outlined by reader 2 were slightly more consistent between the two sessions that those outlined by reader 1 in average, and the overlap ratio was higher for GA segmentations than for drusen segmentations.
TABLE 1.
Overlap ratio evaluation (unit: %) in inter-reader and intra-reader segmentations
| Image | Reader 11–Reader 12 | Reader 21–Reader 22 | Reader 1–Reader 2 | |||
|---|---|---|---|---|---|---|
|
| ||||||
| Drusen | GA | Drusen | GA | Drusen | GA | |
| Patient 1 | 81.8 | 88.9 | 73.2 | 100.0 | 90.3 | 66.7 |
| Patient 2 | 94.9 | 100.0 | 84.4 | 100.0 | 81.5 | 66.7 |
| Patient 3 | 29.4 | 100.0 | 66.7 | 100.0 | 66.7 | 100.0 |
| Mean | 68.7 | 96.3 | 74.8 | 100.0 | 79.5 | 77.8 |
Table 2 shows the comparison of drusen and GA overlap ratio for SVP, CFP and the proposed method in three OCT scans from three different patients. Table 3 shows the comparison of drusen and GA over-estimated ratio, and Table 4 shows the number of drusen and GA in gold standard, SVP, CFP and false color images. The eyes of patients 1 and 2 in Tables 1–4 correspond to Figs. 8 and 9, respectively. The rows labeled as “Readers 1 & 2” correspond to the results from overlapping the manual outlines drawn by the two different readers and represent the evaluation for an average reader. From Tables 2–4, it can be seen that the false color images are generally more effective for the visualization of drusen and GA than SVP and CFP. The SVP images allow the visualization of GA with the same performance as our method, but drusen are almost invisible, and thus the overlap ratio and the over-estimated ratio with the gold standard are both very small. On the other hand, the CFP images present a more acceptable performance in displaying drusen but worse GA visualization, making it harder to distinguish between the two diseases. Since in CFPs the contrast of GA is low (as shown in Fig. 8, Top Right) and it is difficult to distinguish drusen and GA (as shown in Fig. 9 (Middle Middle)), the GA overlap ratio of CFP is obviously lower than those of SVP and false color images, and the drusen over-estimated ratio of CFP is higher than those of SVP and false color images. For the drusen visualization of patient 2, CFP is better than our method, likely because our method missed some small drusen due to some artifacts produced by an inaccurate segmentation of RPE layers. Nevertheless, our method was better on average. The GA overlap ratio is substantially higher than the drusen overlap ratio because GA lesions are usually larger and more easily identified than drusen. In fact, all GA regions were correctly identified in our proposed method in the segmentations by Reader 1, and nearly all by Reader 2. Drusen were identified better by Reader 2 and the overlap was very high (85.6%) when combining the outlines drawn by the two readers. It is also interesting to note that our method produced an overlap ratio both for drusen and GA (Table 2) that resulted similar to the differences observed between the readers when inspecting the cubes B-scan by B-scan (Table 1). The differences observed between the segmentations drawn by a reader in the images produced by our method and the ones drawn by the same reader when inspecting B-scan by B-scan were comparable to the ones observed when inspecting the B-scans in two separate sessions. In the same way, the differences found between our method and the gold standard (B-scan inspection) for an average reader segmentation were similar to those observed between two different readers inspecting the B-scans.
TABLE 2.
Drusen and GA overlap ratio (unit: %) in SVP, CFP, and the proposed method (“Ours”) compared with the gold standard. The maximum overlap ratios for each method are shown in bold.
| Image | Patient 1 | Patient 2 | Patient 3 | Mean | ||
|---|---|---|---|---|---|---|
| Reader 1 | Drusen | SVP | 4.9 | 11.8 | 0.0 | 5.6 |
| CFP | 43.9 | 85.3 | 44.0 | 57.7 | ||
| Ours | 63.4 | 64.7 | 77.8 | 68.6 | ||
| GA | SVP | 100.0 | 100.0 | 100.0 | 100.0 | |
| CFP | 25.0 | 75.0 | 100.0 | 66.7 | ||
| Ours | 100.0 | 100.0 | 100.0 | 100.0 | ||
| Reader 2 | Drusen | SVP | 3.2 | 11.0 | 0.0 | 4.7 |
| CFP | 41.9 | 88.9 | 66.7 | 65.8 | ||
| Ours | 80.7 | 70.4 | 66.7 | 72.6 | ||
| GA | SVP | 66.7 | 100.0 | 100.0 | 88.9 | |
| CFP | 33.3 | 66.7 | 100.0 | 66.7 | ||
| Ours | 66.7 | 100.0 | 100.0 | 88.9 | ||
| Readers 1 & 2 | Drusen | SVP | 3.9 | 15.4 | 0.0 | 6.4 |
| CFP | 50.0 | 92.3 | 50.0 | 64.1 | ||
| Ours | 88.5 | 80.8 | 87.5 | 85.6 | ||
| GA | SVP | 100.0 | 100.0 | 100.0 | 100.0 | |
| CFP | 25.0 | 75.0 | 100.0 | 66.7 | ||
| Ours | 100.0 | 100.0 | 100.0 | 100.0 |
TABLE 3.
Drusen and GA over-estimated ratio (unit: %) in SVP, CFP, and the proposed method (“Ours”) compared with the gold standard. The maximum over-estimated ratios for each method are shown in bold.
| Image | Patient 1 | Patient 2 | Patient 3 | Mean | ||
|---|---|---|---|---|---|---|
| Reader 1 | Drusen | SVP | 0.0 | 0.0 | 0.0 | 0.0 |
| CFP | 39.0 | 52.9 | 200.0 | 97.3 | ||
| Ours | 29.3 | 26.5 | 11.1 | 22.3 | ||
| GA | SVP | 0.0 | 100.0 | 0.0 | 33.3 | |
| CFP | 0.0 | 100.0 | 0.0 | 33.3 | ||
| Ours | 0.0 | 100.0 | 0.0 | 33.3 | ||
| Reader 2 | Drusen | SVP | 3.23 | 0.0 | 0.0 | 1.08 |
| CFP | 71.0 | 51.9 | 266.7 | 129.9 | ||
| Ours | 41.9 | 11.1 | 16.7 | 23.2 | ||
| GA | SVP | 0.0 | 100.0 | 0.0 | 33.3 | |
| CFP | 0.0 | 100.0 | 0.0 | 33.3 | ||
| Ours | 0.0 | 100.0 | 0.0 | 33.3 | ||
| Readers 1 & 2 | Drusen | SVP | 3.85 | 0.0 | 0.0 | 1.28 |
| CFP | 88.5 | 84.6 | 225.0 | 132.7 | ||
| Ours | 61.5 | 42.3 | 12.5 | 38.8 | ||
| GA | SVP | 0.0 | 100.0 | 0.0 | 33.3 | |
| CFP | 0.0 | 100.0 | 0.0 | 33.3 | ||
| Ours | 0.0 | 100.0 | 0.0 | 33.3 |
TABLE 4.
Number of drusen and GA in gold standard, SVP, CFP and false color images
| Image | Patient 1 | Patient 2 | Patient 3 | |
|---|---|---|---|---|
| Drusen | Reader 1 | 41 | 34 | 9 |
| Reader 2 | 31 | 27 | 6 | |
| Readers 1 & 2 | 26 | 26 | 8 | |
| SVP | 2 | 3 | 0 | |
| CFP | 35 | 45 | 22 | |
| Ours | 38 | 29 | 7 | |
| GA | Reader 1 | 8 | 4 | 2 |
| Reader 2 | 3 | 3 | 1 | |
| Readers 1 & 2 | 8 | 4 | 1 | |
| SVP | 6 | 6 | 1 | |
| CFP | 2 | 6 | 1 | |
| Ours | 6 | 6 | 1 |
DISCUSSION
This paper introduces a new visualization technique in which drusen and areas of GA can be clearly assessed in the same image. In current practice, drusen and GA are usually identified in CFPs. However, drusen can sometimes be very hard to distinguish in CFPs and can also be masked by the presence of GA due to the inability of CFPs to resolve structures in the depth axis. The most reliable way to identify and distinguish areas of drusen and GA is by inspecting SD-OCT cubes B-scan by B-scan. However, this task can be very tedious and time consuming, considering that each cube typically consists of 128 B-scans for images of the macula. An alternative is inspecting SVP images obtained from the SD-OCT cubes by projecting them in the depth axis, in which a single image covers the whole area to examine in the macula. However, a traditional SVP projection usually masks drusen and does not take advantage of the ability of SD-OCT to resolve structures in the depth-axis.15 Our introduced technique takes advantage of this ability and allows the visualization of both drusen and GA present in the macula in a single image, while clearly distinguishing between them using a false color mapping. Figs. 8 and 9 are examples of this improved visualization technique. Although we analyzed visually the results from 82 different cases, we only presented the results from two of the cases given the manuscript length limitations. The results obtained in the rest of the cases were also satisfactory by visual inspection. By comparing with SVP and CFP, we also analyzed the results produced by three of the cubes quantitatively. In general, our method is better for the drusen and GA visualization than SVP and CFP. A combination of two readers was able to clearly identify all GA areas in our proposed method, while also identifying the majority of drusen.
The purpose of this paper is to simultaneously display drusen and GA in a single projection image from 3D SD-OCT images, not to segment drusen and GA. Based on the difference between the actual RPE segmentation and the RPE floor (or Bruch’s membrane), drusen can be segmented from OCT images.12, 29–31 Schutze et al. compared the automatic GA segmentation performance with current SD-OCT devices.32 This study showed substantial limitations in identifying zones of GA reliably, which should be addressed to visualize and document RPE loss realistically.32 Our proposed false color fusion strategy can facilitate the qualitative analysis of drusen and GA. By using semiautomated software,33 drusen and GA can also be quantitatively analyzed in false color images.
There are some artifacts associated to some areas of erroneous segmentation of the RPE layer. Numerous segmentation methods of retinal layers in SD-OCT have been proposed in previous literature, and they produce high quality results in most healthy cases. However, the presence of abnormalities, noise in lower quality scans, and retinal deformities makes the segmentation very difficult. In this work we developed a simple and fast approach to RPE segmentation, since a perfect segmentation was not needed for the generation of the false color images. The green areas erroneously marked in Fig. 8(Top Left) can be clearly identified as artifacts and differentiated from drusen visually. Nevertheless, we plan to reduce these artifacts in future work by a better segmentation of the RPE layer. This will be done by expanding the RPE segmentation technique to a three-dimensional approach, taking advantage of the three-dimensional nature of SD-OCT cubes, as well as including the segmentation of more retinal layers.
In conclusion, we present a novel visualization method for drusen and GA. It enhances GA visualization by incorporating the bright choroid and thin RPE characteristics of GA into the visualization method. In order to effectively display drusen and GA in a single image, we propose a false color fusion strategy to combine the drusen and GA projection images. Experimental results demonstrate that the false color image is more effective for the drusen and GA visualization than the SVP image and CFP. Most drusen are not visible in SVP images, and the contrast of GA in SVP images is lower than that in the GA projection image. Although drusen and GA are visible in CFPs, they are difficult to distinguish because of low contrast. In false color images, the color difference between drusen and GA is more obvious. Our proposed method may improve ability of ophthalmologist to visualize and evaluate druesn and GA.
Acknowledgments
GRANT INFORMATION AND ACKNOWLEDGEMENTS
This work was supported by a grant from the Fundamental Research Funds for the Central Universities, grant no. 30920140111004, the Bio-X Interdisciplinary Initiatives Program of Stanford University, a grant from the National Cancer Institute, National Institutes of Health, grant No. U01-CA-142555, and Qing Lan Project.
References
- 1.Gehrs KM, Anderson DH, Johnson LV, Hageman GS. Age-related macular degeneration-emerging pathogenetic and therapeutic concepts. Annals of Medicine. 2006;38:450–71. doi: 10.1080/07853890600946724. [DOI] [PMC free article] [PubMed] [Google Scholar]
- 2.Resnikoff S, Pascolini D, Etya’als D, et al. Global data on visual impairment in the year 2002. Bull world Health Organ. 2004;82:844–51. [PMC free article] [PubMed] [Google Scholar]
- 3.Bressler NM, Bressler SB, Fine SL. Age-related macular degeneration. Surv Ophthalmol. 1988;32:375–413. doi: 10.1016/0039-6257(88)90052-5. [DOI] [PubMed] [Google Scholar]
- 4.Jager RD, Mieler WF, Miller JW. Age-related macular degeneration. N Engl J Med. 2008;358:2606–17. doi: 10.1056/NEJMra0801537. [DOI] [PubMed] [Google Scholar]
- 5.Abdelsalam A, Del Priore L, Zarbin MA. Drusen in age-related macular degeneration: pathogenesis, natural course, and laser photocoagulation-induced regression. Surv Ophthalmol. 1999;44:1–29. doi: 10.1016/s0039-6257(99)00072-7. [DOI] [PubMed] [Google Scholar]
- 6.Wang JJ, Rochtchina E, Lee AJ, Chia EM, Smith W, Cumming RG, Mitchell P. Ten-year incidence and progression of age-related maculopathy: the blue Mountains Eye Study. Ophthalmol. 2007;114:92–98. doi: 10.1016/j.ophtha.2006.07.017. [DOI] [PubMed] [Google Scholar]
- 7.Klein R, Klein BE, Knudtson MD, Meuer SM, Swift M, Gangnon RE. Fifteen-year cumulative incidence of age-related macular degeneration: the Beaver Dam Eye Study. Ophthalmol. 2007;114:253–262. doi: 10.1016/j.ophtha.2006.10.040. [DOI] [PubMed] [Google Scholar]
- 8.Buch H, Nielsen NV, Vinging T, Jensen GB, Prause JU, Ia Cour M. 14-year incidence, progression, and visual morbidity of age-related maculopathy: the Copenhagen City Eye Study. Ophthalmol. 2005;112:787–798. doi: 10.1016/j.ophtha.2004.11.040. [DOI] [PubMed] [Google Scholar]
- 9.Jain N, Farsiu S, Khanifar AA, Bearelly S, et al. Quantitative comparison of drusen segmented on SD-OCT versus drusen delineated on color fundus photographs. Investigative Ophthalmology & Visual Science. 2010;51:4875–83. doi: 10.1167/iovs.09-4962. [DOI] [PMC free article] [PubMed] [Google Scholar]
- 10.Age-Related Eye Disease Study Research Group. The age-related eye disease study system for classifying age-related macular degeneration from stereoscopic color fundus photographs: the Age-Related Eye Disease Study Report Number 6. Am J Ophthalmol. 2001;132:668–81. doi: 10.1016/s0002-9394(01)01218-1. [DOI] [PubMed] [Google Scholar]
- 11.Smith RT, Chan JK, Nagasaki T, et al. A method of drusen measurement based on reconstruction of fundus background reflectance. Br J Ophthalmol. 2005;89:87–91. doi: 10.1136/bjo.2004.042937. [DOI] [PMC free article] [PubMed] [Google Scholar]
- 12.Gregori G, Wang F, Rosenfeld PJ, et al. Spectral domain optical coherence tomography imaging of drusen in nonexudative age-related macular degeneration. Ophthalmol. 2011;118:1373–1379. doi: 10.1016/j.ophtha.2010.11.013. [DOI] [PMC free article] [PubMed] [Google Scholar]
- 13.Yehoshua Z, Rosenfeld PJ, Albini TA. Current clinical trials in dry AMD and the definition of appropriate clinical outcome measures. Seminars in Ophthalmology. 2011;26:167–180. doi: 10.3109/08820538.2011.577132. [DOI] [PubMed] [Google Scholar]
- 14.Khanifar AA, Koreishi AF, Izatt JA, Toth CA. Drusen ultrastructure imaging with spectral domain optical coherence tomography in age-related macular degeneration. Ophthalmol. 2008;115:1883–90.e1. doi: 10.1016/j.ophtha.2008.04.041. [DOI] [PMC free article] [PubMed] [Google Scholar]
- 15.Jiao S, Knighton R, Huang X, Gregori G, Puliafito C. Simultaneous acquisition of sectional and fundus ophthalmic images with spectral-domain optical coherence tomography. Opt Express. 2005;13:444–452. doi: 10.1364/opex.13.000444. [DOI] [PubMed] [Google Scholar]
- 16.Khanifar AA, Koreishi AF, Izatt Ja, Toth CA. Drusen ultrastructure imaging with spectral domain optical coherence tomography in age-related macular degeneration. Ophthalmol. 2008;115:1883–1890. doi: 10.1016/j.ophtha.2008.04.041. [DOI] [PMC free article] [PubMed] [Google Scholar]
- 17.Wojtkowski M, Srinivasan V, Fujimoto JG, et al. Three-dimensional retinal imaging with high-speed ultrahigh-resolution optical coherence tomography. Ophthalmol. 2005;112:1734–1746. doi: 10.1016/j.ophtha.2005.05.023. [DOI] [PMC free article] [PubMed] [Google Scholar]
- 18.Stopa M, Bower BA, Davies E, et al. Correlation of pathologica features in spectral domain optical coherence tomography with conventional retinal studies. Retina. 2008;28:298–308. doi: 10.1097/IAE.0b013e3181567798. [DOI] [PubMed] [Google Scholar]
- 19.Gorczynska I, Srinivasan VJ, Vuong LN, et al. Projection OCT fundus imaging for visualizing outer retinal pathology in non-exudative age-related macular degeneration. Br J Ophthalmol. 2009;93:603–9. doi: 10.1136/bjo.2007.136101. [DOI] [PMC free article] [PubMed] [Google Scholar]
- 20.Rubin DL, de Sisternes L, Kutzscher L, Chen Q, Leng T, Zheng LL. Quantitative evaluation of drusen on photographs. Ophthalmol. 2013;120:644–644.e2. doi: 10.1016/j.ophtha.2012.09.052. [DOI] [PMC free article] [PubMed] [Google Scholar]
- 21.Chen Q, Leng T, Zheng LL, Kutzscher L, de Sisternes L, Rubin DL. An improved OCT-derived fundus projection image for drusen visualization. Retina. 2013 doi: 10.1097/IAE.0000000000000018. in press. [DOI] [PubMed] [Google Scholar]
- 22.Bearelly S, Chau FY, Koreishi A, et al. Spectral domain optical coherence tomography imaging of geographic atrophy margins. Ophthalmol. 2009;116:1762–1769. doi: 10.1016/j.ophtha.2009.04.015. [DOI] [PMC free article] [PubMed] [Google Scholar]
- 23.Dunaief JL, Dentchev T, Ying GS, Milam AH. The role of apoptosis in age-related macular degeneration. Arch Ophthalmol. 2002;120:1435–1442. doi: 10.1001/archopht.120.11.1435. [DOI] [PubMed] [Google Scholar]
- 24.Hageman GS, Luthert PJ, Victor Chong NH, et al. An integrated hypothesis that considers drusen as biomarkers of immune-mediated processes at the RPE-Bruch’s membrane interface in aging and age-related macular degeneration. Prog Retin Eye Res. 2001;20:705–732. doi: 10.1016/s1350-9462(01)00010-6. [DOI] [PubMed] [Google Scholar]
- 25.Lutty G, Grunwald J, Majji AB, Uyama M, Yoneya S. Changes in choriocapillaris and retinal pigment epithelium in age-related macular degeneration. Mol Vis. 1999;5:35. [PubMed] [Google Scholar]
- 26.McLeod DS, Taomoto M, Otsuji T, et al. Quantifying changes in RPE and choroidal vasculature in eyes with age-related macular degeneration. Invest Ophthalmol Vis Sci. 2002;43:1986–1993. [PubMed] [Google Scholar]
- 27.Yehoshua Z, Rosenfeld PJ, Gregori G, et al. Progression of geographic atrophy in age-related macular degeneration imaged with spectral domain optical coherence tomography. Ophthalmol. 2011;118:679–686. doi: 10.1016/j.ophtha.2010.08.018. [DOI] [PMC free article] [PubMed] [Google Scholar]
- 28.Tomasi C, Manduchi R. Bilateral filtering for gray and color images. Proceedings of the International Conference on Computer Vision (ICCV) 1998:839–846. [Google Scholar]
- 29.Schlanitz FG, Baumann B, Spalek T, Schutze C, Ahlers C, Pircher M, Gotzinger E, Hitzenberger CK, Schmidt-Erfurth U. Performance of automated drusen detection by polarization-sensitive optical coherence tomography. Invest Ophthalmol Vis Sci. 2011;52:4571–4579. doi: 10.1167/iovs.10-6846. [DOI] [PubMed] [Google Scholar]
- 30.Yehoshua Z, Wang F, Rosenfeld PJ, Penha FM, Feuer WJ, Gregori G. Natural history of drusen morphology in age-related macular degeneration using spectral domain optical coherence tomography. Ophthalmol. 2011;118:2434–2441. doi: 10.1016/j.ophtha.2011.05.008. [DOI] [PMC free article] [PubMed] [Google Scholar]
- 31.Iwama D, Hangai M, Ooto S, Sakamoto A, Nakanishi H, Fujimura T, Domalpally A, Danis RP, Yoshimura N. Automated assessment of drusen using three-dimensional spectral-domain optical coherence tomography. Invest Ophthalmol Vis Sci. 2012;53:1576–1583. doi: 10.1167/iovs.11-8103. [DOI] [PubMed] [Google Scholar]
- 32.Schutze C, Ahlers C, Sacu S, Mylonas G, Sayegh R, Golbaz I, Matt G, Stock G, Schmidt-Erfurth Performance of OCT segmentation procedures to assess morphology and extension in geographic atrophy. Acta Ophthalmol. 2011;89:235–240. doi: 10.1111/j.1755-3768.2010.01955.x. [DOI] [PubMed] [Google Scholar]
- 33.Schmitz-Valckenberg S, Brinkmann CK, Alten F, Herrmann P, Stratmann NK, Gobel AP, Fleckenstein M, Diller M, Jaffe GJ, Holz FG. Semiautomated image processing method for identification and quantification of geographic atrophy in age-related macular degeneration. Invest Ophthalmol Vis Sci. 2011;52:7640–7646. doi: 10.1167/iovs.11-7457. [DOI] [PubMed] [Google Scholar]


