

Abstract
Purpose
Using [18F]PBR06 positron emission tomography (PET) to characterize the time course of stroke-associated neuroinflammation (SAN) in mice, to evaluate whether brain microglia influences motor function after stroke, and to demonstrate the use of [18F]PBR06 PET as a therapeutic assessment tool.
Procedures
Stroke was induced by transient middle cerebral artery occlusion (MCAO) in Balb/c mice (control, stroke, and stroke with poststroke minocycline treatment). [18 F]PBR06 PET/CT imaging, rotarod tests, and immunohistochemistry (IHC) were performed 3, 11, and 22 days poststroke induction (PSI).
Results
The stroke group exhibited significantly increased microglial activation, and impaired motor function. Peak microglial activation was 11 days PSI. There was a strong association between microglial activation, motor function, and microglial protein expression on IHC. Minocycline significantly reduced microglial activation and improved motor function by day 22 PSI.
Conclusion
[18 F]PBR06 PET imaging noninvasively characterizes the time course of SAN, and shows increased microglial activation is associated with decreased motor function.
Keywords: Stroke, [18F]PBR06 PET imaging, Microglia, Neuroinflammation, Mice, Motor function, Minocycline
Introduction
Neuroinflammation mediated by activated microglia is a core mechanism of chronic impairment of brain function after a substantial range of brain injuries, with stroke being a well-characterized example. Stroke is a leading cause of chronic morbidity in the USA involving both motor and cognitive impairments. The initial ischemic insult and infarction triggers an inflammatory cascade which features generation of reactive oxygen species (ROS), secretion of cytokines and chemokines, and microglial activation as prominent components [1–4]. The persistence of microglial inflammation long after the initial injury suggests an opportunity to impact chronic functional deficits through anti-inflammatory interventions. In experimental rodent models, these interventions have been associated with a decrease in activated microglia, increase in neurogenesis, and improvement in motor and cognitive impairment as assessed by immunohistochemistry of brain tissues and functional assays such as maze tests and the accelerating rotarod test [5–7]. Microglial proteins further serve as therapeutic targets for various neuroinflammatory disorders, and various anti-inflammatory interventions following stroke in rodents are associated with a decrease in activated microglia, increase in neurogenesis, and improvement in functional impairment [8].
The 18 kDa translocator protein (TSPO), formerly known as the peripheral benzodiazapene receptor [9], is a microglial protein located on the outer mitochondrial membrane of steroid-synthesizing tissues. TSPO expression is low in the normal brain but increases substantially in response to neuroinflammatory and neurodegenerative disorders. TSPO has thus been used as a biomarker of neuroinflammatory disorders, and a number of positron emission tomography (PET)-based radioligands that serve as its substrates have been developed [10–16]. We recently demonstrated that one such PET-based radioligand, [18F]PBR06, specifically images TSPO in microglia-mediated neuroinflammation in the mouse brain after stroke induction [17]. Noninvasive imaging permits monitoring of stroke-associated neuroinflammation (SAN) over time within the same animal and its correlation with functional/behavioral assessments. The current study seeks to evaluate SAN longitudinally using [18F]PBR06 PET and to correlate the changes in imaging signal with serial motor and neurobehavioral testing (rotarod tests) and immunohistochemistry (IHC) in mouse models of stroke. Additionally, we seek to demonstrate (with minocycline) that [18F]PBR06 PET may be used to evaluate novel anti-inflammatory interventions for SAN. We specifically chose minocycline because it had been previously shown to be an effective intervention for stroke and its effect on activated microglia has been evaluated through immunochemistry and other methods [18, 19]. Our goal was to demonstrate, with an already known intervention, the capability of our imaging methodology as a screening tool for novel therapeutic agents.
Materials and Methods
Preparation of [18F]PBR06
The tracer was prepared as previously described [17, 20]. Briefly, aqueous [18F]fluoride ion was dried, complexed with 18-Crown-6, and reacted with the precursor N-(2,5-dimethoxybenzyl)-2-bromo-N-(2-phenoxyphenyl)acetamide. It was then purified by injecting into a semi preparative Gemini C18 column (5 μm, 10 mm× 250 mm; Phenomenex, Torrance, CA) at 214 nm. [18F]PBR06 was eluted at 5 ml/min with a mixture of 50 mM ammonium formate (pH 6) and 50 mM ammonium formate in MeCN (25:75, v/v). The specific radioactivities were 4,357 mCi/umol 5.4 % DCY; 2,548 mCi/umol, 2.4 % DCY; and 1,851 mCi/umol, 2.6 % DCY for 3, 11, and 22 days, respectively. On average, 150 ul of the tracer was injected into each mouse.
Stroke Induction and Minocycline Treatment
All the experiments were approved by the Administrative Panel on Laboratory Animal Care (APLAC) of Stanford University. A total of 20 Balb/c female mice (nine stroke, eight stroke plus minocycline, and three sham controls; Charles River Laboratories, Wilmington, MA) were randomly assigned to a specific treatment. Strokes were induced by the middle cerebral artery occlusion (MCAO) procedure as previously described [21]. Minocycline was dissolved in saline solution and administered through intraperitoneal injections at 50 mg/kg in a total volume of 100 ul every day for a week, starting 1 h after reperfusion. Thereafter, it was administered every other day for the duration of the experiment.
Rotarod Test
An accelerating rotarod (Rotamex-5; Columbus Instruments, Columbus, Ohio) was used to evaluate the mouse motor function [22]. Mice underwent the rotarod test on days 3, 11, and 22 PSI, immediately before [18F]PBR06 PET imaging. The protocol involved acceleration from 3 to 30 revolutions per min and the test ended when a mouse fell off the rod. A connected computer immediately recorded the time and speed at which the mouse fell off. Each mouse underwent three different tests for each day.
MR Imaging
The mice were anesthetized with 2 % isoflurane in oxygen and high resolution MRI was acquired (2 days PSI) as previously described [17] on a 7-T animal MRI scanner (GE-Varian “microSigna 7.0” GE Healthcare, Waukesha, WI; Varian Inc., Walnut Creek, CA) with a 9-cm bore gradient insert (Resonance Research, Inc., Billerica, MA, USA) and the LX11 control console (GE Healthcare, Waukesha, WI, USA). The coil was a 1.5-cm diameter transmit-receive surface coil, and the imaging sequence was a T2-weighted (T2w) fast spin echo with fat saturation.
PET/CT Imaging
Scanning was performed with a MicroPET Inveon PET/CT rodent model instrument (Siemens Medical Solutions Inc., Malvern, PA) using a 4-mouse holder with nose cones for isoflurane anesthesia administration [17]. Prior to imaging, four mice were injected intravenously with an average of 9.5 MBq (258 μCi) of [18F]PBR06. They were then imaged 70–80 min later. This was based on our previous study [23] which showed that the tracer uptake ratio between the infarct and comparable regions on the non-infarct hemisphere was highest between 60 to 80 min after [18F]PBR06 injection. The imaging protocol involved CT image acquisition for 10 min followed immediately by PET image acquisition for the next 15 min. Specifications for the CT imaging were 80 kv/500 mA; number of projections, 256; exposure time, 240 ms; effective pixel size, 103.06 μm; binning,4.
Image Analysis
PET image reconstruction was performed with the ordered subsets expectation maximization (OSEM) 2D algorithm [24]. No attenuation correction was applied during the reconstruction. However, the impact on quantification using the same multi-animal holder was previously determined to be minimal [25]. Images from PET, CT, and MRI were analyzed using an in-house software program, RT_Image [26]. Using rigid body transformation, PET/CT images were manually coregistered with MRI images by identifying matching anatomic features on the skull and brain. Ideally, the regions of interest (ROIs) would have been configured over regions of the infarct as defined by T2-weighted MRI for each time point. However, since there were no corresponding MRI images at days 11 and 22 PSI, the MRI images at 2 days PSI served as templates for the PET images. Based on the MR images, ellipsoidal ROIs were drawn on each slice to delineate the infarct region. Slices comprising 40 % of the total brain were then merged to form three-dimensional volumes within which included were the infarct and surrounding areas (Fig. 1). We had previously noticed from our earlier studies [17] that the infarct was always within this region of the brain. This standardized region of interest (ROI) was then placed within the same region of the MRI image, in all the brains analyzed, for all time points. A matching ROI was placed on the contralateral hemisphere for each animal. Radioactivity values were decay-corrected and expressed in units of percent injected dose per gram (%ID/g). Values on the ipsilateral hemisphere were normalized to the contralateral hemisphere and expressed as a percentage i.e., [(%ID/g ipsilateral–%ID/g contralateral)/%ID/g contralateral]×100. Due to the large ROIs (covering about 40 % of each brain) used in the analysis, the observed percentage increases for tracer uptake signifying microglial activation were smaller than expected. We were nevertheless able to detect significant differences in our comparisons.
Fig. 1.

Representative PET images, overlaid onto the MRI for the a axial, b sagittal, and c coronal planes of the mouse brain showing the different regions of interest (ROI) used in the analysis. The red ROI denotes the infarct region on the left hemisphere and the blue ROI denotes matching regions on the non-infarct hemisphere.
Immunohistochemistry
Immunohistochemistry (IHC) was performed for the microglial proteins TSPO, CD68, and CD11b. The primary antibodies used were rabbit monoclonal anti-mouse TSPO (Epitomics, Burlingame, CA), rat monoclonal anti-mouse CD68 (Abcam, Cambridge, MA), and rabbit polyclonal anti-mouse CD11b diluted at 1:500 (TSPO, CD68) and 1:100 (CD11b) in blocking solution. The secondary antibodies used were goat anti-rat IgG Alexa Fluor 488 and goat anti-rabbit IgG Alexa Fluor 594 (Invitrogen, Carlsbad, CA). The staining procedures were as follows: using a cryostat (Leica CM1950, Leica Biosystems, St Louis, MO), 10 μm sections were obtained from mouse brains frozen in OCT. The sections, on microscopic slides, were fixed with paraformaldehyde (20 min), placed in PBS containing NH4Cl (50 mmol/l; 5 min), and then transferred to chilled methanol-acetone (1:1 at −20 °C; 5 min), followed immediately by Triton-X 100 (0.1 % in PBS; 5 min). Blocking was performed with goat serum (5 %/Tween 0.5 %) in PBS for 30 min and immediately incubated with the primary antibodies at room temperature for 1 h followed by incubation with the secondary antibody, also for 1 h. Sections were washed with PBS after every step. They were mounted in DAPI-containing medium and imaged with a fluorescent microscope (Carl Zeiss Inc., Oberkochen, Germany). Adjacent sections were stained for CD68 and CD11b, and each protein was co-stained with TSPO. Each value represents the mean of 12 exposures over four different sections (four exposures per hemisphere per section) from each of the three mice at each time point. The intensity from each exposure was determined using the ImageJ program and values shown represent the difference between the mean intensity of the stroke and non-stroke regions, expressed as a percentage of the non-stroke region.
Statistical Analysis
Statistical analysis was performed using SAS 9.4 software (SAS Institute Inc., Cary NC) and GraphPad Prism software (GraphPad Software Inc., La Jolla, CA). To determine whether there were any differences in tracer uptake between days, we performed a 2-way ANOVA with day (3, 11, 22) and group (control, stroke, and stroke+minocycline) as the factors. Where an interaction was observed between the two factors, pairwise comparisons for the individual group means at specific days were performed. Means were separated using Tukey's test. To determine whether there was any association between microglial activation and motor function, linear regression tests were performed between tracer uptake values, time spent on the rotarod, and microglial protein expression for any significant association between the sets of measurements. P values less than 0.05 indicated a statistically significant difference.
Results
[18F]PBR06 PET Uptake and Accumulation Over Time
As previously described, [18F]PBR06 quantification was based on a standardized region of interest (ROI) drawn over the infarct on the left (ipsilateral) hemisphere with a comparable ROI placed on the right (contralateral) hemisphere (Fig. 1). As demonstrated by T2w MRI, the infarct covered regions over the left hemisphere of the mouse brain and these showed significantly higher uptake of [18F]PBR06 compared to corresponding regions on the non-stroke hemisphere in the stroke and stroke plus minocycline groups. In contrast, [18F]PBR06 uptake was not significantly increased in either brain hemisphere of the sham controls. The uptake increased significantly (by an average of 26 %) in the infarct regions relative to the non-infarct regions 3 days PSI. Peak accumulation was observed at 11 days, when the percentage increase was 52 %. By day 22 PSI however, tracer accumulation had reduced considerably (Fig. 2, Table 1).
Fig. 2.

Representative MR and PET images of the control mice (C), the stroke (S), or stroke plus minocycline (M) groups at 3, 11, and 22 days following stroke induction. Higher activity at the base of the brain and parts of the non-infarct hemisphere reflect increased uptake in the nasal passages and eyes. ROIs were configured to eliminate these effects. The values for the infarct regions were further normalized against equivalent regions on the non-infarct hemisphere.
Table 1. Effect of the occurrence of stroke and time on motor function, microglial activation (measured by [18F]PBR06 uptake, and microglial protein expression (TSPO, CD68, and CD11B) in mice.
| Time on rotaroda | [18F]-PBR06 uptake | TSPO | CD68 | CD11B | |
|---|---|---|---|---|---|
|
| |||||
| (min) | (Percent ipsilateral over contralateral hemisphere) | ||||
|
| |||||
| Group | |||||
| Control | 2.3 | 1d | 9d | 9d | 3d |
| Stroke | 1.4 | 59b | 296b | 416b | 157b |
| Stroke+minocycline | 1.7 | 47c | 160c | 365c | 55c |
| SEM | 0.17 | 1.1 | 64.1 | 33.1 | 11.5 |
| Day | |||||
| 3 | 1.7 | 26c | 105 | 180d | 64 |
| 11 | 1.5 | 52b | 242 | 345b | 86 |
| 22 | 1.1 | 29c | 118 | 264c | 64 |
| SEM | 0.45 | 12.4 | 53.8 | 105.1 | 37.0 |
| P | |||||
| Group | 0.0801 | <0.0001 | 0.0008 | <0.0001 | <0.0001 |
| Day | 0.1273 | 0.0019 | 0.0765 | 0.0144 | 0.0898 |
| Interaction | 0.0479 | 0.0887 | 0.2700 | 0.0583 | 0.2276 |
Entries in italics indicate significant effects (p<0.05)
Time on rotarod is a measure of motor function and the means shown reflect measures at four different time points, 0, 3, 11, and 22 days poststroke induction. There was a significant interaction between treatment group and day
Means within a column with different superscripts differ significantly (P=0.05)
Effect of Minocycline on [18F]PBR06 PET Accumulation and Time on the Rotarod
Over the period of the experiment, tracer accumulation in the stroke plus minocycline group was significantly lower (47 %) than in the stroke group (59 %). There was an interaction between the occurrence of stroke and day from onset of stroke on the length of time each mouse stayed on the rotarod (Table 1), indicating that the time on rotarod was influenced by the presence of stroke and the day from its onset. The nature of the interaction was such that, as [18F]PBR06 uptake increased (signifying microglial activation and the presence of stroke) in the infarct regions, the time on the rotarod decreased over 3 to 22 days PSI (Fig. 3a, Table 2). In contrast, the sham controls showed no significant increases in tracer uptake.
Fig. 3.
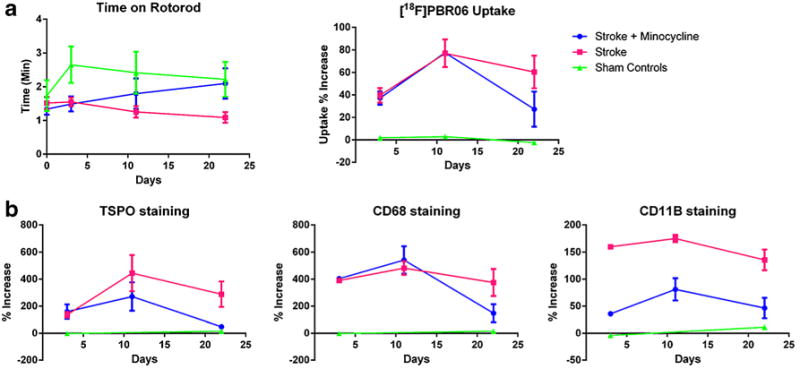
The time on rotarod and [18F]PBR06 accumulation (a) and microglial protein expression profiles for the three groups (b). Error bars represent SEM.
Table 2. Pairwise comparisons of length of time on rotarod for groups of mice at specific days.
| Group interactions | Day | P |
|---|---|---|
| Minocycline+stroke | 0 | 0.6441 |
| Minocycline+control | 0 | 0.3728 |
| Stroke+control | 0 | 0.6173 |
| Minocycline+stroke | 3 | 0.7382 |
| Minocycline+control | 3 | 0.0064 |
| Stroke+control | 3 | 0.0178 |
| Minocycline+stroke | 11 | 0.0723 |
| Minocycline+control | 11 | 0.2681 |
| Stroke+control | 11 | 0.0128 |
| Minocycline+stroke | 22 | 0.1136 |
| Minocycline+control | 22 | 0.5925 |
| Stroke+control | 22 | 0.0351 |
Entries in italics indicate significant effects (p<0.05)
Immunohistochemistry
There was intense CD68 expression in the left hemisphere of the stroke group 22 days PSI (Fig. 4a) corresponding to the infarct regions as identified on T2w MRI, and to the areas of highest [18F]PBR06 uptake on PET. CD68 expression was less intense and absent in the stroke plus minocycline and control groups, respectively. Within the infarct region, immunofluorescence staining demonstrated that large numbers of activated microglia indicated by CD68 staining coexpress TSPO, but were nearly absent in the non-infarct region (Fig. 4b). In the stroke plus minocycline group, there was no significant difference in the expression of both TSPO and CD68 at 3 and 11 days PSI, but significant reductions were observed at 22 days PSI (Fig. 4b). CD11b expression, an indication of total microglia, was lower in the stroke plus minocycline group compared to the stroke group at 22 days PSI. Quantification of the microglial proteins over time indicated that TSPO and CD68 expression at 3 and 11 days PSI were not significantly different. At 22 days PSI however, TSPO and CD68 expression were significantly higher in the infarct regions of the stroke group compared to the stroke plus minocycline and control groups. TSPO and CD68 expression profiles over 3, 11, and 22 days PSI were similar to [18F]PBR06 uptake profile over the period: significantly increased microglial protein expression and tracer uptake from 3 to 11 days PSI and maintained at similar levels at 22 days PSI for the stroke group. The expression profile of CD11b was slightly different from TSPO and CD68, where the stroke plus minocycline group showed significantly decreased expression of CD11b at all three time points. The quantified values represent the relative increase in intensity of the stroke over the non-stroke region expressed as a percentage of the non-stroke region.
Fig. 4.
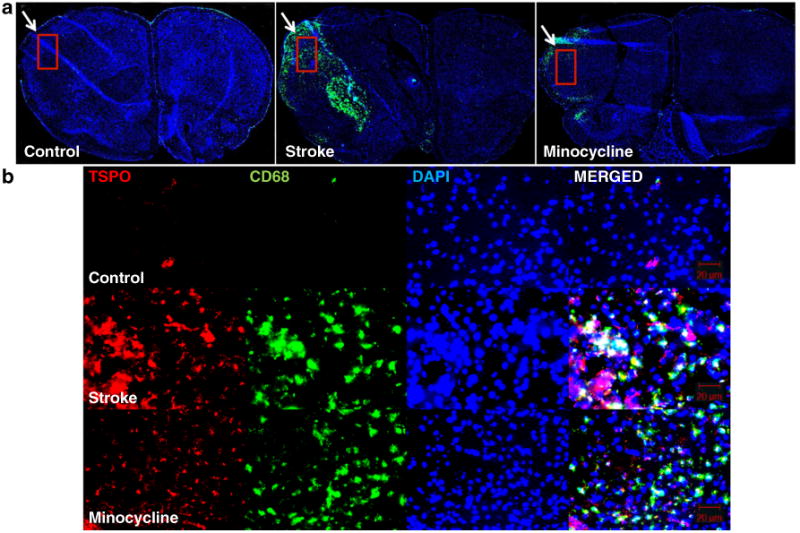
a CD68 immunohistochemistry demonstrates intense staining (arrow) indicating marked microglial activation in the regions corresponding to the infarct. Microglial activation is ameliorated by the addition of minocycline. The rectangle indicates the region from which immunofluorescence images in b were obtained. b Immunofluorescence for TSPO, CD68, DAPI, and merged images, for the controls (top), stroke (middle), and stroke plus minocycline groups (bottom) at 22 days poststroke induction. In the infarct region, large numbers of activated microglia indicated by CD68 staining coexpress TSPO, whereas they are nearly absent in the non-infarct regions and in the controls.
Relationships Between [18F]PBR06 PET Accumulation, Time on Rotarod, and Microglial Protein Expression
Linear regression analyses indicated a significant relationship between tracer accumulation in the mouse brain and the time spent by the mouse on the rotarod (Table 3). Brain microglial proteins also showed highly significant associations with time spent on the rotarod during the experimental period. Regressing [18F]PBR06 uptake values on TSPO, CD68, and CD11B resulted in significant relationships between brain tracer uptake and microglial protein expression. Among the microglial proteins, TSPO and CD68 exhibited stronger association, compared to the association with CD11b.
Table 3. Relationship between motor function (time on rotarod) and microglial activation ([18F]PBR06 uptake) and microglial proteins (TSPO, CD68, and CD11B expression) in mice following stroke induction significance (p<0.05).
| Regression | Relationship | Significance (P=0.05) |
|---|---|---|
| [18F]PBR06 uptake on time on rotarod | Y=−0.008211×X+2.043 | 0.0271 |
| TSPO expression on time on rotarod | Y=4.597×X+2.316 | <0.0001 |
| CD68 expression on time on rotarod | Y=5.702×X+65.51 | <0.0001 |
| CD11B expression on time on rotarod | Y=1.475×X+15.77 | 0.0029 |
| [18F]PBR06 uptake on TSPO expression | Y=−117.3×X+403.9 | 0.0410 |
| [18F]PBR06 uptake on CD68 expression | Y=-134.5×X+535.1 | 0.0424 |
| [18F]PBR06 uptake on CD11B expression | Y=−45.33×X+155.4 | 0.0376 |
| TSPO expression on CD68 expression | Y=0.9293×X+121.9 | <0.0001 |
| TSPO expression on CD11B expression | Y=0.3573×X+11.49 | 0.0002 |
| CD68 expression on CD11B expression | Y=0.2150×X+13.27 | 0.0025 |
Discussion
Several PET radioligands have been developed as imaging agents for microglial neuroinflammation following stroke in human and animal models [10, 14, 27–29]. We previously characterized and validated [18F]PBR06 PET as an imaging methodology for SAN [17]. Our current study examines the ability of this methodology to image and characterize activated microglia-mediated SAN longitudinally in the same animal. We also seek to establish and evaluate a direct relationship between brain microglia and neurobehavioral motor function using our imaging methodology, and to explore the use of [18F]PBR06 PET as a screening tool for potential interventions in neurodegenerative disorders.
Importantly, in this study, we have characterized the temporal evolution of the poststroke neurologic inflammatory process in a single animal. We demonstrate that [18F]PBR06 PET successfully monitors microglia-mediated SAN over time, with peak microglial activation at 11 days PSI. Microglial activation remained relatively high over the next 11 days as demonstrated by [18F]PBR06 accumulation in the infarct regions relative to the non-infarct regions and the increased expression of the biomarkers of microglial activation, TSPO, CD68, and CD11b in the infarct regions.
Using regression analysis, we also demonstrated a significant association between microglial activation and motor function over the first 22-day period following the onset of stroke in mice. This relationship was further confirmed by demonstrating a highly significant association between the expression of three microglial proteins and motor function. The study thus demonstrates the use of a noninvasive methodology to show that motor function is directly associated with transient microglial activation over time following stroke.
At present, there are no clinically practical methods for evaluating or monitoring the microglial neuroinflammatory process in any disease model noninvasively over time in either animals or humans. As such, it is impossible to correlate neuroinflammation with changes in function, behavior, and cognition in the same animal over time. The current study successfully demonstrated that [18F]PBR06 PET was a feasible imaging methodology that could effectively correlate neuroinflammation with motor function in the same animal. Specifically, microglial activation as demonstrated by enhanced [18F]PBR06 accumulation and increased expression of TSPO and CD68, increased from 3 to 11 days PSI while motor function decreased proportionately. This observation was confirmed when minocycline, an anti-inflammatory intervention, reversed microglial activation 22 days PSI and also improved motor function at that time point.
This study further illustrates the use of [18F]PBR06 PET as a therapeutic response assessment tool. The tracer noninvasively monitored the effects of an anti-inflammatory intervention and correlated the imaging results with a measureable neurobehavioral outcome, thus demonstrating its use as a tool to screen interventions, and to assess the effectiveness of the interventions.
Previous research has indicated that there are at least two separate populations of microglial cells [30]. Distinguishing between the two microglial populations and their effects on a number of inflammatory processes has been challenging in part because markers such as CD11b are expressed on all microglia [28] while others like CD68 and TSPO may be expressed on microglia in their activated state [31, 32]. The pattern of microglial activation as shown by [18F]PBR06 PET imaging was consistent with the expression profiles of the imaging target, TSPO, and CD68, but less so with the expression profile of CD11b. These proteins have been used as biomarkers of resident microglial activation (TSPO and CD68) and suggest that the tracer uptake is through the resident microglia. The imaging methodology employed here could thus be conceivably used to differentiate between the biological effects of resident activated microglia and the total microglia.
Aspects of our major findings are consistent with reports in previous studies. The time course results agrees with another imaging study in which SAN was monitored using [18 F]DPA-714 PET in separate animals over time. Microglial activation was reported to peak at 11 days but reduced gradually over the next 20 days [33]. A second study that similarly characterized the microglial response in SAN with a myeloperoxidase (MPO)-based imaging agent and MRI determined that the MPO secreted from the microglia peaked within 3 to 7 days [34]. Other histology-based studies have reported that microglial activation peaks with 5–7 days PSI [35] up to 4 weeks PSI [36]. Our findings indicate that microglial activation is lower at 3 days relative to 11 days PSI. However, since we have no time measurement at 7 days PSI, microglial activation could conceivably peak between 7 and 11 days PSI.
Also consistent with our results, stroke has been reported to significantly reduce motor function in mice as measured by time spent on the accelerating rotarod on days 2, 7, 14, and 28 [37]. To the best of our knowledge, however, our study is the first to noninvasively and simultaneously evaluate microglial activation and its effect on motor function longitudinally in a preclinical disease model. The study offers the possibility of developing mathematical models and relationships to predict the progress of various neuroinflammatory and neurodegenerative disorders for which brain microglia may play a role in motor and behavioral outcomes.
Although a recent study found no effects on microglial activation following minocycline treatment [38], numerous studies report that minocycline improves neurologic function and decrease microglial activation PSI [5, 39, 40]. The current study makes use of this feature to demonstrate the ability of [18F]PBR06 PET as a noninvasive technique to evaluate the effects of a known intervention over time. Additionally, the technique helped establish a direct relationship between microglial activation and a neurologic outcome.
A limitation of the study pertains to the length of time the experiment was performed. Some studies have shown minocycline to be late-acting and it would be useful to determine if minocycline completely reverses microglial activation if the inflammatory process is monitored for a longer period of time.
Conclusions
In this study, we demonstrated that [18F]PBR06 PET is an effective methodology to characterize microglial neuroinflammation over time in a mouse model of stroke, with peak microglial expression at 11 days PSI. We further showed that increased microglial expression coincided with a reduction in motor function following stroke; that the increased microglial expression was primarily due to activated microglia. The study also confirmed that minocycline effectively reduced microglial activation at 22 days PSI and was effective in improving motor function at that particular time point. Finally, [18F]PBR06 PET was shown to be a potential tool to assess various interventions in a preclinical model of rodent neuroinflammation.
Acknowledgments
The authors thank Stanford Center for Innovation in In-Vivo Imaging.
Sources of Funding. Sources of funds were Stanford Bio-X Interdisciplinary Initiatives Program (IIP) Award and Cancer Research Award (to BWL), an NCI ICMIC P50 Award (CA114747 to Dr. Sanjiv Sam Gambhir), an AHA Grant (AHA-0835274 N to RG), a CIRM Grant (RC1-0134 to TDP), NRF and the Ministry of Education, Science and Technology, Korea grants (R31-10105 and NRF-2012M3A9C6049796 to GOA), the Li Ka Shing Foundation and the Department of Radiation Oncology, Stanford University.
Footnotes
Conflict of Interest. The authors declare they have no conflicts of interest
References
- 1.Coull BM. Inflammation and stroke—introduction. Stroke. 2007;38:631. [Google Scholar]
- 2.Wang Q, Tang XN, Yenari MA. The inflammatory response in stroke. J Neuroimmunol. 2007;184:53–68. doi: 10.1016/j.jneuroim.2006.11.014. [DOI] [PMC free article] [PubMed] [Google Scholar]
- 3.Milner R. Microglial expression of alphavbeta3 and alphavbeta5 integrins is regulated by cytokines and the extracellular matrix: beta5 integrin null microglia show no defects in adhesion or MMP-9 expression on vitronectin. Glia. 2009;57:714–723. doi: 10.1002/glia.20799. [DOI] [PubMed] [Google Scholar]
- 4.Crack PJ, Taylor JM. Reactive oxygen species and the modulation of stroke. Free Radic Biol Med. 2005;38:1433–1444. doi: 10.1016/j.freeradbiomed.2005.01.019. [DOI] [PubMed] [Google Scholar]
- 5.Liu Z, Fan Y, Won SJ, et al. Chronic treatment with minocycline preserves adult new neurons and reduces functional impairment after focal cerebral ischemia. Stroke. 2007;38:146–152. doi: 10.1161/01.STR.0000251791.64910.cd. [DOI] [PubMed] [Google Scholar]
- 6.Barreto G, Huang TT, Giffard RG. Age-related defects in sensorimotor activity, spatial learning, and memory in C57BL/6 mice. J Neurosurg Anesthesiol. 2010;22:214–219. doi: 10.1097/ANA.0b013e3181d56c98. [DOI] [PMC free article] [PubMed] [Google Scholar]
- 7.Palmer TD, Monje ML, Toda H. Inflammatory blockade restores adult hippocampal neurogenesis. Science. 2003;302:1760–1765. doi: 10.1126/science.1088417. [DOI] [PubMed] [Google Scholar]
- 8.Tatemichi TK, Desmond DW, Stern Y, et al. Cognitive impairment after stroke: frequency, patterns, and relationship to functional abilities. J Neurol Neurosurg Psychiatry. 1994;57:202–207. doi: 10.1136/jnnp.57.2.202. [DOI] [PMC free article] [PubMed] [Google Scholar]
- 9.Papadopoulos V, Baraldi M, Guilarte TR, et al. Translocator protein (18 kDa): new nomenclature for the peripheral-type benzodiazepine receptor based on its structure and molecular function. Trends Pharmacol Sci. 2006;27:402–409. doi: 10.1016/j.tips.2006.06.005. [DOI] [PubMed] [Google Scholar]
- 10.James ML, Fulton RR, Vercoullie J, et al. DPA-714, a new translocator protein-specific ligand: synthesis, radiofluorination, and pharmacologic characterization. J Nucl Med. 2008;49:814–822. doi: 10.2967/jnumed.107.046151. [DOI] [PubMed] [Google Scholar]
- 11.Gerhard A, Neumaier B, Elitok E, et al. In vivo imaging of activated microglia using [11C]PK11195 and positron emission tomography in patients after ischemic stroke. Neuroreport. 2000;11:2957–2960. doi: 10.1097/00001756-200009110-00025. [DOI] [PubMed] [Google Scholar]
- 12.Cagnin A, Kassiou M, Meikle SR, Banati RB. Positron emission tomography imaging of neuroinflammation. Neurotherapeutics. 2007;4:443–452. doi: 10.1016/j.nurt.2007.04.006. [DOI] [PMC free article] [PubMed] [Google Scholar]
- 13.Imaizumi M, Kim HJ, Zoghbi SS, et al. PET imaging with [11C]PBR28 can localize and quantify upregulated peripheral benzodiazepine receptors associated with cerebral ischemia in rat. Neurosci Lett. 2007;411:200–205. doi: 10.1016/j.neulet.2006.09.093. [DOI] [PubMed] [Google Scholar]
- 14.James ML, Fulton RR, Henderson DJ, et al. Synthesis and in vivo evaluation of a novel peripheral benzodiazepine receptor PET radioligand. Bioorg Med Chem. 2005;13:6188–6194. doi: 10.1016/j.bmc.2005.06.030. [DOI] [PubMed] [Google Scholar]
- 15.Yui J, Hatori A, Kawamura K, et al. Visualization of early infarction in rat brain after ischemia using a translocator protein (18 kDa) PET ligand [11C]DAC with ultra-high specific activity. Neuroimage. 2011;54:123–130. doi: 10.1016/j.neuroimage.2010.08.010. [DOI] [PubMed] [Google Scholar]
- 16.Yui J, Maeda J, Kumata K, et al. 18 F-FEAC and 18 F-FEDAC: PET of the monkey brain and imaging of translocator protein (18 kDa) in the infarcted rat brain. J Nucl Med. 2010;51:1301–1309. doi: 10.2967/jnumed.109.072223. [DOI] [PubMed] [Google Scholar]
- 17.Lartey FM, Ahn GO, Shen B, et al. PET imaging of stroke-induced neuroinflammation in mice using [F]PBR06. Mol Imaging Biol. 2014;16(1):109–117. doi: 10.1007/s11307-013-0664-5. [DOI] [PMC free article] [PubMed] [Google Scholar]
- 18.Martin A, Boisgard R, Kassiou M, Dolle F, Tavitian B. Reduced PBR/TSPO expression after minocycline treatment in a rat model of focal cerebral ischemia: a pet study using [F-18]DPA-714. Mol Imaging Biol. 2011;13:10–15. doi: 10.1007/s11307-010-0324-y. [DOI] [PubMed] [Google Scholar]
- 19.Liu ZY, Fan Y, Won SJ, et al. Chronic treatment with minocycline preserves adult new neurons and reduces functional impairment after focal cerebral ischemia. Stroke. 2007;38:146–152. doi: 10.1161/01.STR.0000251791.64910.cd. [DOI] [PubMed] [Google Scholar]
- 20.Briard E, Zoghbi SS, Simeon FG, et al. Single-step high-yield radiosynthesis and evaluation of a sensitive 18 F-labeled ligand for imaging brain peripheral benzodiazepine receptors with PET. J Med Chem. 2009;52:688–699. doi: 10.1021/jm8011855. [DOI] [PMC free article] [PubMed] [Google Scholar]
- 21.Mao Y, Yang GY, Zhou LF, Stern JD, Betz AL. Focal cerebral ischemia in the mouse: description of a model and effects of permanent and temporary occlusion. Brain Res Mol Brain Res. 1999;63:366–370. doi: 10.1016/s0169-328x(98)00271-x. [DOI] [PubMed] [Google Scholar]
- 22.Sakata H, Niizuma K, Yoshioka H, et al. Minocycline-preconditioned neural stem cells enhance neuroprotection after ischemic stroke in rats. J Neurosci. 2012;32:3462–3473. doi: 10.1523/JNEUROSCI.5686-11.2012. [DOI] [PMC free article] [PubMed] [Google Scholar]
- 23.Lartey FM, Ahn GO, Shen B, et al. PET imaging of stroke-induced neuroinflammation in mice using [(18)F]PBR06. Mol Imaging Biol: MIB: Off Publ Acad Mol Imaging. 2014;16:109–117. doi: 10.1007/s11307-013-0664-5. [DOI] [PMC free article] [PubMed] [Google Scholar]
- 24.Hudson HM, Larkin RS. Accelerated image reconstruction using ordered subsets of projection data. IEEE Trans Med Imaging. 1994;13:601–609. doi: 10.1109/42.363108. [DOI] [PubMed] [Google Scholar]
- 25.Habte F, Ren G, Doyle TC, et al. Impact of a multiple mice holder on quantitation of high-throughput micropet imaging with and without Ct attenuation correction. Mol Imaging Biol. 2013;15:569–575. doi: 10.1007/s11307-012-0602-y. [DOI] [PMC free article] [PubMed] [Google Scholar]
- 26.Graves EE, Quon A, Loo BW., Jr RT_Image: an open-source tool for investigating PET in radiation oncology. Technol Cancer Res Treat. 2007;6:111–121. doi: 10.1177/153303460700600207. [DOI] [PubMed] [Google Scholar]
- 27.Yui J, Hatori A, Kawamura K, et al. Visualization of early infarction in rat brain after ischemia using a translocator protein (18 kDa) PET ligand [C-11]DAC with ultra-high specific activity. Neuroimage. 2011;54:123–130. doi: 10.1016/j.neuroimage.2010.08.010. [DOI] [PubMed] [Google Scholar]
- 28.Carson MJ, Bilousova TV, Puntambekar SS, et al. A rose by any other name? The potential consequences of microglial heterogeneity during CNS health and disease. Neurotherapeutics. 2007;4:571–579. doi: 10.1016/j.nurt.2007.07.002. [DOI] [PMC free article] [PubMed] [Google Scholar]
- 29.Martin A, Boisgard R, Theze B, et al. Evaluation of the PBR/TSPO radioligand [F-18]DPA-714 in a rat model of focal cerebral ischemia. J Cereb Blood Flow Metab. 2010;30:230–241. doi: 10.1038/jcbfm.2009.205. [DOI] [PMC free article] [PubMed] [Google Scholar]
- 30.Kettenmann H, Hanisch UK, Noda M, Verkhratsky A. Physiology of microglia. Physiol Rev. 2011;91:461–553. doi: 10.1152/physrev.00011.2010. [DOI] [PubMed] [Google Scholar]
- 31.Chen MK, Guilarte TR. Translocator protein 18 kDa (TSPO): molecular sensor of brain injury and repair. Pharmacol Ther. 2008;118:1–17. doi: 10.1016/j.pharmthera.2007.12.004. [DOI] [PMC free article] [PubMed] [Google Scholar]
- 32.Perego C, De Fumagalli S, Simoni MG. Temporal pattern of expression and colocalization of microglia/macrophage phenotype markers following brain ischemic injury in mice. J Neuroinflammation. 2011;8:174. doi: 10.1186/1742B2094B8B174. [DOI] [PMC free article] [PubMed] [Google Scholar]
- 33.Martin A, Boisgard R, Theze B, et al. Evaluation of the PBR/TSPO radioligand [(18)F]DPA-714 in a rat model of focal cerebral ischemia. J Cereb Blood Flow Metab. 2010;30:230–241. doi: 10.1038/jcbfm.2009.205. [DOI] [PMC free article] [PubMed] [Google Scholar]
- 34.Breckwoldt MO, Chen JW, Stangenberg L, et al. Tracking the inflammatory response in stroke in vivo by sensing the enzyme myeloperoxidase. Proc Natl Acad Sci U S A. 2008;105:18584–18589. doi: 10.1073/pnas.0803945105. [DOI] [PMC free article] [PubMed] [Google Scholar]
- 35.d'Avila JC, Lam TI, Bingham D, et al. Microglial activation induced by brain trauma is suppressed by post-injury treatment with a PARP inhibitor. J Neuroinflammation. 2012;9:31. doi: 10.1186/1742-2094-9-31. [DOI] [PMC free article] [PubMed] [Google Scholar]
- 36.Rupalla K, Allegrini PR, Sauer D, Wiessner C. Time course of microglia activation and apoptosis in various brain regions after permanent focal cerebral ischemia in mice. Acta Neuropathol. 1998;96:172–178. doi: 10.1007/s004010050878. [DOI] [PubMed] [Google Scholar]
- 37.Zhang ZG, Zhang L, Jiang Q, et al. VEGF enhances angiogenesis and promotes blood-brain barrier leakage in the ischemic brain. J Clin Invest. 2000;106:829–838. doi: 10.1172/JCI9369. [DOI] [PMC free article] [PubMed] [Google Scholar]
- 38.Rueger MA, Muesken S, Walberer M, et al. Effects of minocycline on endogenous neural stem cells after experimental stroke. Neuroscience. 2012;215:174–183. doi: 10.1016/j.neuroscience.2012.04.036. [DOI] [PubMed] [Google Scholar]
- 39.Hayakawa K, Mishima K, Nozako M, et al. Delayed treatment with minocycline ameliorates neurologic impairment through activated microglia expressing a high-mobility group box1-inhibiting mechanism. Stroke. 2008;39:951–958. doi: 10.1161/STROKEAHA.107.495820. [DOI] [PubMed] [Google Scholar]
- 40.Converse AK, Larsen EC, Engle JW, et al. C-11-(R)-PK11195 PET imaging of microglial activation and response to minocycline in Zymosan-treated rats. J Nucl Med. 2011;52:257–262. doi: 10.2967/jnumed.110.082743. [DOI] [PMC free article] [PubMed] [Google Scholar]